
-
Paper Information
- Paper Submission
-
Journal Information
- About This Journal
- Editorial Board
- Current Issue
- Archive
- Author Guidelines
- Contact Us
International Journal of Virology and Molecular Biology
p-ISSN: 2163-2219 e-ISSN: 2163-2227
2026; 15(7): 167-173
doi:10.5923/j.ijvmb.20261507.04
Received: Sep. 22; Accepted: Oct. 16, 2026; Published: Oct. 26, 2026

Sweets and Carbonated/Energy Drink Consumption in Relation to Cognitive Performance, and Sweets Consumption in Relation to BMI, among 8–10-Year-Old Schoolchildren in Namangan Region, Uzbekistan
 Abstract
 Reference
 Full-Text PDF
 Full-text HTML
Ulukhujaeva N. N.
Namangan State University, Namangan Respublic of Uzbekistan
Correspondence to: Ulukhujaeva N. N., Namangan State University, Namangan Respublic of Uzbekistan.
| Email: |  |
Copyright © 2026 The Author(s). Published by Scientific & Academic Publishing.
This work is licensed under the Creative Commons Attribution International License (CC BY).
http://creativecommons.org/licenses/by/4.0/

This study investigates the association between the consumption of sweets and carbonated/energy drinks, cognitive performance, and anthropometric status among 8–10-year-old schoolchildren in three areas of the Namangan Region, Uzbekistan: Yangikurgan District, Mingbuloq District, and Namangan City. A total of 72 paired comparisons were conducted for cognitive indicators, including speech, logical reasoning, memory, and attention, and 18 paired comparisons were performed for anthropometric indicators, with body mass index (BMI) used as the primary measure. Among the assessed cognitive parameters, only logical reasoning demonstrated a statistically significant association with the consumption of sweets and carbonated/energy drinks. The anthropometric analysis revealed a consistent regional pattern: across all age groups in Yangikurgan and Mingbuloq districts, students with higher consumption of sweets had higher mean BMI values, with differences ranging from Δ = +1.04 to +3.59. In contrast, this association was not observed in Namangan City, where BMI differences ranged from Δ = −1.89 to +0.03. The recurrence of a similar regional pattern across the examined cognitive and anthropometric indicators suggests that the observed associations may reflect systematic differences between the study areas rather than random variation. These findings highlight the potential importance of dietary patterns and contextual factors in relation to cognitive and anthropometric outcomes among school-aged children. Further studies with larger samples and longitudinal designs are warranted to clarify the underlying mechanisms and determine the temporal and causal relationships between dietary consumption, cognitive performance, and BMI.
Keywords: Primary school age, Children’s nutrition, Sweets, Carbonated drinks, Free sugar, Cognitive indicators, Body mass index
Cite this paper: Ulukhujaeva N. N., Sweets and Carbonated/Energy Drink Consumption in Relation to Cognitive Performance, and Sweets Consumption in Relation to BMI, among 8–10-Year-Old Schoolchildren in Namangan Region, Uzbekistan, International Journal of Virology and Molecular Biology, Vol. 15 No. 7, 2026, pp. 167-173. doi: 10.5923/j.ijvmb.20261507.04.
1. Introduction
- According to UNICEF's 2025 report “Feeding Profit: How Food Environments Are Failing Children,” for the first time in history, obesity among school-age children and adolescents worldwide is being recorded more frequently than underweight: approximately 20% (391 million) of children aged 5 - 19 are living with overweight, while 9.4% are living with obesity [8]. The report identifies the increasing prevalence of ultra-processed foods - rich in sugar, salt, and unhealthy fats - in children's diets as the primary driver of this trend [8].According to the World Health Organization (WHO), excessive consumption of free sugars increases the risk of obesity and metabolic disorders [1], a finding that is also reflected in the core guidelines of the Russian school of nutrition science [14]. However, the effects of sugar are not limited to metabolic outcomes: according to a systematic review and meta-analysis covering 77 studies published in 2023, a statistically significant positive association between excess sugar consumption and the risk of cognitive impairment was identified in the majority of cross-sectional and cohort studies, with the effect primarily concentrated on executive functions related to blood glucose regulation [2]. Comprehensive reviews conducted among children and adolescents have shown that a diet low in fish, fruits, and vegetables but high in fast food and sugary beverages is associated with lower cognitive performance and academic achievement [3], including lower rates of academic growth in subsequent years among children who regularly consume fast food [4]. At the same time, regular breakfast consumption is noted as a factor positively influencing cognitive performance and academic achievement [9], while a balanced intake of vitamins and minerals in children’s diets is considered an essential prerequisite for physical and mental development [17,18].The 7 - 10 age range in particular is considered, according to leading guidelines in pediatrics, a period of intensive development of the central nervous system and higher cognitive functions, including executive functions (logical reasoning, planning, and attention control) [12,13], and dietary quality during this period may directly affect both brain development and physical growth. Large-scale cross-sectional studies conducted in China have identified a statistically significant association between the consumption of sugary beverages and candy/sweets and children’s performance on indicators such as verbal comprehension (VCI) and digit span [5,6]. It should be particularly emphasized that diet is not the sole factor in children’s cognitive development: according to systematic reviews and meta-analyses, physical activity is also an independent factor positively influencing executive functions and academic achievement [10], while sleep duration - both independently and in combination with physical activity - is noted as a factor predicting the efficiency of executive functions [11]. For this reason, the dietary factor examined in this study should be considered only one component of the multifactorial system influencing children’s cognitive development. At the same time, in the local context - specifically across different types of areas in Namangan region (rural districts, small urban - type districts, and the regional center) - questions regarding the extent to which the dietary factor is expressed, and whether it manifests only in the cognitive domain or also in physical development, remain insufficiently studied. This article aims precisely to fill this gap.
2. Materials and Methods
- The study involved students aged 8, 9, and 10 years from general education schools in Yangikurgan district, Mingbuloq district, and Namangan city, Namangan region. Group allocation and measurement criteria were selected in accordance with established methodological guidelines for child and adolescent hygiene [15,16]. The study was conducted along two independent directions:Ø Cognitive direction: within each area and age group, students were divided into groups consuming and not consuming sweets/confectionery products, as well as into groups consuming carbonated/energy drinks and those consuming compote/juice/mineral water; their cognitive indicators (speech, logical reasoning, memory, attention) were assessed using standard psychophysiological test tasks.Ø Anthropometric direction: within each area and age group, students were divided into three groups according to the frequency of sweets consumption (daily consumers, every-other-day consumers, and rare/holiday-only consumers); height and body weight were measured, and body mass index was calculated (BMI = weight(kg)/height(m)²).For each group, the following statistical indicators were calculated: minimum (Min) and maximum (Max) values; the arithmetic mean and its standard error (M±m); the standard deviation (SD, σ); and the coefficient of variation (V=σ/M×100%), which reflects the degree of dispersion within the group (V<10% - low, 10–20% -moderate, >20% - high dispersion). The statistical significance of differences between groups in cognitive indicators was determined using Student's t-test: t=(M₁−M₂)/√(m₁²+m₂²), where the obtained value (Tf) was compared with the tabulated critical value (Tst, at p=0.05) corresponding to the degrees of freedom (f=n₁+n₂−2); when Tf>Tst, the difference was considered statistically significant (p<0.05). Differences in BMI between groups on anthropometric indicators were compared descriptively across the three consumption-level groups (high/moderate/low consumption).Research ObjectiveTo conduct a comparative statistical analysis of the relationship between the level of consumption of sweets and carbonated/energy drinks and the cognitive indicators (speech, logical reasoning, memory, attention) and anthropometric status (body mass index) of primary school-age students, across three regions and three age groups.Scientific Novelty of the StudyFor the first time, a comparative statistical analysis of four cognitive domains (speech, logical reasoning, memory, attention) AND anthropometric status (BMI) was conducted jointly, across three typical areas of Namangan region (a rural district, a district center, and the regional center city), with respect to two independent dietary factors (sweets and carbonated/energy drinks) simultaneously. The main methodological novelty of the study lies in the fact that, although the results of the two independent measurements (cognitive and anthropometric) were analyzed independently of one another, they revealed the same territorial pattern (a relationship expressed in Yangikurgan and Mingbuloq, but not expressed in Namangan) - this mutual corroboration between two independent indicators increases the reliability of the study’s findings.
3. Results
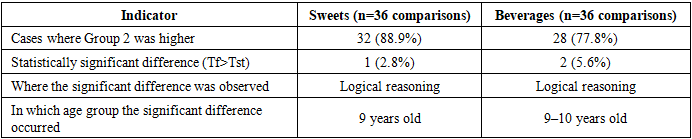
- Cognitive IndicatorsIn both research directions (sweets and beverages), a total of 36 paired comparisons were conducted for each direction across 3 regions × 3 age groups × 4 indicators, amounting to 72 paired comparisons overall. The summarized results are presented in Table 1:
|
|
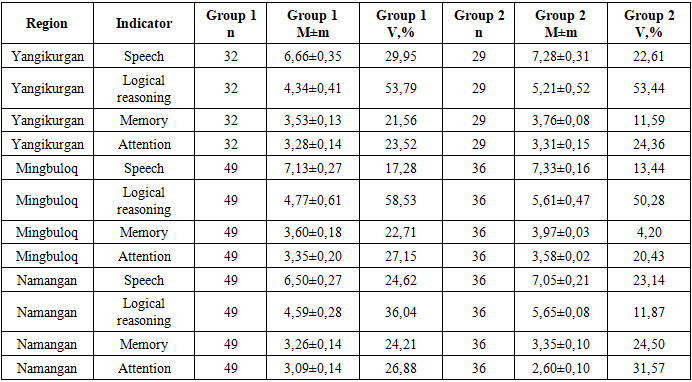
 Tst). A statistically significant difference was recorded in only three cases, and all three cases were found to relate specifically to the "logical reasoning" indicator (Table 3, Figure 1).
|

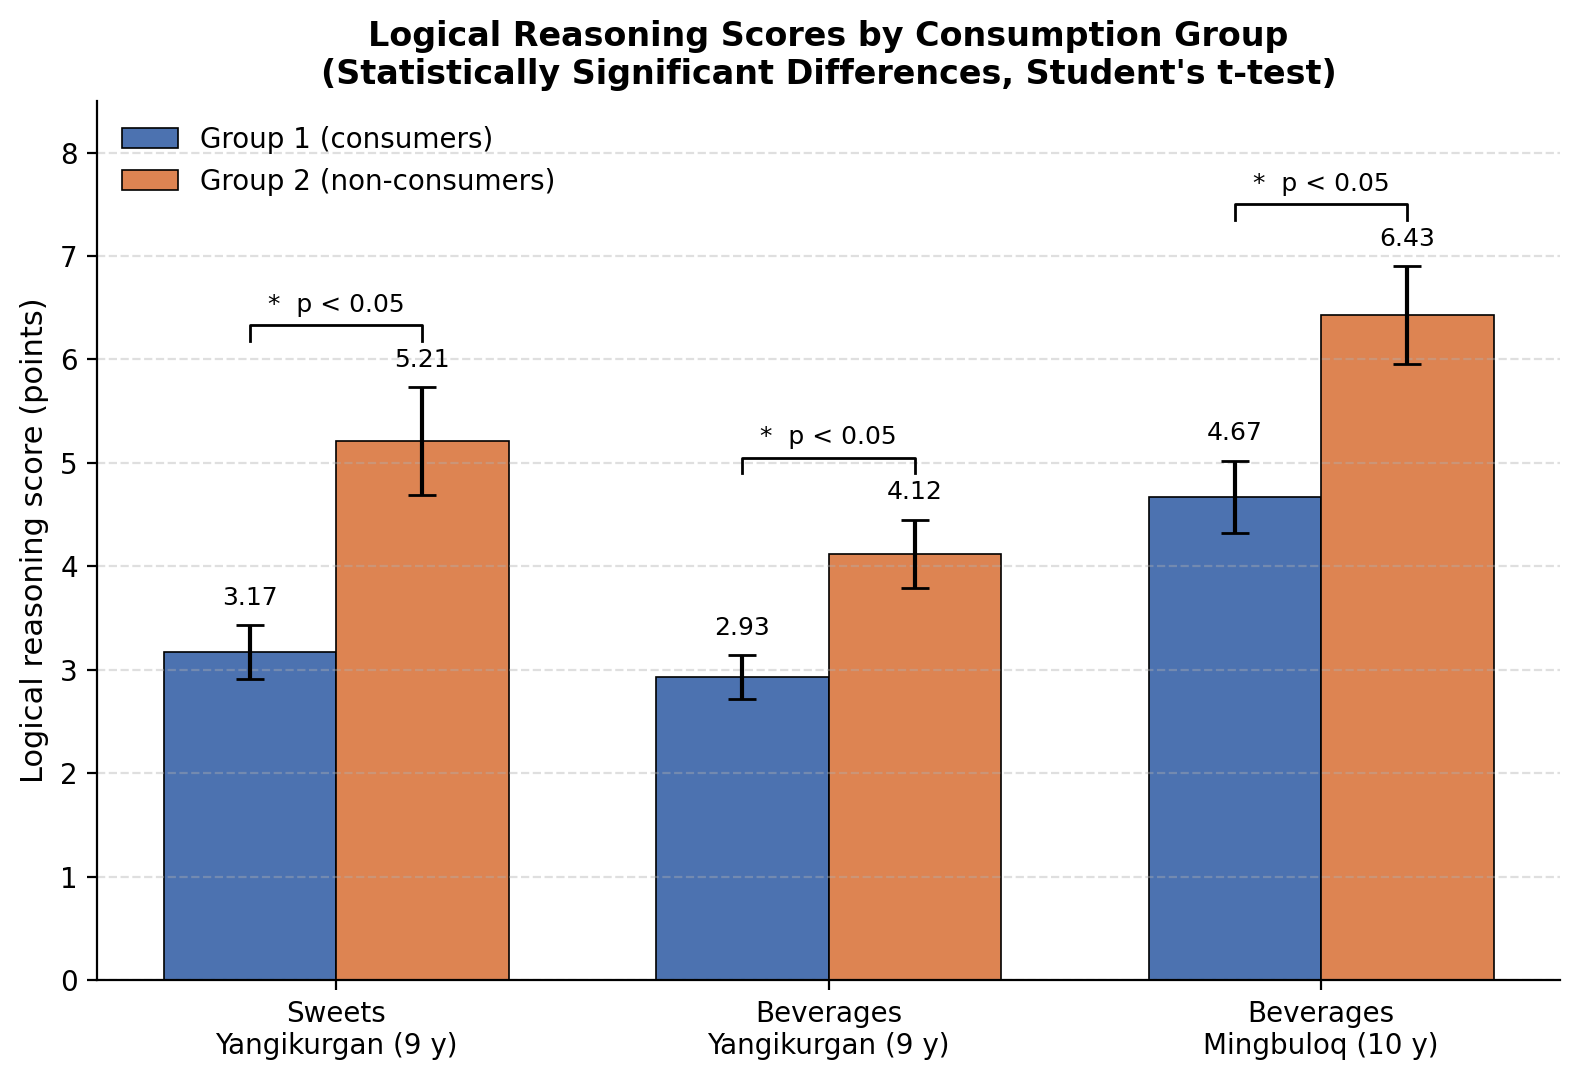 | Figure 1. Statistically significant differences: mean values (M±m) of Group 1 (consumers) and Group 2 (non-consumers), shown with error bars. * - p<0.05 |
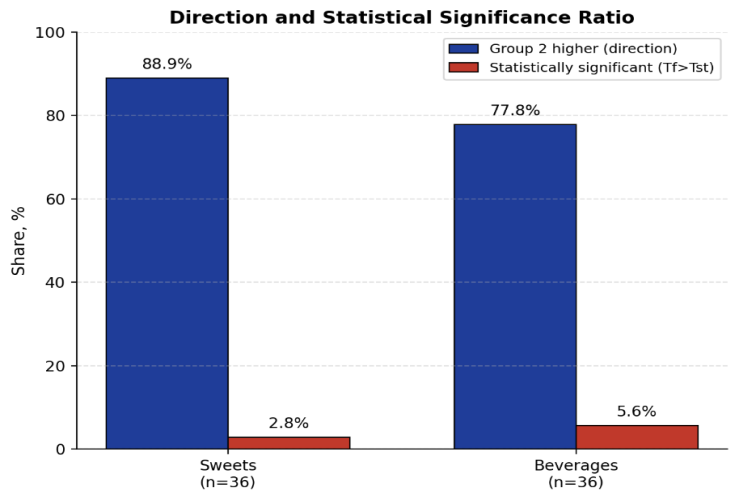 | Figure 2. Direction of advantage and share of statistical significance across both research directions Anthropometric Indicators (Body Mass Index) |
|
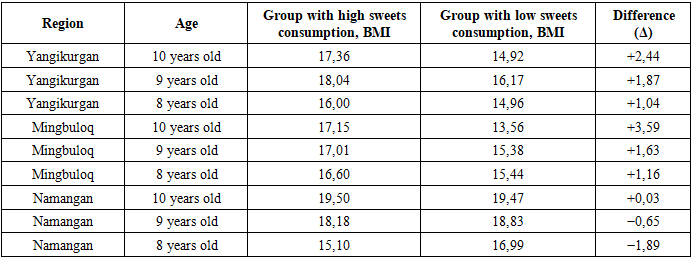
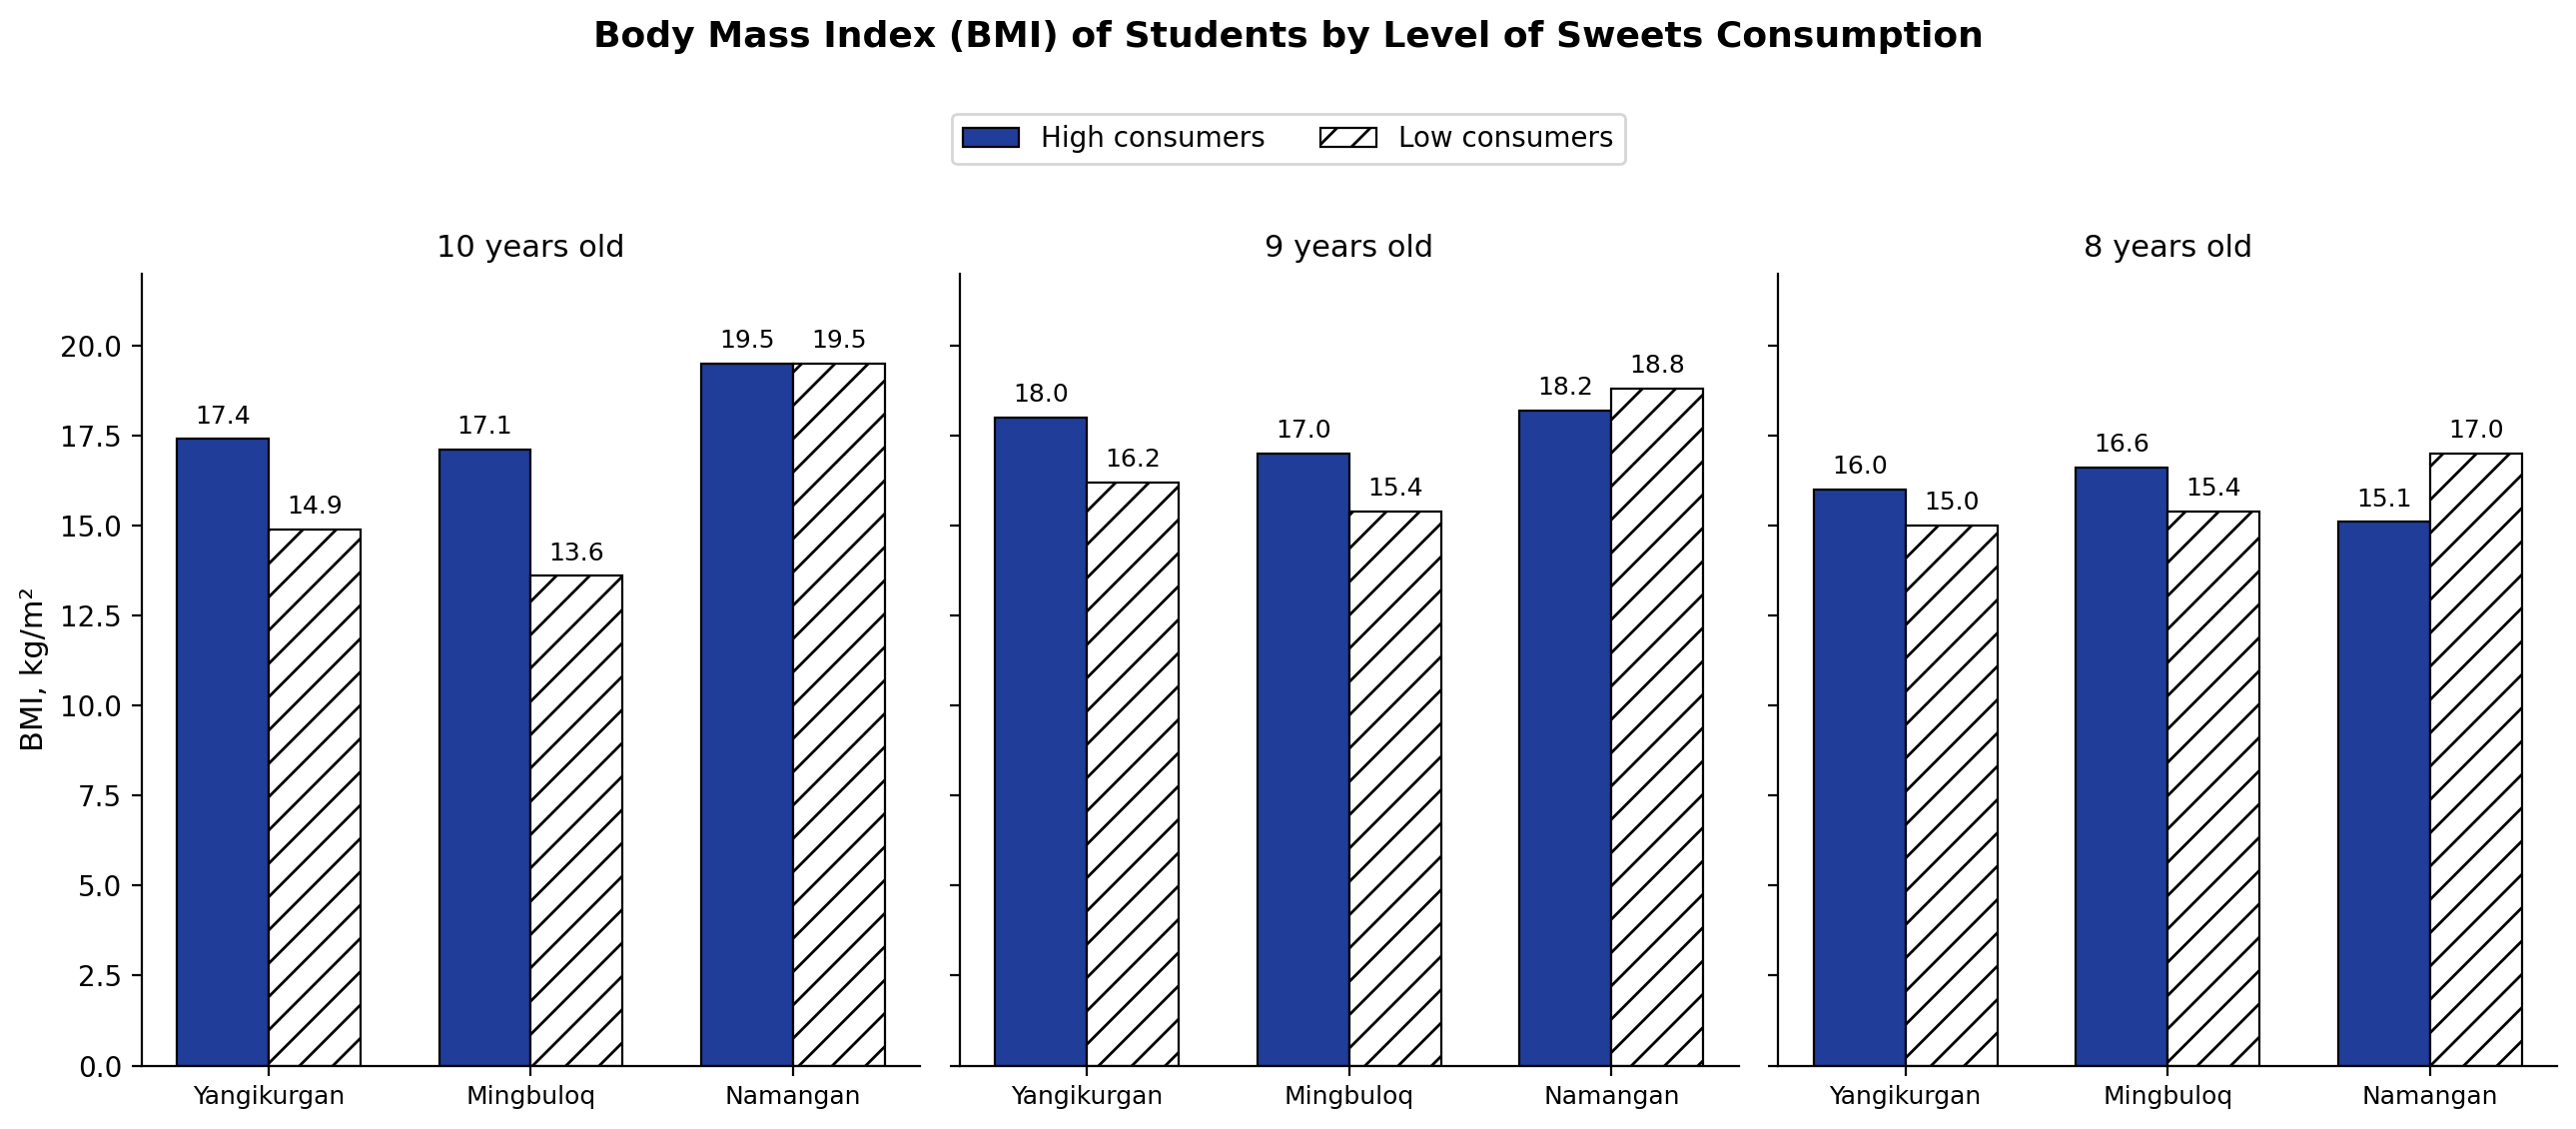 | Figure 3. Body mass index (BMI) of students by level of sweets consumption, across regions and age groups |
4. Discussion
- Why Specifically Logical Reasoning?The obtained results indicate that the relationship between sweets and carbonated beverage consumption and cognitive indicators is not uniform - it varies depending on the type of indicator, age group, and region. Among the four cognitive indicators, “logical reasoning” proved to be the most sensitive indicator. This finding shows partial consistency with foreign studies: a large-scale cross-sectional study conducted in China found that children who regularly consumed candy and sweet bakery products had significantly lower verbal comprehension index (VCI) scores [6], while the consumption of sugary beverages was noted to be associated with digit span and arithmetic task performance in adolescents [5].Expected Physiological MechanismsA classic experiment conducted in animals demonstrated that a diet high in sugar and fat reduces hippocampal brain-derived neurotrophic factor (BDNF) levels, as well as the levels of CREB and synapsin I proteins associated with synaptic plasticity, resulting in decreased spatial learning and memory performance [7]. Recent systematic reviews indicate that sugar may also affect prefrontal cortex-dependent executive functions (planning, logical-analytical reasoning) through blood glucose levels, emphasizing that stable blood glucose levels are necessary for effective cognitive performance [2]. From this perspective, the predominant change observed specifically in logical reasoning in our results may be explained by this indicator’s greater dependence on the prefrontal-executive system compared to hippocampal memory. At the same time, the identified BMI difference is explained by a metabolic mechanism (excess energy intake leading to weight gain), which represents a pathway entirely independent from the cognitive mechanism (mediated through neurotransmitter and neurotrophic factor levels) - making the fact that both mechanisms yield the same regional pattern particularly noteworthy.What Do the Regional Differences Mean?It is particularly noteworthy that statistically significant cognitive differences and BMI differences were recorded only in Yangikurgan and Mingbuloq districts (rural/district-type areas), while neither indicator showed significant differences in Namangan city. On one hand, this could be coincidental; on the other hand, it may be related to genuine regional factors: in urban settings, children’s dietary composition tends to be considerably more diverse (sweets consumption may be confounded with other factors such as physical activity, quality of education, and the level of parental supervision), or it may simply be related to differences in sample size and group distribution. The replication of the same pattern across two independent indicators (cognitive and anthropometric) increases the likelihood that this difference is not coincidental; however, confirming this would require additional studies specifically designed with larger samples and additional controlled factors.Limitations of the StudyThe study is cross-sectional in nature (a one-time measurement) and therefore reflects a statistical association rather than a causal relationship. The division into “consuming/non-consuming” groups was based on a questionnaire and does not account for the exact quantitative level of consumption (in grams or frequency). In the anthropometric analysis, BMI values were compared as raw values rather than according to age- and sex-specific percentile charts - this is sufficient for descriptive analysis but not sufficient for drawing medical conclusions at the individual child level. Furthermore, other potential confounding dietary factors (family socioeconomic status, physical activity, sleep patterns) were not separately controlled for.Practical Significance of the StudyThe obtained results indicate that limiting the consumption of sweets and carbonated beverages in children’s diets may be significant not only for physical health but also for cognitive development, particularly for logical-analytical reasoning ability. This finding can be used to develop practical recommendations for parents and educators, based on the age-specific rational nutrition standards adopted in the Republic of Uzbekistan (SanQvaM 0007-20) [19]. The consistent regional pattern obtained through two independent indicators can be used in developing practical recommendations for parents and educators, including substantiating the need to strengthen targeted preventive measures specifically in rural-type areas.
5. Conclusions
- ü A general trend is observed among primary school-age students whereby non-consumption of sweets and carbonated beverages is associated with higher cognitive indicators (in 78–89% of comparisons); however, a statistically significant difference was recorded only for the “logical reasoning” indicator.ü According to the anthropometric analysis, the BMI of students with high sweets consumption was consistently higher across all age groups in Yangikurgan and Mingbuloq districts (Δ=+1.04...+3.59), while in Namangan city this difference disappeared or was reversed (Δ=−1.89...+0.03).ü The independent replication of the same regional pattern (a relationship expressed in rural districts but not expressed in the regional center) across both cognitive and anthropometric indicators increases the likelihood that this pattern is not coincidental.ü The identified associations can be theoretically explained through the hippocampal BDNF mechanism confirmed in animal studies and the executive function–glucose relationship reported in human studies; however, these mechanisms were not directly examined within the scope of the present study.ü The results indicate that limiting the consumption of sweets and carbonated beverages in children's diets may be significant for both cognitive and physical development; however, confirming a causal relationship requires further studies with larger samples, longitudinal design, and control of confounding factors.