
-
Paper Information
- Next Paper
- Paper Submission
-
Journal Information
- About This Journal
- Editorial Board
- Current Issue
- Archive
- Author Guidelines
- Contact Us
International Journal of Virology and Molecular Biology
p-ISSN: 2163-2219 e-ISSN: 2163-2227
2026; 15(7): 151-156
doi:10.5923/j.ijvmb.20261507.01
Received: Sep. 22; Accepted: Oct. 16, 2026; Published: Oct. 20, 2026

Association of the PIK3R1 Gene Polymorphism rs3730089 with the Development of Type 2 Diabetes Mellitus
 Abstract
 Reference
 Full-Text PDF
 Full-text HTML
Saatov T. S.1, Abdurakhimov S. A.1, Nasriddinova P. M.1, Ibragimov Z. Z.1, Ibragimova E. A.1, Toshtemirov A. E.1, Axmedova S. O.2, Ziyovuddinov A. Kh.2
1Institute of Biophysics and Biochemistry at the National University of Uzbekistan named after Mirzo Ulugbek, Tashkent, Uzbekistan
2Tashkent Pharmaceutical Institute, Tashkent, Uzbekistan
Copyright © 2026 The Author(s). Published by Scientific & Academic Publishing.
This work is licensed under the Creative Commons Attribution International License (CC BY).
http://creativecommons.org/licenses/by/4.0/

The rs3730089 (Met326Ile) polymorphism of the PIK3R1 gene affects the p85α regulatory subunit of phosphoinositide 3-kinase (PI3K), potentially impairing insulin signaling pathway activity and thereby contributing to the development of insulin resistance and type 2 diabetes mellitus (T2DM). Results regarding this association across different populations have been inconsistent. The aim of this study was to evaluate the association between the rs3730089 polymorphism and the risk of developing T2DM in the Uzbek population. The study included 132 patients with T2DM and 156 apparently healthy individuals (control group) of Uzbek ethnicity. Genotyping was performed using the tetra-primer ARMS-PCR method, and the results were confirmed by sequencing; the identified sequence was registered in the GenBank database under accession number PZ290593.1. Genotype distribution in both groups conformed to the Hardy–Weinberg equilibrium. The frequency of the minor A allele was 15.38% in the control group and 23.48% in patients with T2DM (χ² = 6.07; p = 0.014; OR = 1.69; 95% CI 1.11–2.57). Significant associations were also identified for the heterozygous GA genotype (OR = 1.76; p = 0.045), the dominant model (OR = 1.82; p = 0.023), and the Cochran–Armitage trend test (p = 0.019); however, differences regarding the AA genotype and the recessive model did not reach statistical significance due to the low number of carriers. The statistical power of the analysis was 68.6%. The A allele of the rs3730089 polymorphism in the PIK3R1 gene is associated with an increased risk of developing T2DM in the Uzbek population; this association is considered nominally significant, and confirmation of the results in larger samples is required.
Keywords: PIK3R1 gene, rs3730089, Met326Ile, Type 2 diabetes mellitus, Polymorphism, ARMS-PCR, Uzbek population
Cite this paper: Saatov T. S., Abdurakhimov S. A., Nasriddinova P. M., Ibragimov Z. Z., Ibragimova E. A., Toshtemirov A. E., Axmedova S. O., Ziyovuddinov A. Kh., Association of the PIK3R1 Gene Polymorphism rs3730089 with the Development of Type 2 Diabetes Mellitus, International Journal of Virology and Molecular Biology, Vol. 15 No. 7, 2026, pp. 151-156. doi: 10.5923/j.ijvmb.20261507.01.
1. Introduction
- The rs3730089 polymorphism causes a missense mutation in the PIK3R1 gene; specifically, the methionine codon at position 326 (Met326Ile) in exon 8 is replaced by an isoleucine codon [1]. This genetic variant affects the p85α regulatory subunit of phosphoinositide 3-kinase (PI3K), which plays a crucial role in insulin signaling pathways [2]. Functional studies have shown that this amino acid substitution leads to reduced expression levels of the p85α protein while simultaneously increasing its binding affinity for the IRS-1 protein. This altered affinity negatively impacts PI3K signaling activity. Under normal conditions, the p85α subunit functions to stably anchor the p110 catalytic subunit to the cell membrane and correctly orient it toward the membrane. However, the monomeric form of the p85α subunit carrying the rs3730089 polymorphism—when not bound to p110—can compete with the p85-p110 heterodimer for phosphorylated tyrosine sites on the IRS-1 protein, thereby inhibiting PI3K signaling activity. The Met326Ile genetic variant affects the finely balanced activity of the PI3K enzyme by disrupting signal transduction. This condition can contribute to the development of insulin resistance. This molecular mechanism provides a solid biological basis for investigating the link between rs3730089 and the development of type 2 diabetes, given that efficient insulin signaling via the PI3K enzyme is crucial for insulin-mediated glucose uptake and metabolism in target tissues [3,4,5].Research findings regarding the association between rs3730089 and type 2 diabetes have been inconsistent across different study populations. While Ribel-Madsen et al. found that the *PIK3R1* gene variant rs3730089 had no effect on glucose metabolism in their twin cohort, they identified an association between the minor A allele of this variant and improvements in HOMA-IR (Homeostatic Model Assessment for Insulin Resistance) and BIGTT-Si (a measure of insulin sensitivity) among subjects in the Inter99 study—a population-based randomized controlled trial conducted in Copenhagen, Denmark (1999–2006), involving 6,784 individuals aged 30–60 [6]. This discrepancy between study populations suggests the influence of population-specific genetic backgrounds or environmental factors on the phenotypic expression of this polymorphism. Previous studies on this genetic variant have yielded similarly conflicting results. For instance, some studies have indicated an association between the rs3730089 polymorphism and alterations in glucose/insulin homeostasis. However, results from larger-scale studies have failed to consistently replicate these associations. These inconsistent findings are further complicated by the occurrence of alternative splicing (post-transcriptional mRNA modifications) that results in the expression of subunit isoforms (p85α, p55α, and p50α); these isoforms modulate the catalytic activity of PIK3R1 to varying degrees and regulate it in distinct ways. Nevertheless, the p85α subunit exerts the most potent regulatory influence on the insulin signaling pathway compared to the other subunits [7,8].Future research should focus on detailed phenotypic characterization across diverse populations and on larger, more robust studies that account for gene-gene or gene-environment interactions. Furthermore, functional studies investigating the tissue-specific effects of the rs3730089 polymorphism on insulin signaling in relevant metabolic tissues (such as skeletal muscle, liver, and adipose tissue) could provide clearer insights into its potential role in the pathogenesis of type 2 diabetes. As our understanding of the PI3K signaling pathway evolves, the significance of genetic variants like the rs3730089 polymorphism within this critical metabolic pathway may become better understood. This, in turn, will help shape personalized approaches to the prevention and treatment of diabetes.
2. Materials and Methods
- Research samplesTwo groups of ethnic Uzbeks were utilized for this study: a T2DM group consisting of patients diagnosed with type 2 diabetes mellitus (T2DM), and a control group consisting of individuals who showed no clinical signs of T2DM and had no prior diagnosis of the disease. The main group comprised 132 patients undergoing treatment at the Academician Yo.Kh. Turakulov Republican Specialized Scientific-Practical Medical Center of Endocrinology (RSSPMCE). The control group included 156 apparently healthy individuals (volunteers) who exhibited no clinical or biochemical signs of T2DM.The study protocol was approved by the Ethics Committee of the Institute of Biophysics and Biochemistry at the National University of Uzbekistan named after Mirzo Ulugbek (approval number BEC/IBB-NUU/2026/M-1). Written informed consent was obtained from all study participants after they had been fully informed about the study's objectives and conditions.Primer design for the PIK3R1 gene rs3730089 polymorphism For the study, primer sequences that meet ARMS-PCR requirements and are suitable for the accurate detection of the PIK3R1 gene rs3730089 polymorphism in the selected samples were chosen from previously published scientific studies [1] (Table 1).
|

|

3. Results
- Results of genotyping using the tetra-primer ARMS-PCR method and agarose gel electrophoresisThe tetra-primer ARMS-PCR method was used to determine the frequency of the rs3730089 polymorphism in the study groups. Four primers participate in the reaction simultaneously: two outer primers (forward and reverse) amplify a common fragment spanning the polymorphic locus, while two inner allele-specific primers (also divided into forward and reverse) synthesize shorter fragments specific to the respective alleles.Electrophoresis results showed that a common amplicon of 697 bp, generated by the outer primers, was synthesized in all samples. No amplicon synthesis was observed in the negative control sample. The allele-specific fragments were 423 bp in length for the A allele and 322 bp for the G allele. Accordingly, the genotypes were interpreted as follows: the presence of both 697 bp and 322 bp fragments corresponded to the GG homozygous genotype; 697 bp and 423 bp fragments to the AA homozygous genotype; and the simultaneous presence of all three fragments to the GA heterozygous genotype (Figure 1).
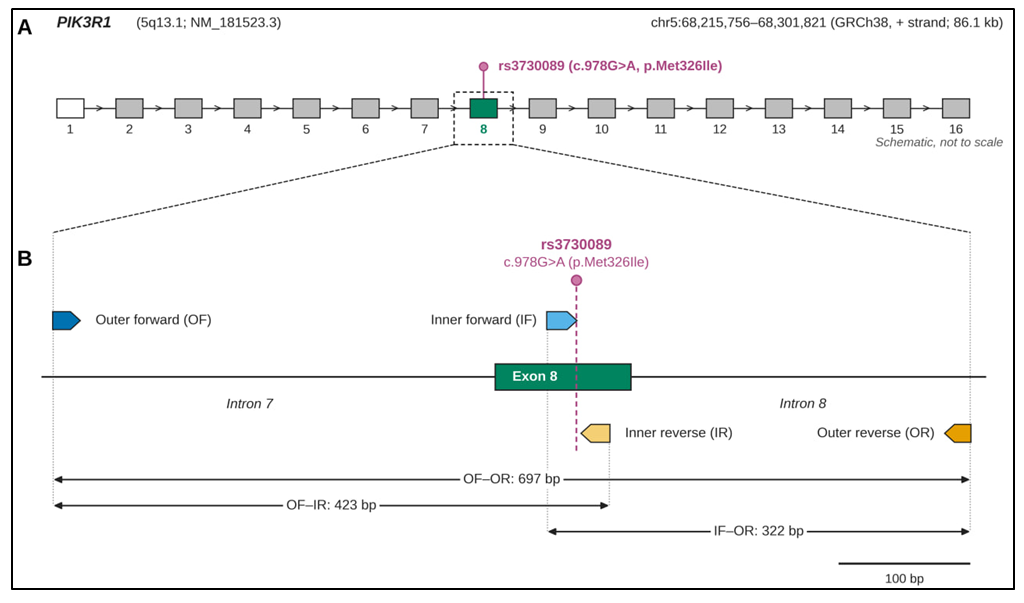 | Figure 1. Genomic location of the rs3730089 polymorphism and primer positions in the PIK3R1 gene. (A) Exon–intron organization of PIK3R1 (NM_181523.3; chr5q13.1, GRCh38; 16 exons; schematic, not to scale). The rs3730089 polymorphism (c.978G>A, p.Met326Ile) is located in exon 8 (referred to as exon 6 in earlier reports). The open box indicates the non-coding exon 1. (B) Enlarged view of the amplified region (intron 7–exon 8–intron 8; drawn to scale). Arrows indicate primer positions and orientation (5′→3′): OF, outer forward; OR, outer reverse; IF, inner forward; IR, inner reverse. Double-headed arrows indicate amplicon sizes: OF–OR, 697 bp; OF–IR, 423 bp; IF–OR, 322 bp. The dashed vertical line marks the position of rs3730089 |
|

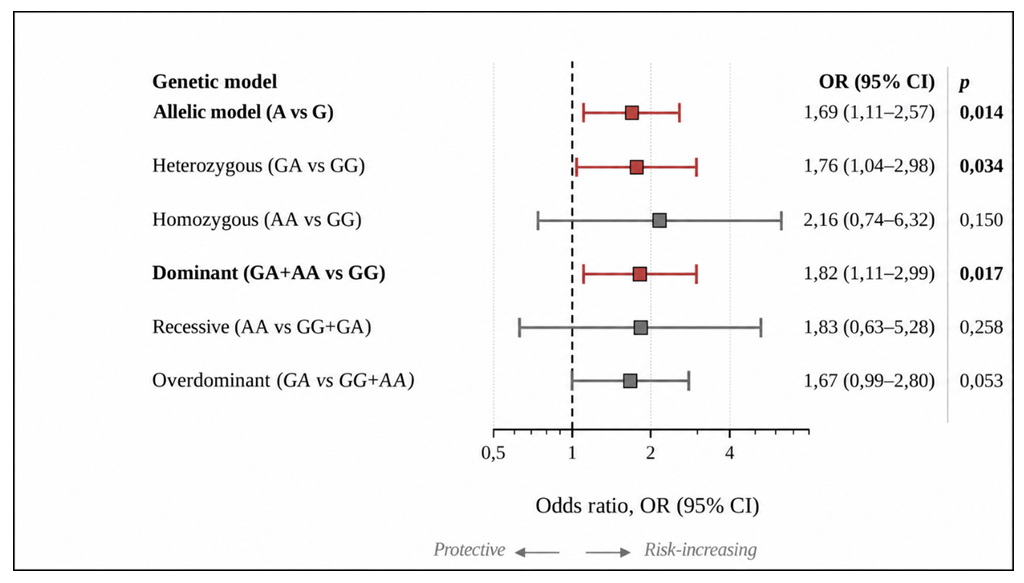 | Figure 2. Association of the PIK3R1 gene rs3730089 polymorphism with type 2 diabetes and analysis based on genetic models |
4. Discussion
- Our research regarding the rs3730089 polymorphism of the PIK3R1 gene aligns with the findings of Mir R. et al. conducted among the Saudi Arabian population regarding the direction of the effect [10]. In both studies, the A allele emerged as a risk factor for the development of type 2 diabetes, and the magnitude of the effect fell within a very similar range (OR = 1.69 and 1.49). However, it is worth noting a significant discrepancy in allele frequencies between the two studies: while the A allele occurred at a frequency of 15.38% in our control group, it accounted for 57% in the Saudi control group; effectively, the A allele was identified as the wild-type allele in their study. Such a stark difference may stem not only from population-specific characteristics but also from methodological variations in allele designation (such as strand orientation). Therefore, caution is advised when directly comparing frequencies. The frequency observed in our study groups for the rs3730089 (Met326Ile) genetic variant aligns more closely with figures reported for European populations. A particularly noteworthy aspect is that the effect of this polymorphism can vary depending on the phenotype. According to data from Daneshvar G. et al., the A allele exerts a protective effect against the development of breast cancer. In our studies, however, this allele increases the likelihood of developing Type 2 diabetes by 1.69-fold. This apparent contradiction can be interpreted in a biologically sound manner. In tumor cells, the PI3K/AKT pathway associated with the A allele variant is often hyperactivated compared to the normal state; consequently, increased p85α protein activity acts to counteract tumor cell progression (functioning as a tumor suppressor). This implies that a slight attenuation of the signal serves as a favorable factor against malignant transformation (the process by which normal cells convert into cancer cells). In metabolic tissues, however, this same attenuation leads to a detrimental outcome: reduced glucose uptake. Thus, a single genetic variant exerts opposing effects depending on the context of the specific tissue cells. This is a common type of antagonistic pleiotropy, demonstrating that when constructing genetic risk scores, it is insufficient to evaluate a single variant solely in the context of one disease.However, results obtained from studies on the Danish population contrast with our findings [6]. In that population, the A allele was associated with improved insulin sensitivity, whereas in our study, it was linked to an increased risk of T2DM. Several factors may account for these discrepancies: differences in the phenotypic levels assessed across groups (disease status versus quantitative measures of insulin sensitivity), variations in gene-environment interactions between populations, and the tissue-specific differential expression of p85α, p55α, and p50α isoforms. Thus, the direction of the effect associated with the rs3730089 polymorphism may depend on the study population, the phenotype being evaluated, and tissue-specific characteristics. Our results indicate that the A allele acts as a risk factor for T2DM development in the Uzbek population; however, as this association was significant only at a nominal level, validation in larger study cohorts is required.