Sh. Abdullaev1, F. Akbarov2, Sh. Abdupatteva3, T. Asatulloev4, D. Dekhkonov5, K. Tojibaev6, Kh. Khoshimov7, R. Gulomov7
1Teacher, Namangan State University, Namangan, Uzbekistan
2Junior Research Fellow, Institute of Botany of the Academy of Sciences of the Republic of Uzbekistan, Tashkent, Uzbekistan
3PhD Student, Namangan State University, Namangan, Uzbekistan
4PhD Student, Kunming Institute of Botany of the Chinese Academy of Sciences, Kunming, China
5Doctor of Biological Sciences, Namangan State University, Namangan, Uzbekistan
6Doctor of Biological Sciences, Institute of Botany of the Academy of Sciences of the Republic of Uzbekistan, Tashkent, Uzbekistan
7Doctor of Philosophy (PhD) in Biological Sciences, Namangan State University, Namangan, Uzbekistan
Copyright © 2024 The Author(s). Published by Scientific & Academic Publishing.
This work is licensed under the Creative Commons Attribution International License (CC BY).
http://creativecommons.org/licenses/by/4.0/

Abstract
Poa bactriana Roshev, a perennial monocot, serves as a crucial forage plant for both livestock and wildlife in Central Asia and the Himalayas. Despite its ecological importance, our understanding of its distribution and ecological niche remains limited, raising concerns about its vulnerability to climate change and anthropogenic impacts. In this study, we employed Maxent, a Species Distribution Modeling (SDM) method, to predict the present and future distribution of P. bactriana using occurrence data and environmental variables. Our analysis identified altitude, aridity index, and various bioclimatic and topographic variables as primary determinants influencing the distribution of P. bactriana. Presently, the species is predominantly concentrated in mountainous regions spanning Central Asia, Iran, Afghanistan, and select areas of Mongolia, Turkey, Russia, and China. However, projections under two climate change scenarios (RCP2.6 and RCP8.5) for 2050 reveal a significant decline in suitable habitat and habitat quality for P. bactriana. Elevations ranging from 1500 to 4000 meters emerged as optimal habitats, underscoring the critical importance of high-altitude landscapes in supporting this species. Our study provides novel insights into the ecology and biogeography of P. bactriana, emphasizing the urgent need for conservation and management strategies to safeguard its future amidst changing environmental conditions.
Keywords:
Species, Suitable habitat, High mountainous areas, Biogeography, P. bactriana
Cite this paper: Sh. Abdullaev, F. Akbarov, Sh. Abdupatteva, T. Asatulloev, D. Dekhkonov, K. Tojibaev, Kh. Khoshimov, R. Gulomov, Species Distribution Modelling of Poa Bactriana Roshev under Different Climate Change Scenarios, International Journal of Virology and Molecular Biology, Vol. 13 No. 1, 2024, pp. 15-21. doi: 10.5923/j.ijvmb.20241301.03.
1. Introduction
Poa bactriana Roshev is a monocot species with 5–70 cm high and with a loose, oblong or pyramidal panicle. Culms 35–70 cm tall, bulbous at the base, more or less erect. Leaves narrowly linear, 1–3 mm broad, flat or involute, rather scabrous. Panicles many–flowered and rather loose, oblong or pyramidical, the prominently scabrous branches 2–6 cm long (Komarov, 1934). Mainly occurs in mountain slopes and ravines. The species was described from Uzbekistan in 1923 and type specimen kept at Vascular Plants Herbarium of the Komarov Botanical Institute RAS (LE).Species Distribution Modelling (SDM) is a powerful tool for predicting the spatial and temporal patterns of species occurrence and abundance, based on environmental data and species records (Phillips, Anderson et al., 2006). SDM can be used for various purposes, such as exploring the ecological niche of a species, assessing the impacts of climate change and habitat loss, identifying potential areas for conservation and restoration, and understanding the evolutionary and biogeographical history of a species (Farashi and Alizadeh–Noughani, 2023). Up to present states of monocots in the examples of monocots under different climate change (Dekhkonov et al., 2023a), suitable habitat prediction (Asatulloyev et al., 2022), distribution patterns (Asatulloev et al., 2023; Dekhkonov et al., 2021; Tojibaev et al., 2022) and conservation issues (Dekhkonov et al., 2023b; Makhmudjanov et al., 2022) were investigated properly. It is also useful in identifying natural plantation areas for propagation of medicinal plants (Gulomov, 2023).One of the most widely used methods for SDM is the maximum entropy (Maxent) approach, which estimates the most uniform distribution of a species across the study area, subject to the constraints derived from the environmental variables and the species observations (Phillips, Dudík et al., 2004). Maxent has several advantages over other methods, such as being able to handle presence–only data, incorporating complex interactions and nonlinearities among variables, and providing a probabilistic output that can be interpreted as habitat suitability or relative abundance (Baldwin, 2009).In this study, we applied SDM using Maxent to model the distribution of P. bactriana, a perennial grass species native to Central Asia and the Himalayas. It is an important forage plant for livestock and wildlife, and has been used as a bioindicator of environmental conditions. However, little is known about its ecological niche and distribution patterns, and how they may change under future scenarios of climate change and land use. Therefore, we aimed to address the following research questions: What are the main environmental factors that determine the distribution of P. bactriana in its native range? How will the distribution and suitability of P. bactriana change under different climate change and land use scenarios in the future?To answer these questions, we used occurrence data of P. bactriana from various sources, including GBIF, and environmental data from WorldClim (Fick and Hijmans, 2017) and other sources. Our study provides novel insights into the ecology and biogeography of P. bactriana, and contributes to the conservation and management of this species and its habitats.
2. Materials and Methods
Data collection. The distribution of the species of P. bactriana was collected using a Global Positioning System (GPS) in Uzbekistan, Kyrgyzstan and from points available on the Global Biodiversity Information Facility website (GBIF, 2023). The study area comprised Central Asia, Iran, Afghanistan and small part of Mongolia, Russia and China (Figure 1).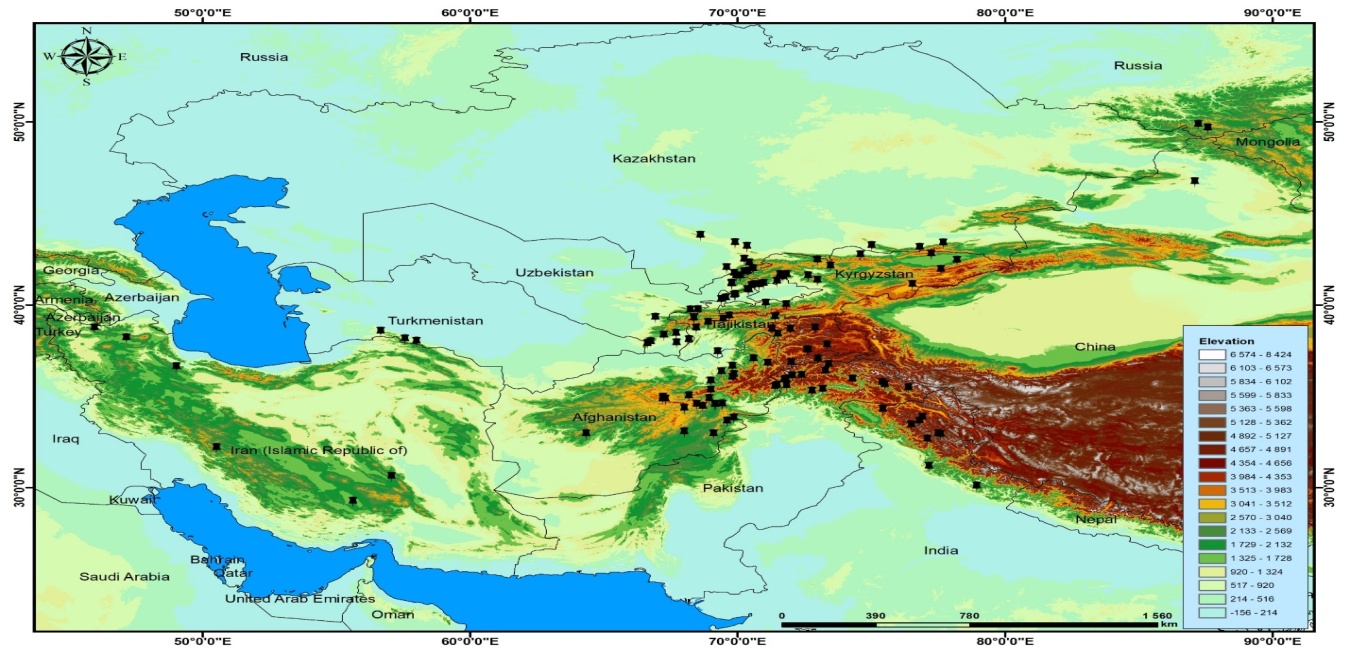 | Figure 1. Spatial distribution of sample points and elevation |
Preparing and choosing predictor variables: Bioclimatic variables used in this study were obtained from the WorldClim website (Fick and Hijmans, 2017). The environmental variables, which we believed to be complementary of the Bioclimatic data, were created using temperature minimum, maximum and precipitation data again downloaded from WorldClim using Envirem R package (Title and Bemmels, 2018). All variables downloaded, created, and edited for this study were in 30 arcsec resolution.Correlation analysis between variable pairs was performed with Spearman correlation analysis using ‘SDMTune’ R package on all 32 variables (R Core Team 2013, Vignali, Barras et al., 2020). Variable importance was revealed using four R packages which had features on variable selection steps in the modeling pre–processing stages. The libraries used in this stage were: ‘SDMTune’ (for variable selection via cross validated Maximum Entropy modeling (Vignali, Barras et al., 2020), ‘Embarcadero’ (for variable selection based on trees generated via BART algorithm), ‘Ecospat’ (for analyzing Variance Inflation Factor among variables) (Di Cola, Broennimann et al., 2017). Based on the predictions from the R libraries used and correlations (Pearson correlation) between variable pairs, we identified various number of variables that might be effective in the current distribution of each species. Then ‘Ellipsenm’ R package was used to evaluate and select the best model according to the criteria where the best model was the one statistically significant, with low omission rates, and low prevalence by calibrating candidate models.Modeling the species niches and future suitable distribution areas: Maximum Entrophy is the most prominent and widely used ENM technique in scientific research (Fitzpatrick, Gotelli et al. 2013). It can be implemented in a variety of packages in R including ‘dismo’ (Hijmans, Phillips et al, 2017), ‘SDMtune’ (Vignali, Barras et al., 2020), and ‘enmSdm’. In the model processing stage, we used the SDMtune for ENMs of P. bactriana. The objective of this package is to put together all methodological diversity developed within the ecological niche modeling field and represent a new, unified and user–friendly framework for the still–growing field of ecological niche modeling. Moreover, these new packages offer lots of frameworks to build and systematically tune ENMs to be able to get models with more predictive power. In building ENMs of species we followed the tutorials supplied by developers of R library developers.When modeling this type, I cross–validated using SDMtune. Then I had four cross–validated niche models using SDMTune. In the end using ‘GridSearch’ function, model hyperparameters of cross–validated models were tuned (Vignali, Barras et al., 2020).Model evaluation and creating suitability maps: In model evaluation AUC and TSS in all ENMs and CCMs of the species were used. Thresholds for interpreting the metric values were defined as follows: Value≥0.9=best, 0.9>Value≥0.8=very good, 0.8>Value≥0.7=good, and Value<0.7=weak (Allouche et al. 2006; Leroy et al. 2018). Five threshold values used in creating niche maps of the species. Accordingly, ‘0–0.2’ denotes unsuitable areas, ‘0.21–0.4’ areas of low suitable, ‘0.41–0.6’ areas of moderate suitable, ‘0.61–0.88’ high suitable areas and ‘0.81–1 very high suitable. Finally, suitable habitat maps for current and 2050 (Representative Concentration Pathway RCP2.6 and Representative Concentration Pathway RCP8.5) were created.Suitability territory estimation (in km2): Suitability territory estimation was calculated for current and two scenarios of 2050 for 5 thresholds (unsuitable, low suitable, moderate suitable, high suitable and very high suitable) of suitability using ArcGIS v10.8.After calculating suitability for the whole territory, we estimated elevational suitability change. After determining annual temperature and precipitation are vital variables in distribution of P. bactriana, we retrieved data from NASA to see whether are there any change in the temperature and precipitation amount for 1980–2020 years. Then we visualized the data in R software using ggplot2 package.
3. Results
We retrieved all biovariables from WorldClim and found out correlation between them. After excluding variables that showed high correlation, we calculated permutation importance. According to results, Altitude, Aridity Index, Bio7, Bio11, Bio12, Bio13, Bio18, Climatic Moisture, GloAspectCIE, GloAspectCIN, GloAspectCIS, GloAspectCIW, GloAspectCI3, GloAspectCI4, GloAspectCI5, GloAspectCI6, GloAspectCI7, GloAspectCI8 were most important variables in the distribution of P. bactriana (Figure 2).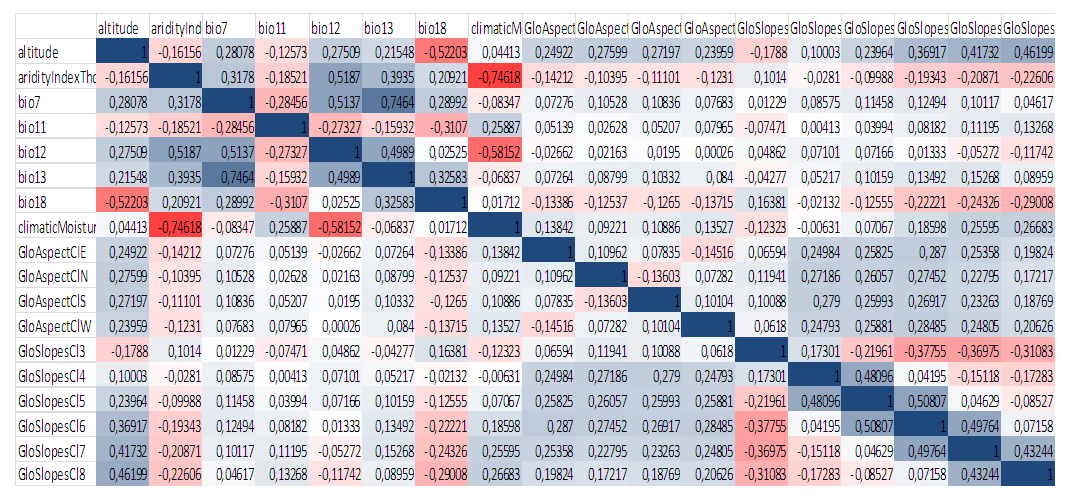 | Figure 2. Correlation between most important variables in distribution of P. bactriana |
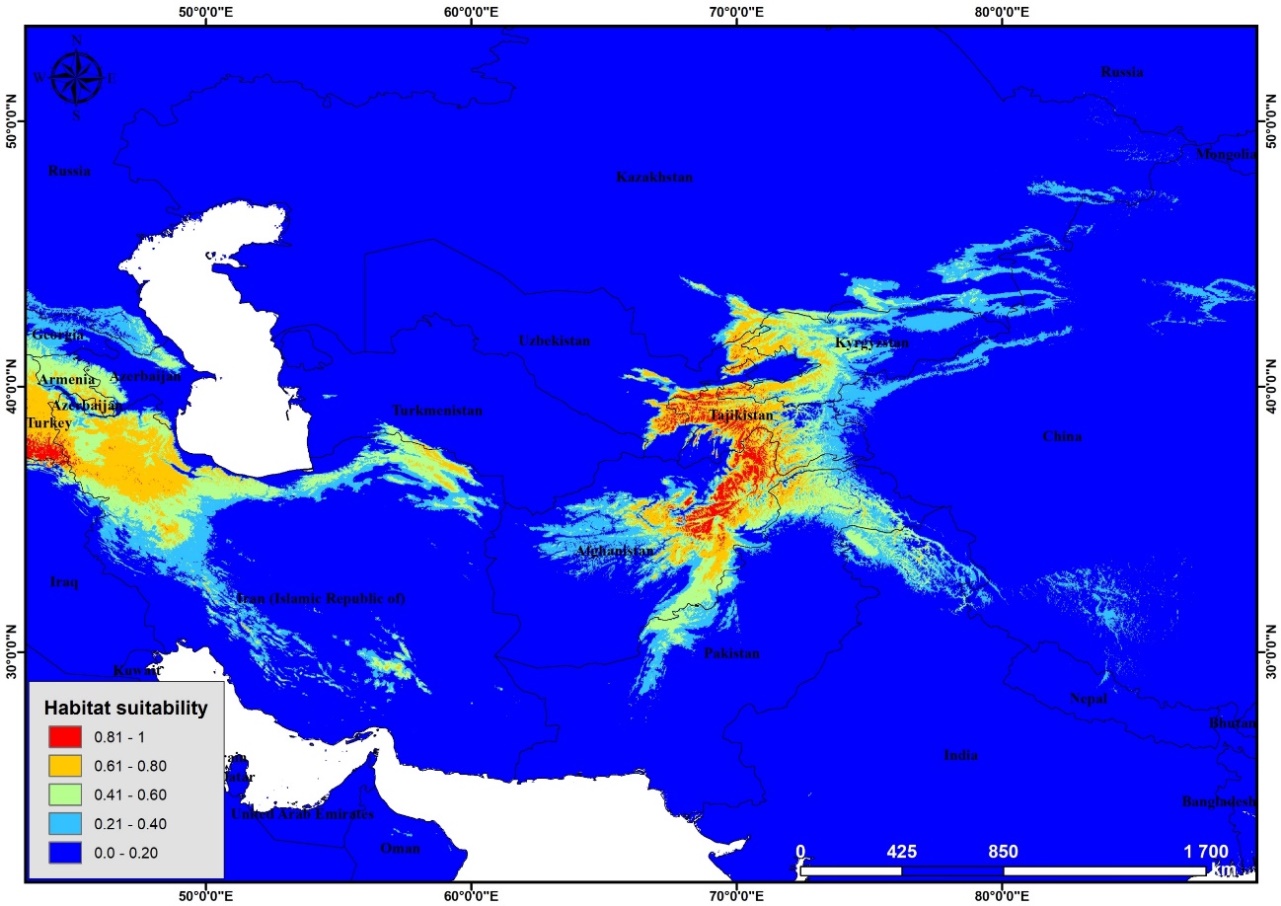
According to the results of modeling of current distribution of P. bactriana Central Asia, Iran, Afghanistan and small part of Mongolia, Turkey, Russia, and China were determined as most suitable areas for this species (Figure 3). Mostly, mountainous areas were identified as suitable habitat for this species.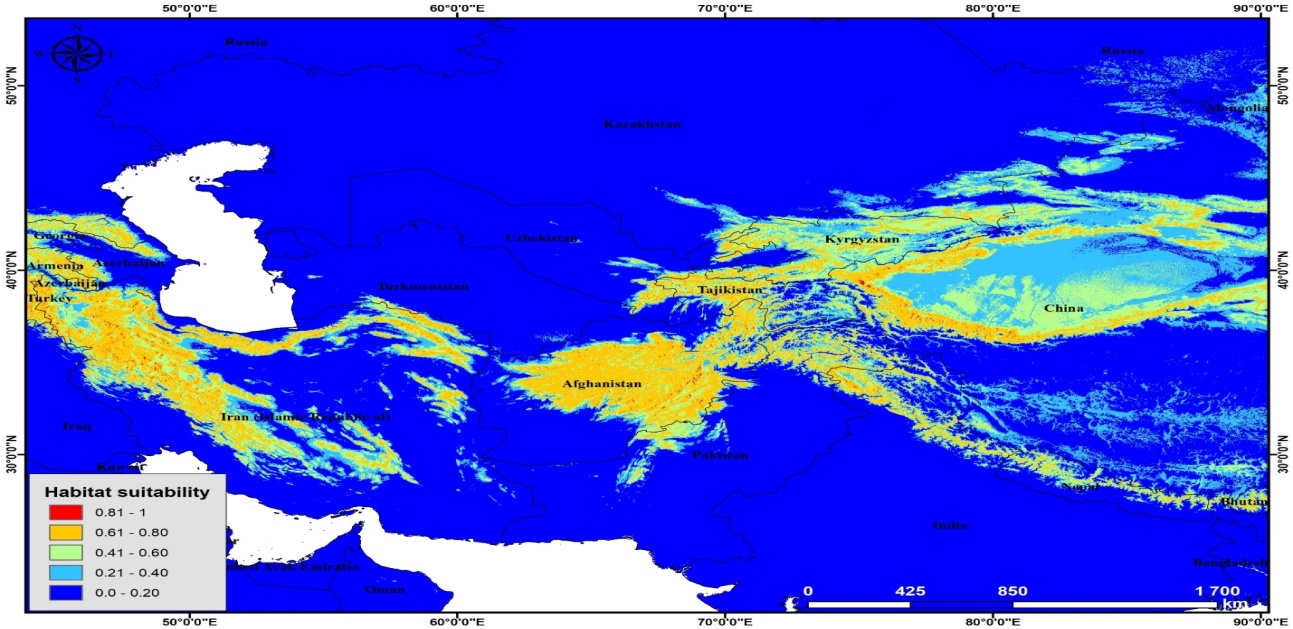 | Figure 3. Potential distribution of P. bactriana (current) |
The most surprising information was given by modeling suitable habitat for future (RCP2.6 2050 and RCP8.5 2050). According to the results predicted by these two scenarios the whole suitable territory will decrease sharply (Figure 4 and 5).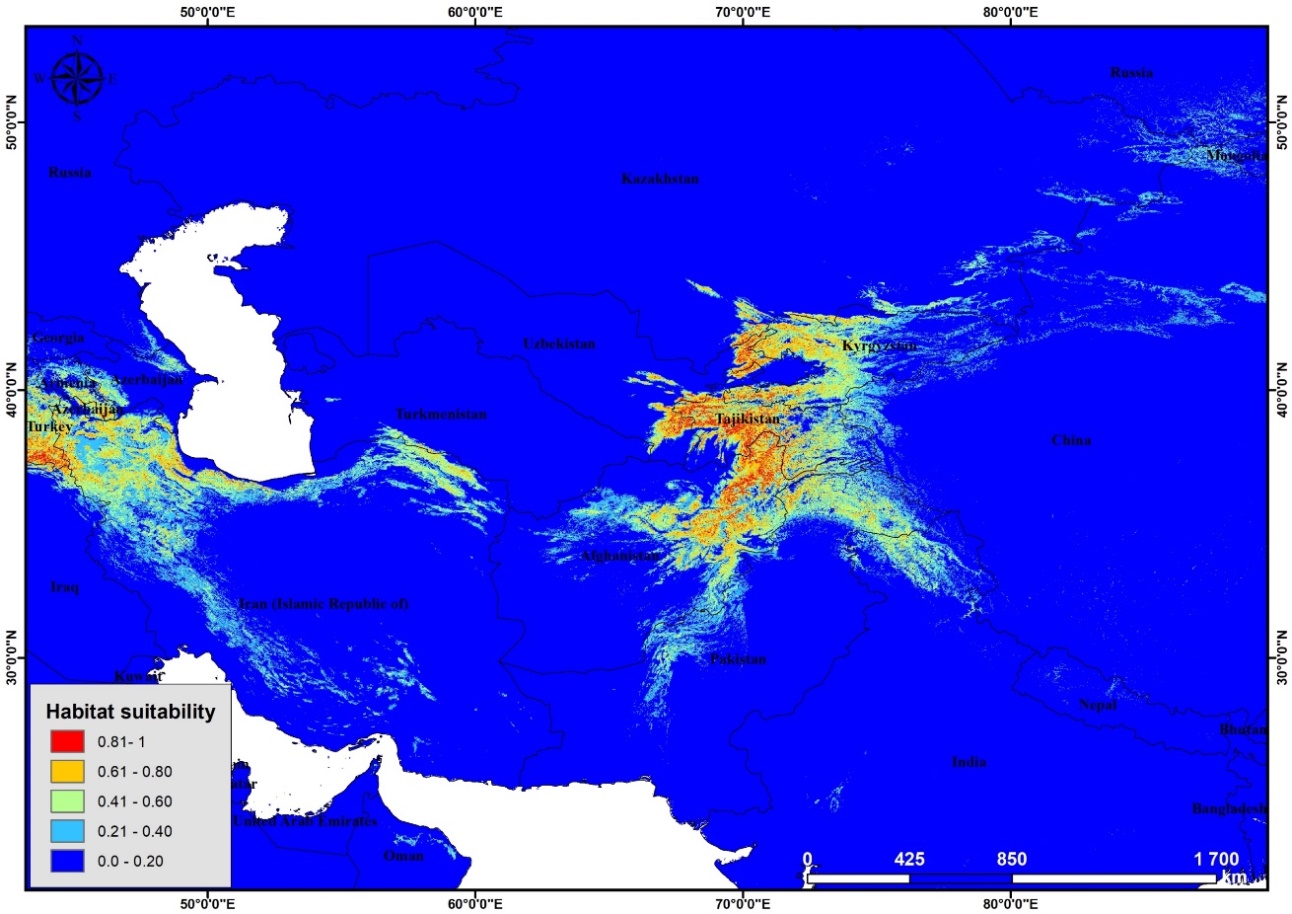 | Figure 4. Potential distribution of Poa bactriana (RCP2.6 2050) |
 | Figure 5. Potential distribution of Poa bactriana (RCP8.5 2050) |
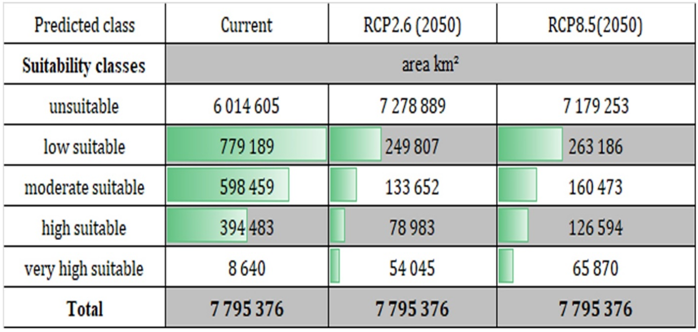
Our calculations on the suitable territories in current period for this species it was shown as follows: low suitable for current period was 779,189 km2, for RCP2.6 (2050) was 249,807 km2, RCP8.5 (2050) was 263,186 km2, moderate suitable for current period was 598,459 km2, for RCP2.6 (2050) was 133,652 km2, for RCP8.5 (2050) was 160,473 km2, high suitable for current period was 394,483 km2, for RCP2.6 (2050) was 78,983 km2, for RCP8.5 (2050) was 126,594 km2, very high suitable for current period was 8,640 km2, for RCP2.6 (2050) was 54,045 km2, for RCP8.5 (2050) was 65,870 km2 (Table 1). Surprisingly, all categories of suitability decreased hugely.Table 1. The potential areas of P. bactriana according to current and future climate change scenarios
 |
| |
|
4. Discussions
According to elevation based suitably analysis we found out that elevation range between 1500 and 4000 m were most suitable areas for this species indicating high mountainous areas are likely most suitable in the distribution of this species (Figure 6). The calculation of annual temperature change between 1980 and 2020 showed slightly increase of temperature in Altay, Hindu Kush, Pamir, Pamir–Alay, Tian Shan and Zagros (Figure 7). Subsequently, calculation of annual precipitation changed between 1980 and 2020. According to the results, precipitation amount in all mountains (except Pamir) changed moderately (Figure 8).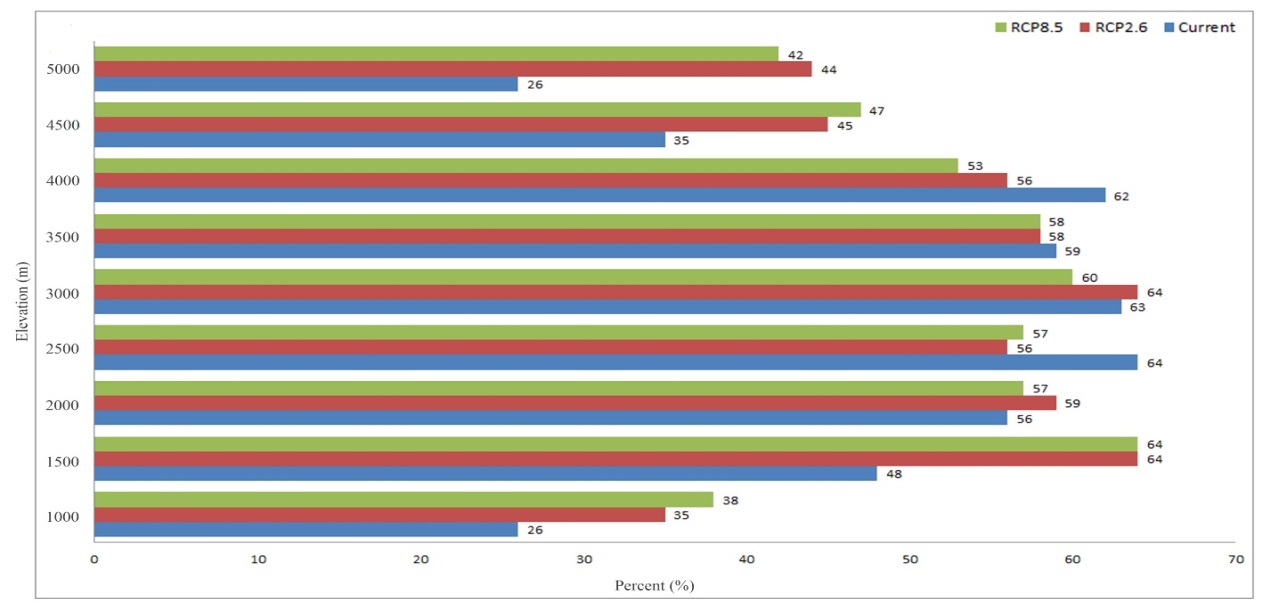 | Figure 6. The habitat suitability of elevation–based on elevation |
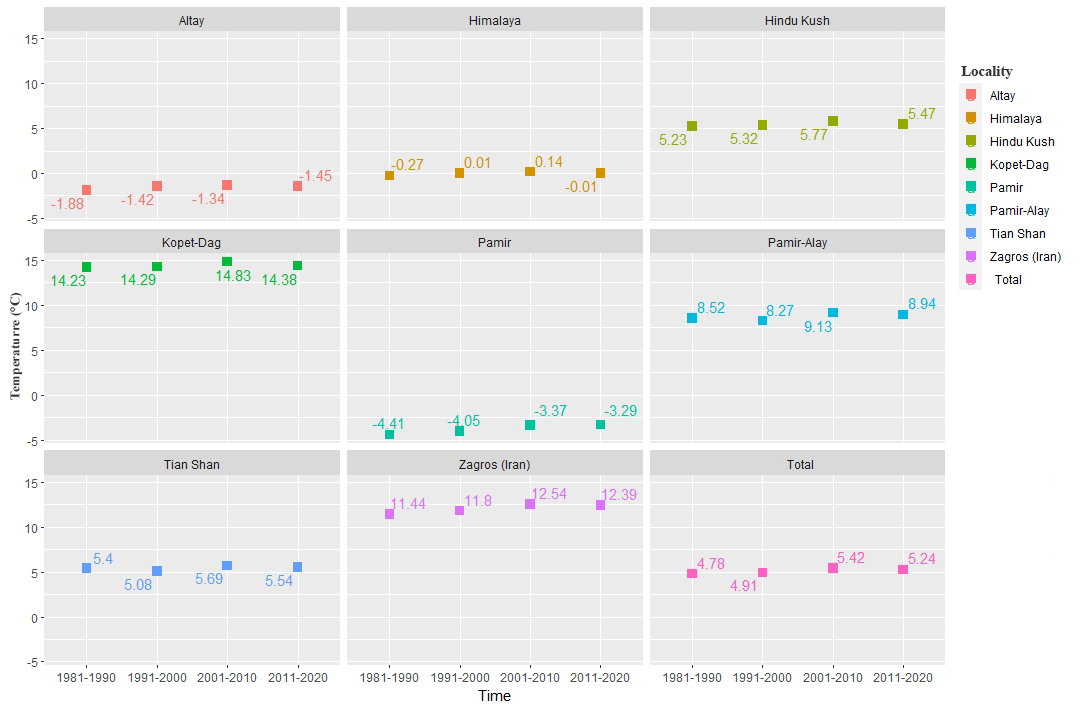 | Figure 7. The average annual temperature change between 1980 and 2020 |
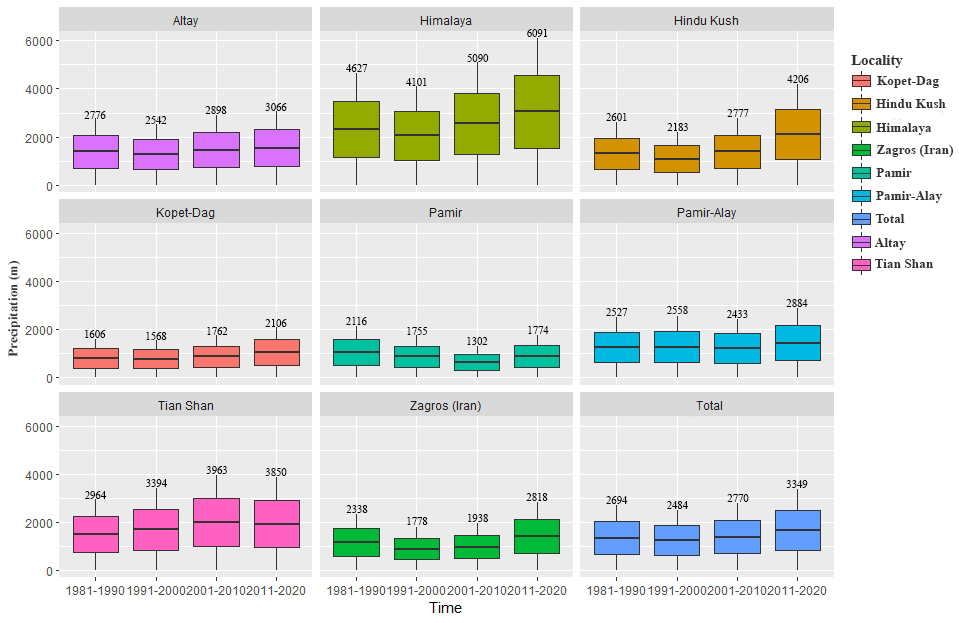 | Figure 8. Average annual precipitation change between 1980 and 2020 |
Currently, species distribution modeling (SDM) continues to be one of the most appropriate ecological methods for comprehending and forecasting the connections between environmental factors and the present as well as future range of species (He, Burgess et al., 2019). Applicability of this method helps to determine suitable habitats, important biovariables and topographic variables as well. Thus, to determine a current and future response of distribution of the genus Poa to climate change we selected a cosmopolitan representative, P. bactriana, of the genus. The genus has been described as cosmopolitan because of the diversity in growth habit and geographic distribution among species (Anton and Connor, 1995). One of the representatives of this genus, P. bactriana, is a cosmopolitan annual plant species growing in the northern hemisphere of the earth.The genus Poa is sensitive to precipitation and annual temperature as most of its representatives are annual plants. Some ecological studies conducted on this genus indicate that Bio7 (Temperature annual range (Bio5–Bio6)), Bio12 (Annual precipitation (mm)), Bio18 (Precipitation of warmest quarter (mm)) as main biovariables in the distribution of this genus (Scrivanti and Anton, 2020). In the same line, our study also indicated that these biovariables are important in the distribution of P. bactriana. In addition, our study found that altitude (or elevation) is one of the best factors giving chance to continue life cycle for this species.Mountains provide refuge for numerous annual plants (Perrigo, Hoorn et al., 2020). In our case, P. bactriana can grow in lower altitudes. However, results suggested that lower altitude will be unsuitable for growth season of P. bactriana. And, we predict that higher altitudes, especially, Tian Shan, Pamir, Pamir–Alay mountain ranges located in Turkey, Azerbaijan and Armenia will be most suitable for this species making important refugees.
5. Conclusions and Recommendations
The current research offers valuable insights that can help pinpoint the specific areas where the species is most vulnerable to various factors, such as climate change. In detail, altitude, aridity index and topographic variables were found to be the most important predictors for the distribution of the species. Currently the species is considered cosmopolitan and the future distribution of P. bactriana under two climate change scenarios (RCP2.6 and RCP8.5) for 2050 showed a sharp decrease in the suitable area and habitat quality. This data challenges development of effective conservation measures of economically significant species.
References
| [1] | Anton, A. and H. Connor (1995). “Floral biology and reproduction in Poa (Poeae: Gramineae)”. Australian Journal of Botany, 43(6): 577–599. |
| [2] | Asatulloev, T., Dekhkonov, D., Yusupov, Z., Tojiboeva, U., Cai, L., Tojibaev, K., & Sun, W. (2023). Ecoregional and Phytogeographical Insights into the Distribution of Tulipa in the ‘Nature Imperiled’ Area of Central Asia for Effective Conservation, Diversity, 15(12), 1195. |
| [3] | Asatulloyev, T., Dekhkonov, D., & Tojibaev, K.S. (2022). What determines the distribution of Tulipa species in Uzbekistan? Plant diversity of Central Asia, (1), 127–137. |
| [4] | Baldwin, R.A. (2009). “Use of maximum entropy modeling in wildlife research”, Entropy, 11(4): 854–866. |
| [5] | Dekhkonov D, et al. “Suitable habitat prediction with a huge set of variables on some Central Asian tulips”. J. of Asia–Pacific Biodiversity, 16 (2023a): 75–82. |
| [6] | Dekhkonov, D., Asatulloev, T., Akbarov, F., Tojiboeva, U., Lorenzo, P., & Tojibaev, K.S. (2023b). Conservation strategy and diversity of Tulipa (Liliaceae) in Uzbekistan. Plant Divers. Cent Asia, 4, 1–42. |
| [7] | Dekhkonov, D., Tojibaev, K. S., Makhmudjanov, D., Na, N. R., Baasanmunkh, S., Yusupov, Z., & Jang, C.G. (2021). Mapping and analyzing the distribution of the species in the genus Tulipa (Liliaceae) in the Ferghana Valley of Central Asia. Korean Journal of Plant Taxonomy, 51(3), 181–191. |
| [8] | Di Cola, V., O. Broennimann, B. Petitpierre, F. T. Breiner, M. d’Amen, C. Randin, R. Engler, J. Pottier, D. Pio and A. Dubuis (2017). “Ecospat: an R package to support spatial analyses and modeling of species niches and distributions”. Ecography, 40(6): 774–787. |
| [9] | Farashi, A. and M. Alizadeh–Noughani (2023). Basic Introduction to Species Distribution Modelling (SDM). Ecosystem and Species Habitat Modeling for Conservation and Restoration, Springer: 21–40. |
| [10] | Fick, S. E. and R.J. Hijmans (2017). “WorldClim 2: new 1–km spatial resolution climate surfaces for global land areas”. International Journal of Climatology, 37(12): 4302–4315. |
| [11] | Fitzpatrick, M.C., N.J. Gotelli and A.M. Ellison, (2013). “MaxEnt versus MaxLike: empirical comparisons with ant species distributions”. Ecosphere, 4(5): 1–15. |
| [12] | Gulomov, R., Rakhimova, K., Batoshov, A., Komilov, D. (2023). Bioclimatic modeling of the species Phlomoides canescens (Lamiaceae), The Scientifi Temper, 14(4): 1060–1065. |
| [13] | He, X., K. S. Burgess, L.–M. Gao and D.–Z. Li (2019). “Distributional responses to climate change for alpine species of Cyananthus and Primula endemic to the Himalaya–Hengduan Mountains”. Plant Diversity, 41(1): 26–32. |
| [14] | Hijmans, R.J., S. Phillips, J. Leathwick, J. Elith and M.R. J. Hijmans (2017). “Package ‘dismo’”. Circles, 9(1): 1–68. |
| [15] | Makhmudjanov D., Juramurodov, I., Kurbonalieva, M., Yusupov, Z., Dekhkonov, D., Deng, T., & Sun, H. (2022). Genus Eremurus (Asphodelaceae) in the flora of Uzbekistan. Plant Divers. Cen. As, 2, 82–127. |
| [16] | Perrigo, A., C. Hoorn and A. Antonelli, (2020). “Why mountains matter for biodiversity”. Journal of Biogeography 47(2): 315–325. |
| [17] | Phillips, S. J., R. P. Anderson and R.E. Schapire (2006). “Maximum entropy modeling of species geographic distributions”, Ecological modelling, 190(3–4): 231–259. |
| [18] | Phillips, S. J., M. Dudík and R.E. Schapire (2004). A maximum entropy approach to species distribution modeling. Proceedings of the twenty–first international conference on Machine learning. |
| [19] | R Core Team, R. (2013). “R: A language and environment for statistical computing”. |
| [20] | Scrivanti, L. R. and A. M. Anton (2020). “Spatial distribution of Poa scaberula (Poaceae) along the andes”, Heliyon, 6(10). |
| [21] | Tojibaev, K., Dekhkonov, D., Ergashov, I., Sun, H., Deng, T., & Yusupov, Z. (2022). The synopsis of the genus Tulipa (Liliaceae) in Uzbekistan. Phytotaxa, 573 (2), 163–214. |
| [22] | Vignali, S., A. G. Barras, R. Arlettaz and V. Braunisch (2020). “SDMtune: An R package to tune and evaluate species distribution models”. Ecology and Evolution, 10 (20): 11488–11506. |

 Abstract
 Reference
 Full-Text PDF
 Full-text HTML