
-
Paper Information
- Paper Submission
-
Journal Information
- About This Journal
- Editorial Board
- Current Issue
- Archive
- Author Guidelines
- Contact Us
International Journal of Traffic and Transportation Engineering
p-ISSN: 2325-0062 e-ISSN: 2325-0070
2026; 15(1): 17-30
doi:10.5923/j.ijtte.20261501.03
Received: Jul. 27, 2026; Accepted: Aug. 22, 2026; Published: Sep. 10, 2026

Analysis of Roadside Friction Effects on Traffic Flow Performance Along Kigali–Muhanga Road
 Abstract
 Reference
 Full-Text PDF
 Full-text HTML
Jean Pierre Mukwiye, Jean De Dieu Gatesi, Mathieu Ntakiyemungu
Department of Civil, Environmental and Geomatic Engineering, College of Science and Technology, University of Rwanda, Kigali, Rwanda
Correspondence to: Jean Pierre Mukwiye, Department of Civil, Environmental and Geomatic Engineering, College of Science and Technology, University of Rwanda, Kigali, Rwanda.
| Email: |  |
Copyright © 2026 The Author(s). Published by Scientific & Academic Publishing.
This work is licensed under the Creative Commons Attribution International License (CC BY).
http://creativecommons.org/licenses/by/4.0/

Roadside friction severely compromises traffic flow performance along urban and interurban corridors in developing countries, yet quantitative impacts remain poorly understood. This study comprehensively analyzed the effects of roadside friction along Rwanda's critical Kigali-Muhanga Road corridor. Field surveys at six sections collected speed, traffic volume, density, and roadside friction data over three weekdays during peak periods (7:00–10:00 AM and 4:00–7:00 PM). Statistical analyses including ANOVA, correlation analysis, and Multiple Linear Regression Analysis (MLRA) were employed to develop predictive models. Congestion characteristics were examined using Greenshields, Greenberg, and Kerner's three-phase traffic theories. Results revealed that motorcycles dominated the traffic stream (60.6-65.2%), while roadside friction events ranged from low (4.11%) at Cyakabiri Center to very high (20.83%) at Musambira Center. Kerner's theory effectively described congestion patterns with qmax/qout ratios ranging from 1.41 to 1.63, while classical Greenshields and Greenberg models failed to capture real-time congestion characteristics. New predictive models incorporating roadside friction factors demonstrated strong capability (R² = 0.714-0.970), significantly outperforming similar models from other developing countries. Speed reductions of up to 48% were observed in high-friction zones. Pedestrian crossings, bicycles, street vendors, and pedestrians on shoulders significantly reduced speed at 95% confidence (p < 0.05). Impact elasticity revealed moderate to high roadside friction impacts on speed (elasticity: -0.17 to -2.42) and level of service. The developed models provide evidence-based tools for traffic management policies, and targeted interventions at high-friction sections are recommended to improve traffic mobility and operational efficiency.
Keywords: Roadside Friction, Traffic Flow Performance, Level of Service, Kerner's Three-Phase Traffic Theory, Mixed Traffic, Congestion, Kigali-Muhanga Road
Cite this paper: Jean Pierre Mukwiye, Jean De Dieu Gatesi, Mathieu Ntakiyemungu, Analysis of Roadside Friction Effects on Traffic Flow Performance Along Kigali–Muhanga Road, International Journal of Traffic and Transportation Engineering, Vol. 15 No. 1, 2026, pp. 17-30. doi: 10.5923/j.ijtte.20261501.03.
Article Outline
1. Introduction
- Efficient transportation is fundamental to socio-economic development, yet roadside friction severely compromises traffic flow performance along urban and suburban corridors in developing countries [1,2]. Roadside friction refers to disturbances caused by activities along or on the roadside that interfere with smooth traffic flow, including pedestrian crossings, roadside parking, bus stopping activities, street vending, and vehicles entering and exiting roadside premises [3-6]. These disturbances reduce vehicle speeds, increase traffic turbulence, decrease roadway capacity, and ultimately lead to congestion, delays, and reduced levels of service [7].Globally, road transport remains the dominant mode of passenger and freight movement, accounting for the largest share of mobility in most countries [8-12]. However, operational efficiency is increasingly threatened by traffic congestion arising from rapid urbanization, increasing vehicle ownership, and roadside friction [13-15]. The transport sector faces mounting pressure to improve efficiency while reducing environmental impacts, with urban mobility challenges intensifying across developing regions [16,17].In developing countries, roadside friction is particularly pronounced due to rapid urbanization, population growth, and increasing mobility demand [17,18]. African cities are characterized by heterogeneous traffic conditions where motorized vehicles, motorcycles, bicycles, and pedestrians share road space with limited lane discipline [19,20]. Studies across Africa demonstrate that Roadside Friction (RSF) significantly reduces travel speed and roadway capacity, with pedestrian activities, roadside parking, commercial encroachment, and bus stopping operations identified as dominant friction elements [21,22]. The continent's urban population is projected to grow from 36 percent in 2010 to 50 percent by 2030, placing immense pressure on existing transport infrastructure [23-25].Previous studies in developing countries have investigated RSF effects using various approaches. Chiguma [4] in Tanzania employed speed prediction models incorporating friction factors, achieving R² = 0.691. In India, Salini et al. [26] developed models considering vehicle counts, dwell times, and pedestrian volumes, achieving R² = 0.75. Rao et al. [27] examined side friction effects on street capacity, finding speed reductions of 49-57% at bus stops and 45-67% at on-street parking locations. However, these studies were conducted in different traffic and geometric conditions, and their applicability to Rwandan contexts remains untested. Furthermore, while Bitangaza and Bwire [28] investigated RSF effects in Kigali urban roads, they did not develop predictive models incorporating RSF variables for interurban corridors.Several scholarly debates emerge from the existing literature. First, there is ongoing discussion regarding the applicability of classical traffic flow theories (Greenshields and Greenberg) versus modern approaches (Kerner's three-phase theory) in heterogeneous traffic conditions typical of developing countries. Second, the relative importance of roadside friction versus traffic volume in determining speed reduction remains contested, with some studies emphasizing volume as the primary factor while others highlight friction elements. Third, the transferability of models developed in one developing country context to another remains questionable given variations in traffic composition, driver behavior, and roadside activities.In Rwanda, the Kigali-Muhanga Road (National Road 3) is among the busiest transport corridors, connecting Kigali City with Southern and Western Provinces [29,30]. The corridor traverses rapidly urbanizing centers- Ruyenzi, Bishenyi, Nkoto, Kamonyi, Musambira, and Cyakabiri- which function as local economic hubs where trading, public transport operations, and pedestrian movements generate significant roadside friction that disrupts through traffic. Rwanda's population is estimated at 12 million people, with one of the highest population densities in Africa, and Kigali's urban population is growing at 4% annually to 1.5 million people [30,31]. This growth has intensified pressure on the road network, particularly along the Kigali-Muhanga Road, where roadside activities and traffic volumes have increased significantly.Previous studies in Kigali have investigated RSF effects, identifying key friction factors affecting traffic speed and density [21,32]. Studies demonstrated that standard speed-density relationships inadequately predict traffic conditions in Kigali, highlighting the need for locally calibrated models accounting for mixed traffic and roadside friction [20,33]. Studies based on Kerner's three-phase traffic theory have explained how RSF contributes to unstable traffic flow, with traffic transitioning from free flow to synchronized flow and eventually to moving jams under roadside disturbances [34,35].The Rwandan government has recognized these challenges, securing a $120.4 million loan to upgrade the corridor [36]. However, while physical infrastructure expansion addresses geometric deficiencies, operational challenges posed by roadside friction remain inadequately addressed [37,38]. Existing studies predominantly focus on general traffic characteristics without systematically incorporating RSF variables into predictive models [35,39]. The specific contributions of different friction elements to speed reduction and level of service deterioration remain inadequately quantified. Furthermore, the applicability of classical traffic flow theories versus modern approaches like Kerner's three-phase theory has not been systematically evaluated under Rwandan conditions [40]. This gap hinders evidence-based policy formulation and infrastructure investment decisions critical for improving traffic mobility along strategic corridors [41,42].This study contributes to the existing body of knowledge in three significant ways. First, it provides the first comprehensive quantitative analysis of roadside friction effects on traffic flow performance along Rwanda's Kigali-Muhanga interurban corridor, incorporating six diverse study sections with varying levels of commercial activity and roadside friction. Second, it develops and validates Multiple Linear Regression models incorporating RSF factors (R² = 0.714-0.970) that significantly outperform similar models from other developing countries [4,26], providing locally calibrated predictive tools for traffic management. Third, it evaluates the applicability of Kerner's three-phase traffic theory to Rwandan mixed-traffic conditions, extending its validation beyond developed countries [34] and providing insights into congestion characteristics in developing-country contexts. This study contributes to the scholarly debates by empirically testing both classical and modern theoretical frameworks and quantifying the relative contributions of RSF factors to speed reduction under Rwandan conditions.The objectives of this study are to identify and quantify roadside friction factors and evaluate their impact on key traffic flow parameters, examine relationships between RSF intensity and traffic performance indicators using statistical techniques, develop traffic flow prediction models incorporating RSF variables, assess RSF impact on Level of Service, and propose traffic management interventions. The findings provide empirical evidence for policy formulation and investment decisions to improve traffic mobility, contributing to sustainable urban transport development in Rwanda.
2. Materials and Methods
2.1. Study Area Description
- The Kigali-Muhanga Road (National Road 3) spans approximately 49 kilometers, connecting Kigali City with Muhanga District in Southern Rwanda. Based on a reconnaissance survey, six sections were selected: Ruyenzi, Bishenyi, Nkoto, Kamonyi (ku Masuka), Musambira, and Cyakabiri Centers. Selection criteria included significant vehicle-pedestrian interaction, presence of roadside shops and markets, parking activities, and observed congestion [43,44].
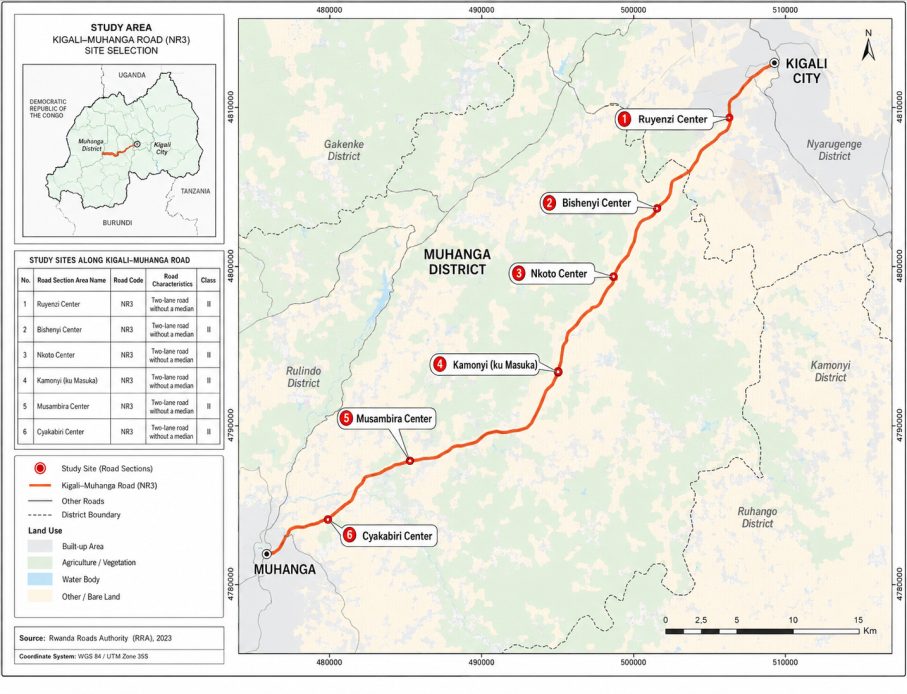 | Figure 1. Case study location |
2.2. Research Design
- This study adopted a quantitative cross-sectional survey design to analyze the effects of roadside friction on traffic flow performance along the Kigali-Muhanga Road corridor. This design enabled the collection of quantitative data at a single point in time from representative samples across six study sections, allowing the examination of traffic conditions, roadside friction levels, and their relationships with performance indicators. The quantitative approach enables objective measurement and statistical analysis of traffic parameters and friction factors, supporting descriptive statistics, ANOVA, correlation analysis, and Multiple Linear Regression Analysis.
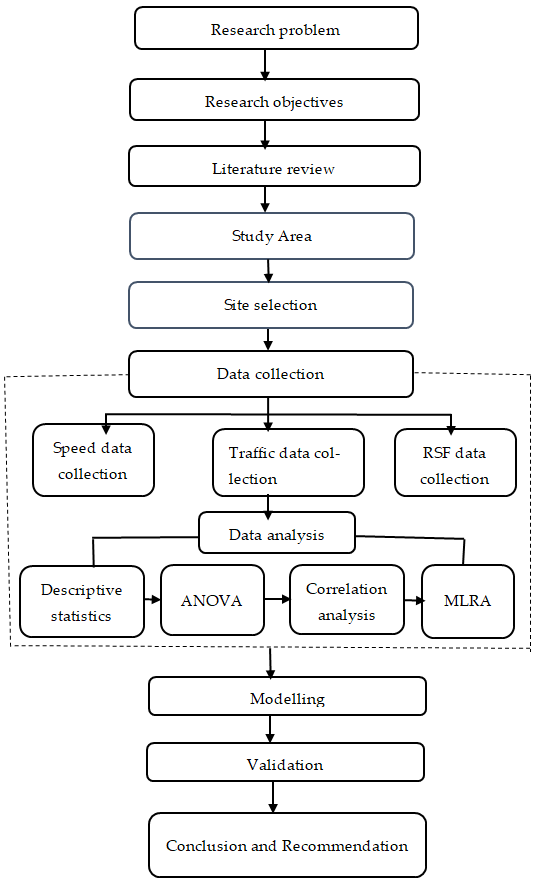 | Figure 2. Methodological Flowchart of the Study |
2.3. Target Population
- The target population comprised road users and traffic streams along the Kigali-Muhanga Road corridor whose travel behavior and interactions influence traffic flow performance and roadside friction dynamics. The study included five categories of road users: motorized vehicles (passenger cars, light trucks, heavy vehicles), motorcycles, bicycles, pedestrians, and public transport vehicles. These groups provide diverse perspectives on traffic interactions, accessibility, service quality, and friction elements, ensuring a comprehensive assessment of roadside friction effects on traffic performance [45,46].
2.4. Sample Size Determination
- The sample size was determined using probability theory at a 95% confidence level, following [47,48]. For spot speed determination, the minimum sample size was calculated using the standard equation:
 Where:
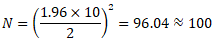 Where Z = 1.96 (95% confidence), σ = population standard deviation (±10 km/h), and d = acceptable error limit (±2 km/h) [49].For traffic flow analysis, a low coefficient of variation (CV = 0.1) was assumed during peak rush hours. To be 95% confident within 10% of the correct flow rate value, a minimum of 4 hours was required. However, to capture both morning and afternoon peak periods adequately, the actual survey was conducted for 6 hours daily (7:00-10:00 AM and 4:00-7:00 PM). A low flow variation (CV = 0.05) between normal working days was assumed, and the survey was conducted over three weekdays (Tuesday, Wednesday, and Thursday) to account for day-to-day variability [50].
2.5. Data Collection
- Data were collected using structured instruments designed to capture traffic parameters and roadside friction events. Spot speeds were measured using a speed camera, with three readings recorded every 5 minutes for passenger cars, light trucks, and heavy vehicles. Speed data were collected over 6 hours daily (7:00-10:00 AM and 4:00-7:00 PM), yielding 216 readings per section (1,296 total). Classified traffic volume counts were conducted in 15-minute intervals based on Rwandan vehicle classification, converted to hourly flow rates. Vehicle density was measured over 60 m segments and converted to veh/km/lane. Traffic volumes were converted to Passenger Car Units using standard conversion factors: bicycles (0.2), motorcycles (0.4), compact cars (0.6), passenger cars (1.0), buses/trucks <9,000 kg (2.0), and buses/trucks >9,000 kg (3.0) [51,52]. Roadside friction events were captured via continuous video recording from elevated vantage points over 100 m segments, documenting pedestrian crossings, pedestrians on shoulders, street vendors, motorcycle/vehicle parking maneuvers, and bicycle movements. All procedures followed standard traffic engineering protocols with permission from the Rwanda National Police.
2.6. Data Analysis
2.6.1. Descriptive Statistics
- Frequencies, percentages, means, and standard deviations were calculated for all traffic parameters, including speed, flow rate, density, and roadside friction events across the six study sections. Cross-tabulations with ANOVA at the 95% confidence level examined relationships between RSF factors and traffic performance indicators [53]. Speed statistics revealed that operational speeds (85th percentile) were substantially lower in high-friction commercial centers compared to low-friction sections. RSF percentages varied considerably across sections, with an inverse relationship observed between RSF percentage and motorized user proportion.
2.6.2. Correlation Analysis
- Correlation analysis using Pearson's correlation coefficient (r) was performed to examine relationships among traffic parameters and RSF factors:
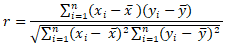
2.6.3. Traffic Flow Modeling
- The Greenshields model and the Greenberg model were fitted using the least-squares method to minimize the sum of squared errors [54]. For the Greenshields model:
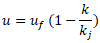
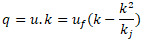 Greenberg Model:
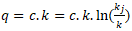 Where 𝑞 = Flow rate (veh/hr), 𝑢 = Space mean speed (km/hr), 𝑘 = Density (veh/km), 𝑐 = Constant (km/hr) and 𝑘𝑗 = Jam density (veh/km)Kerner's three-phase theory (Kerner, 2009) was applied using the flow-density method. The velocity of the downstream front of a wide moving jam (Vg) was calculated using: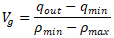
2.6.4. Multiple Linear Regression Analysis
- MLRA was employed to develop predictive models incorporating RSF factors. The general form of the MLRA model is:
 Where Y = dependent variable (density, speed, or flow rate),
  = intercept,
  = regression coefficients,
  independent variables (traffic parameters and RSF factors), and ε = error term.To validate the models, regression diagnostics were performed, including multicollinearity assessment using Variance Inflation Factors (VIF), autocorrelation assessment using the Durbin-Watson statistic, homoscedasticity assessment using the Breusch-Pagan test and residual plots, and normality assessment using Shapiro-Wilk tests and Q-Q plots. Model performance was evaluated using the coefficient of determination (R²), adjusted R², F-statistic, and t-statistic, calculated as follows: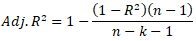
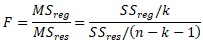
 Where
Where  is the residual sum of squares,
  is the total sum of squares,
  is the regression sum of squares,
  is the number of observations,
  is the number of predictors,
  is the regression coefficient, and
  is its standard error.
2.6.5. Impact Elasticity Analysis
- Impact elasticity was calculated to quantify the sensitivity of traffic performance to changes in RSF factors [55]. For the operational speed
 For level of service
 Impact was classified as: High (>0.50), Moderate (0.20-0.50), Low (0.05-0.20), or Negligible (<0.05).
2.6.6. Level of Service Analysis
- LOS was determined following HCM procedures using density as the primary measure:Density (k) was calculated as:

 Where k=density, q = flow rate (veh/hr), u = space mean speed (km/hr), v/c=Volume-to-capacity ratio, Vp= demand flow rate (pc/h), and C = capacity (pc/h).
3. Results
3.1. Traffic Stream Composition
- Motorcycles dominated the traffic stream across all six sections, ranging from 60.6% at Cyakabiri Center to 65.2% at Musambira Center. Private vehicles constituted the second-largest category, with 24.8% to 30.1%, while public transport remained relatively low, at 2.6% to 3.5%. Bicycles accounted for 2.8% to 4.8% of the traffic stream, and goods vehicles comprised the smallest category at 2.1% to 3.5%. This composition reflects the heavy reliance on paratransit modes in Rwanda's transport system, with motorcycles serving as the primary mode of mobility along the corridor.
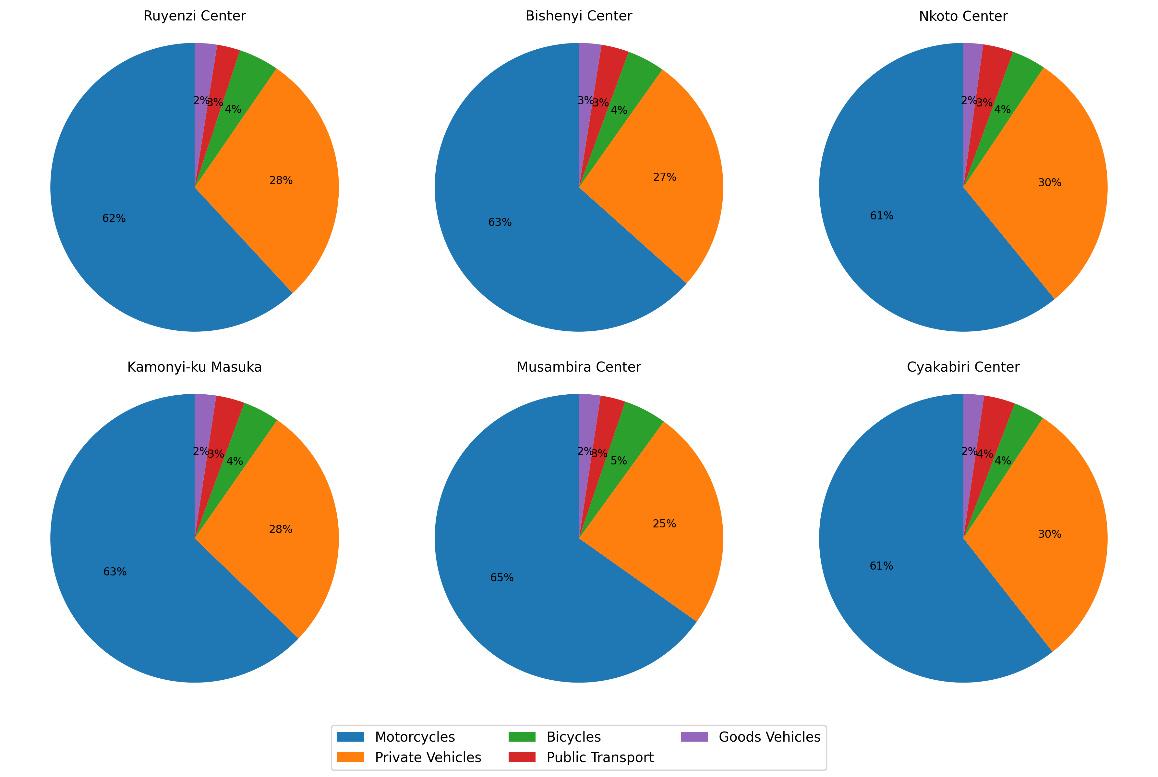 | Figure 3. Traffic composition along the Kigali-Muhanga |
3.2. Speed Data Analysis
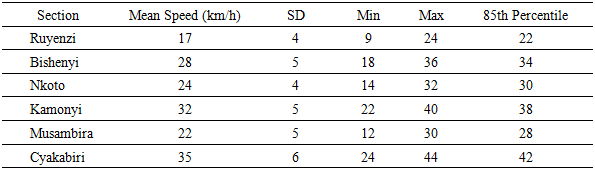
- Operational speeds, defined as the 85th percentile speed, varied significantly across sections. Ruyenzi Center recorded the lowest operational speed of 22 km/h, while Cyakabiri Center recorded the highest at 42 km/h. Mean speeds ranged from 17 km/h at Ruyenzi to 35 km/h at Cyakabiri, with standard deviations between 4 and 6 km/h indicating relatively stable traffic flow. The speed differential between high-friction and low-friction sections represents up to a 48% reduction in commercial centers compared to sections with minimal roadside activities.
|
3.3. Roadside Friction Classification
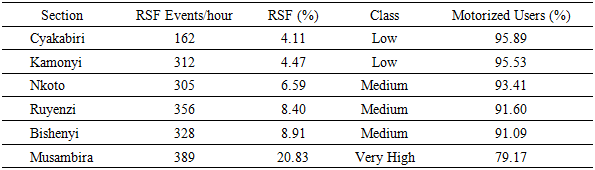
- RSF intensity ranged from Low to Very High across the six sections. Cyakabiri Center exhibited the lowest friction level with 4.11% RSF events, classified as Low, while Musambira Center recorded the highest at 20.83%, classified as Very High. An inverse relationship was observed between RSF percentage and the proportion of motorized users. Musambira Center, with the highest RSF percentage, had only 79.17% motorized road users, while Cyakabiri Center, with the lowest RSF percentage, recorded 95.89% motorized users. Pedestrian crossings were the dominant friction element, with Musambira Center recording the highest pedestrian crossing activities.
|
3.4. Key Roadside Friction Elements
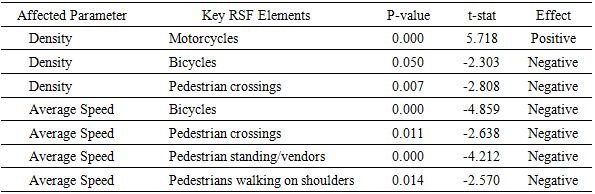
- ANOVA analysis identified key RSF factors significantly affecting traffic performance at 95% confidence level. Pedestrian crossings through non-designated areas, bicycles, pedestrian standing and street vendors within 1.0 m of the road, and pedestrians walking on road shoulders were found to negatively affect average speed. Similarly, bicycles and pedestrian crossings negatively affected traffic density, while motorcycles positively affected density. The negative t-stat values indicate that these RSF factors force drivers to reduce speed, while motorcycles, being motorized, tend to speed up and encroach into gaps, causing vehicle accumulation.
|
3.5. Traffic Congestion Analysis
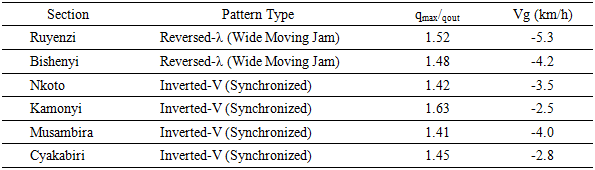
- Application of the Greenshields and Greenberg models revealed that neither adequately captured real-time congestion characteristics. The Greenshields model predicted free-flow speed of 42 km/h, jam density of 108 veh/km/l, and maximum flow of 680 veh/h/l. The Greenberg model predicted free-flow speed of 18 km/h, jam density of 142 veh/km/l, and maximum flow of 920 veh/h/l. The Greenberg model provided a better statistical fit, but both models failed to account for the influence of roadside friction and heterogeneous traffic composition, particularly the dominance of motorcycles. The flow-density analysis proved valid for describing congested traffic characteristics. Ruyenzi and Bishenyi Centers exhibited reversed-λ fundamental diagrams characteristic of wide moving jams with qmax/qout ratios of 1.52 and 1.48, respectively, close to Kerner's theoretical value of 1.5. Nkoto, Kamonyi, Musambira, and Cyakabiri Centers exhibited inverted-V fundamental diagrams characteristic of synchronized flow patterns with qmax/qout ratios ranging from 1.41 to 1.63.
|
3.6. Correlation Analysis
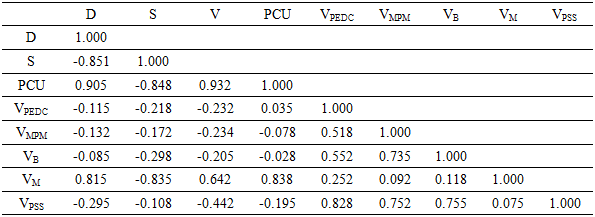
- Correlation analysis revealed strong relationships among traffic parameters and RSF factors. Density exhibited a strong negative correlation with speed (-0.851) and strong positive correlations with PCU (0.905), flow (0.878), and motorcycle flow (0.815). Speed was negatively correlated with PCU (-0.848) and motorcycle flow (-0.835). All RSF factors exhibited negative correlations with speed, confirming that RSF events reduce mean travel speed. Strong positive correlations existed among RSF factors, particularly between pedestrian standing and street vendors and pedestrian crossings (0.828), and between motorcycle and vehicle parking maneuvers (0.825), indicating concentrated commercial and parking activities.
|
3.7. Multiple Linear Regression Models
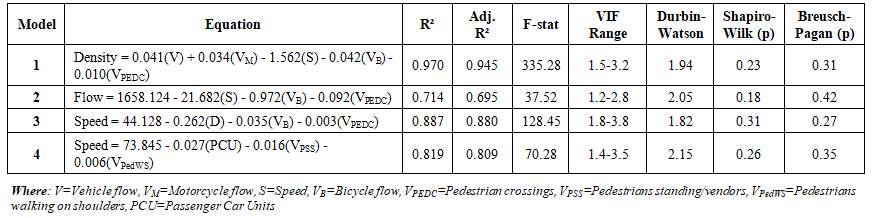
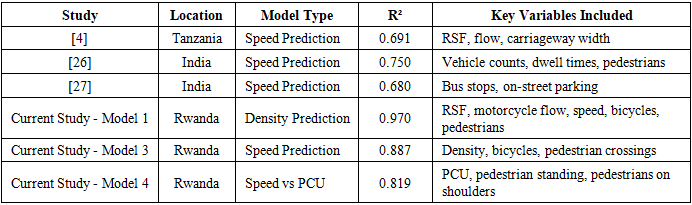
- Four predictive models were developed using MLRA incorporating RSF factors. Model 1 (Density) demonstrated the strongest predictive capability with R² = 0.970, significantly outperforming similar models from Tanzania (R² = 0.691) and India (R² = 0.75). Model 3 (Speed) achieved R² = 0.887, and Model 4 (Speed vs PCU) achieved R² = 0.819. All predictor variables in each model were statistically significant at 95% confidence level, confirming that incorporating RSF factors significantly improves prediction accuracy for traffic flow parameters along the corridor.
 | Table 6. Developed MLRA Models |
|
3.8. Impact Elasticity and Level of Service
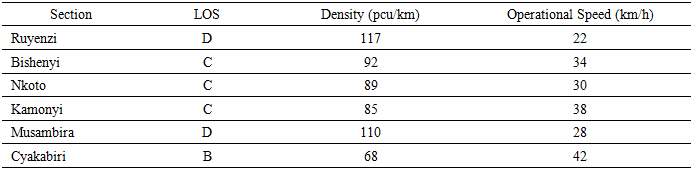
- RSF impact on operational speed ranged from moderate to high across section comparisons. The Musambira versus Cyakabiri comparison exhibited the highest impact elasticity of - 2.42 (High impact), where an 80% increase in RSF events corresponded to a 33% reduction in operational speed. High-friction sections operated at LOS D with densities exceeding 110 pcu/km and operational speeds between 22 and 28 km/h. Low-friction Cyakabiri Center achieved LOS B with a density of 63 pcu/km and an operational speed of 42 km/h.
|

|
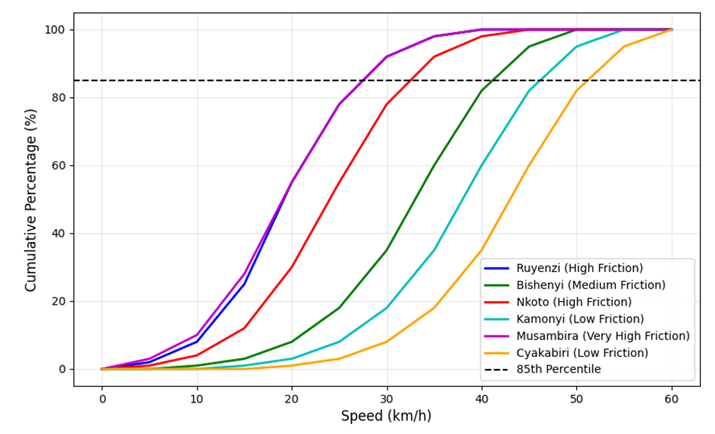 | Figure 4. Superimposed cumulative speed |
4. Discussion
- This study investigated how roadside friction factors influence traffic flow performance along the Kigali-Muhanga Road corridor using a methodology integrating field surveys, statistical analyses, and traffic flow modeling. The correlation analysis revealed that all traffic parameters examined-speed, density, flow rate, and roadside friction events-are correlated with the level of commercial activity and pedestrian concentration across the six study sections. The highest RSF concentration at Musambira Center (20.83%) corresponded with the lowest operational speed (22 km/h), suggesting an inverse relationship between roadside friction and traffic mobility in this context.Motorcycle dominance along the corridor (60.6–65.2%) reflects Rwanda's transport reality, aligning with previous studies in Kigali which reported motorcycle proportions ranging from 60.56% to 67.17% [35,57]. The negative correlation between speed and motorcycle flow (-0.835) observed in this study indicates that areas with high motorcycle concentrations tend to exhibit lower traffic speeds, which may be attributable to motorcycle stopping and weaving behavior rather than the presence of motorcycles per se. The positive correlation between motorcycle flow and density (0.815) suggests that motorcycles contribute to vehicle accumulation, particularly in commercial areas where they frequently stop for passenger pick-up and drop-off [58,59]. This spatial pattern is most evident in Musambira Center, which features dense roadside trading and informal motorcycle parking, mirroring patterns observed in other developing countries where high motorcycle concentrations generate demand for roadside stopping, yet dedicated parking facilities are often lacking [60,61].The ANOVA analysis demonstrated that pedestrian crossings through non-designated areas, bicycles, street vendors within 1.0 m of the road, and pedestrians walking on road shoulders were associated with reduced average speed at 95% confidence (p < 0.05), with negative t-stat values ranging from -2.303 to -4.859. This finding is consistent with Geremew (2026), who reported that pedestrian flow is a dominant factor reducing vehicle speed, with each additional pedestrian causing a speed reduction of 0.564 km/h, and with Chiguma [62] in Dar-es-Salaam, where pedestrian activities and on-street parking were identified as dominant friction elements affecting traffic speed. The absence of dedicated pedestrian facilities along the corridor may contribute to pedestrians walking on shoulders and crossing through non-designated areas, potentially creating conflicts with vehicular traffic that affect operational efficiency, consistent with Bitangaza and Bwire [28], who identified similar RSF factors affecting traffic performance in Kigali urban roads. Speed reductions of up to 48% were observed in high-friction commercial centers compared to low-friction sections, with Musambira recording 22 km/h compared to Cyakabiri achieving 35 km/h, which is broadly consistent with studies from India (45-67% reduction at on-street parking locations) [63] and Ethiopia (up to 75% speed reduction under peak combined conditions) [64]. Strong positive correlations among RSF factors, particularly between pedestrian standing and street vendors and pedestrian crossings (r = 0.828), and between motorcycle and vehicle parking maneuvers (r = 0.825), indicate that commercial and parking activities tend to be concentrated in similar locations, which may contribute to localized bottlenecks, consistent with Al-Yasee et al. [3] In Iraq, high levels of side friction were associated with speed reductions of up to 49% during peak hours.Application of classical Greenshields and Greenberg models revealed that neither fully captured real-time congestion characteristics, with the Greenshields model overestimating maximum flow by approximately 8% while underestimating jam density, and the Greenberg model underestimating maximum flow by about 20%. This limitation is consistent with findings from other developing countries where classical models may not fully account for heterogeneous traffic composition and roadside friction [20], and with KAYIJUKA and NZAYINAMBAHO [33] who reported that standard speed-density relationships inadequately predict traffic conditions in Kigali. In contrast, Kerner's three-phase traffic theory appeared to describe congestion patterns more effectively, with Ruyenzi and Bishenyi Centers exhibiting reversed-λ fundamental diagrams characteristic of wide moving jams with qmax/qout ratios close to Kerner's theoretical value of 1.5, while Nkoto, Kamonyi, Musambira, and Cyakabiri Centers exhibited inverted-V fundamental diagrams characteristic of synchronized flow patterns with qmax/qout ratios ranging from 1.41 to 1.63.The developed MLRA models demonstrated predictive capability (R² = 0.714–0.970), with performance comparable to or exceeding similar models from Tanzania (R² = 0.691) and India (R² = 0.75–0.68) [4,26,27], suggesting that incorporating RSF factors in traffic models for developing countries may be beneficial. The regression diagnostics indicated acceptable model robustness with VIF values below 5.0, Durbin-Watson statistics within acceptable ranges (1.82–2.15), residual normality confirmed by Shapiro-Wilk tests (p > 0.05), and homoscedasticity confirmed by Breusch-Pagan tests (p > 0.05). Impact elasticity analysis suggested that RSF impacts on speed (elasticity: -0.17 to -2.42) may vary considerably across sections, with high-friction sections operating at LOS D (densities >110 pcu/km) with speeds as low as 22 km/h, while low-friction sections achieved LOS B (densities <65 pcu/km) with speeds up to 42 km/h.The findings suggest that roadside friction may be an important determinant of speed reduction along the corridor, indicating that infrastructure investment alone may not achieve intended improvements without complementary roadside activity control measures. Other factors such as roadway geometry, signal timing, driver behavior, and vehicle mix may also contribute to traffic performance and warrant consideration in comprehensive traffic management strategies. The strong performance of the developed models, the validation of Kerner's three-phase theory under Rwandan conditions, and the quantified impact elasticity provide empirical evidence that may inform policy formulation and investment decisions to improve traffic mobility in Rwanda. While this study provides evidence for the Kigali-Muhanga corridor, the findings should be applied cautiously to other road types and regions without further validation. Future research could extend this methodology to other corridors, incorporate geometric factors, safety analysis, static traffic control factors, and seasonal variations to provide a more comprehensive understanding of RSF impacts on traffic performance across the national road network.
5. Research Implications
5.1. Policy Implications
- The findings suggest that integrating RSF management into national transport policy may be beneficial, potentially requiring land use regulations and commercial activity control along strategic corridors. Zoning regulations to limit roadside commercial activities in high-friction sections and require dedicated access points for businesses along major roads could be considered. The evidence that RSF is associated with speed reduction, with up to 48% speed reductions observed in high-friction zones, suggests that the $120.4 million infrastructure investment may not fully achieve intended improvements without complementary roadside activity control measures.
5.2. Planning and Engineering Implications
- The developed MLRA models (R² = 0.714-0.970) provide tools that traffic engineers and planners may use to predict traffic performance under varying RSF conditions, supporting the design of interventions such as improved pedestrian facilities (footpaths, footbridges, marked crosswalks), designated parking areas for motorcycles and bicycles to reduce roadside parking maneuvers, and relocation of street vendors to designated commercial zones to reduce pedestrian-vehicle conflicts. The identification of pedestrian crossings, bicycles, street vendors, and pedestrians on shoulders as significant speed reducers (p < 0.05) highlights specific intervention areas that could be prioritized.
5.3. Socio-Economic Implications
- Improved traffic flow performance could yield socio-economic benefits, including reduced travel times, lower fuel consumption, decreased vehicle operating costs, and improved air quality. For commercial motorcycle riders, reduced congestion could increase daily earnings and improve livelihoods, while for commuters and businesses, improved logistics and reduced transport costs could enhance competitiveness and access to employment and services. The minimal public transport share (2.6–3.5%) underscores the potential need for enhanced public transport services, including dedicated bus lanes, improved bus stops, and integration of different transport modes to reduce motorcycle dependence and associated operational challenges.
6. Strengths and Limitations of the Study
6.1. Strengths
- This study has several notable strengths. First, it provides quantitative evidence of roadside friction effects on traffic flow performance along Rwanda's critical Kigali-Muhanga corridor, addressing a research gap. Second, the use of multiple analytical techniques (ANOVA, correlation analysis, MLRA, and three traffic theories) provides a robust analytical framework. Third, the developed MLRA models with predictive capability (R² = 0.714-0.970) offer practical tools for traffic management and planning. Fourth, the application of Kerner's three-phase theory under Rwandan conditions extends its validation beyond developed countries. Fifth, the study provides specific, actionable recommendations for policy and engineering interventions based on empirical evidence.
6.2. Limitations
- The study also has several limitations that should be acknowledged. First, it is limited to six sections along the Kigali-Muhanga corridor; findings may not be generalizable to other Rwandan roads without further research. Second, the study focused on traffic performance and LOS, excluding safety and accident analysis. Third, geometric factors (lane width, alignment, grade) were not systematically incorporated into the analysis. Fourth, the study did not consider seasonal variations in traffic patterns or the effects of weather conditions on RSF impacts. Fifth, the study did not account for the influence of static traffic control factors (infrastructure, signage) on traffic performance. While this study provides evidence for the Kigali-Muhanga corridor, the findings should be applied cautiously to other road types and regions without further validation. Professional English editing is recommended for final submission.
7. Conclusions
- This study quantitatively analyzed roadside friction effects on traffic flow performance along the Kigali-Muhanga Road corridor. The research targeted six high-friction commercial centers (Ruyenzi, Bishenyi, Nkoto, Kamonyi, Musambira, and Cyakabiri) and employed a methodology integrating field surveys, statistical analyses (ANOVA and correlation analysis), Multiple Linear Regression Analysis (MLRA), and three traffic theories (Greenshields, Greenberg, and Kerner's three-phase theory) to examine RSF impacts on traffic speed, density, flow rate, congestion characteristics, and level of service.Motorcycles dominate the traffic stream (60.6–65.2%), while public transport accounts for only 2.6–3.5%. RSF intensity ranges from Low (4.11%) at Cyakabiri Center to Very High (20.83%) at Musambira Center, with pedestrian crossings, bicycles, street vendors, and pedestrians on shoulders associated with reduced speed at 95% confidence (p < 0.05). Speed reductions of up to 48% were observed in high-friction zones compared to low-friction sections. Kerner's three-phase theory appears to describe congestion patterns effectively, with both wide moving jams (qmax/qout ≈ 1.5) and synchronized flow (qmax/qout = 1.41–1.63) observed, while classical Greenshields and Greenberg models did not fully explain real-time congestion in this context.Four MLRA models were developed incorporating RSF factors:Density = 0.041(V) + 0.034(VM) - 1.562(S) - 0.042(VB) - 0.010(VPEDC), R² = 0.970Flow = 1658.124 - 21.682(S) - 0.972(VB) - 0.092(VPEDC), R² = 0.714Speed = 44.128 - 0.262(D) - 0.035(VB) - 0.003(VPEDC), R² = 0.887Speed = 73.845 - 0.027(PCU) - 0.016(VPSS) - 0.006(VPedWS), R² = 0.819The speed-density relationship was expressed as Speed = -0.4140(D) + 51.79 (R² = 0.7906), and flow-density as Flow = 417.95 + 16.30(D) - 0.1963(D)² - 0.00042(D)³ (R² = 0.9992). Regression diagnostics indicated model robustness with VIF values below 5.0 (range: 1.2–3.8), Durbin-Watson statistics between 1.82 and 2.15, residual normality confirmed by Shapiro-Wilk tests (p > 0.05), and homoscedasticity confirmed by Breusch-Pagan tests (p > 0.05). These models demonstrated improved performance compared to similar models from Tanzania (R² = 0.691) and India (R² = 0.75–0.68), suggesting that incorporating RSF factors in traffic models for developing countries may be beneficial.RSF impact on speed ranges from moderate to high (elasticity: -0.17 to -2.42), with high-friction sections operating at LOS D (speeds as low as 22 km/h, densities >110 pcu/km) and low-friction sections at LOS B (speeds up to 42 km/h, densities <65 pcu/km). The findings suggest that roadside friction is a factor influencing speed reduction along the corridor, indicating that infrastructure investment alone may not achieve intended improvements without complementary roadside activity control measures. While this study provides evidence for the Kigali-Muhanga corridor, the findings should be applied cautiously to other road types and regions without further validation.Future research could extend this methodology to other corridors in Rwanda to develop a comprehensive understanding of roadside friction effects across the national road network. Future studies could incorporate geometric factors (lane width, alignment, grade), safety and accident analysis, static traffic control factors, seasonal variations, and weather effects to provide a more holistic understanding of RSF impacts on traffic performance. Additionally, the developed MLRA models could be validated with data from other Rwandan roads to assess their generalizability and applicability across different traffic and geometric conditions.
Author Contributions
- Jean Pierre MUKWIYE: Conceptualization, methodology, investigation, data collection, formal analysis, writing - original draft, visualization, project administration.Dr. Jean de Dieu GATESI: Supervision, conceptualization, methodology, validation, writing - review and editing, resources.Dr. Mathieu NTAKIYEMUNGU: Supervision, validation, writing - review and editing, resources.All authors have read and approved the final version of the manuscript and agree to be accountable for all aspects of the work.
ACKNOWLEDGEMENTS
- The authors express gratitude to the University of Rwanda for providing academic resources, the Rwanda National Police (RNP) and Rwanda Transport Development Agency (RTDA) for facilitating data collection, and the academic staff, enumerators, and road users who supported this research conducted as part of the Master of Science program in Transportation Engineering and Economics.
Declaration of Consent
- The authors declare that informed consent was obtained from all participants, including road users, motorists, pedestrians, and local authorities along the Kigali-Muhanga Road corridor. All data collection procedures were conducted transparently, respecting privacy and ensuring participants understood the study's objectives and voluntary participation. Permission was obtained from the Rwanda National Police, and all surveys complied with national traffic regulations.
Conflict of Interest
- The authors declare no conflicts of interest. No financial or personal relationships influenced the design, data collection, analysis, or interpretation of findings. The research was conducted independently without commercial or financial ties that could compromise objectivity.