-
Paper Information
- Paper Submission
-
Journal Information
- About This Journal
- Editorial Board
- Current Issue
- Archive
- Author Guidelines
- Contact Us
International Journal of Traffic and Transportation Engineering
p-ISSN: 2325-0062 e-ISSN: 2325-0070
2026; 15(1): 8-16
doi:10.5923/j.ijtte.20261501.02
Received: Jan. 21, 2026; Accepted: Feb. 10, 2026; Published: Feb. 12, 2026

Evaluating Transit Demand for Disadvantaged Riders and a New Performance Measure to Incorporate Disadvantaged Riders
 Abstract
 Reference
 Full-Text PDF
 Full-text HTML
Sahana Shankar, Michael Anderson
University of Alabama in Huntsville, Huntsville, AL, 35899, USA
Correspondence to: Michael Anderson, University of Alabama in Huntsville, Huntsville, AL, 35899, USA.
| Email: |  |
Copyright © 2026 The Author(s). Published by Scientific & Academic Publishing.
This work is licensed under the Creative Commons Attribution International License (CC BY).
http://creativecommons.org/licenses/by/4.0/

This paper focuses on social vulnerability and performance measures for evaluating rural public transit agencies. The presented methodologies incorporate population, study area, and economic considerations. The methodologies developed in this paper are designed to level the evaluation based on geographic, population and economic factors. The performance measure developed is modeled after the volume/capacity typically seen in transportation analysis. The application of the performance measure and how the ranking adjust when looking at the new proposed measure are demonstrated through an evaluation of rural public transit agencies in Alabama. The paper concludes that the presented information can be applied to any collection of rural transit agencies to evaluate across multiple agencies or to evaluate performance improvements longitudinally.
Keywords: Performance Measures, Rural Transit
Cite this paper: Sahana Shankar, Michael Anderson, Evaluating Transit Demand for Disadvantaged Riders and a New Performance Measure to Incorporate Disadvantaged Riders, International Journal of Traffic and Transportation Engineering, Vol. 15 No. 1, 2026, pp. 8-16. doi: 10.5923/j.ijtte.20261501.02.
Article Outline
1. Introduction
- Access to transportation is essential in our modern world. It allows people to reach their jobs, get to healthcare facilities, attend schools, and participate in social activities. Unfortunately, some groups, like the elderly, individuals with disabilities, and those with limited incomes, often face difficulties accessing transportation. This inequality in access leads to social and economic disparities. To address these disparities and ensure that everyone has fair access to essential resources and opportunities, we need to understand the transportation needs of these disadvantaged groups.To tackle these transportation challenges, this study focuses on expanding the ability to determine where transit resources are lacking as well as presents a performance measure for transit agencies that factors demographic characteristics into the analysis. The study relies on data from the United States Census, which provides detailed demographic information for the country at various aggregation levels, and data from the actual transit providers’ operating systems within Alabama. To capture the disadvantaged population, this study employs a value known as the Social Vulnerability Index (SVI), which considers a wide range of aspects affecting people's social and economic well-being. The SVI enables us to pinpoint areas and neighborhoods where vulnerable populations are concentrated.The goal of this study is twofold. The first focus is to expand on the SVI work that has been performed in Alabama to truly get an understanding of the disadvantaged rider population throughout the state. The second focus is to develop a performance metric that incorporates the number of disadvantaged riders in a study area to better reflect the needs of the citizens and the transit agency’s response to the needs.
1.1. Focus on SVI Population
- The identification of disadvantaged people is a continuation of the work done to identify locations with vulnerable groups. Previous work performed by Merschman et al. [1] developed a SVI at the census tract level consisting of numerous variables. However, the limitation of the research work performed was that the identification of the higher SVI did not directly correspond to the number of potential transit riders in the census tracts. It was an indication of the areas that potentially had the highest transit riders as a percentage of the population. Therefore, this study looks to expand on the work to determine the ridership potentials using the SVI that were previously developed. This will prioritize places SVI population scores to precisely predict transportation need. By doing this, we can concentrate our efforts on offering transportation services in the areas where they are most desperately required.
1.2. Focus on New Performance Measure
- In counties where a transit-providers exists, understanding the quality of service offered is important. The most common method for determine service quality is through a performance measure. Performance measures such as trips/day and trips/vehicles are commonly collected reviewed and reported to evaluate service and compare agencies. However, these performance measures are limited as they do not consider demographic characteristics, especially with respect to vulnerable populations, and do not incorporate differences in study area size and number of vehicles available. Therefore, these simple performance measures have limitations in the ability to compare different agencies' efficiencies.This work examines the development of a new performance measure that includes both vulnerable population characteristics and study area size to evaluate transit agency operations. The new performance measure can be used to compare performance across transit providers or as a longitudinal measure for the same agency to determine improvements.
1.3. Organization of the Paper
- This paper is divided into five sections. The first provides and introduction and identified the goals of the work. The second section contains a literature review of relevant work to support the themes of this work. The third section presents the methodology associated with the two main focuses on this study. Each focus is given a unique methodology. The fourth section presents a case study of the methodologies as applied to a case study in Alabama, United States. Using actual census and operational data from the existing providers to demonstrate the key areas of this work. The final section presents the conclusions of the work.
2. Literature Review
- A review of literature was undertaken to assess previous work and provide direction to this study. The literature review chapter focuses on two key areas associated with this paper. The first area of interest is social vulnerability and the concept of transit deserts. The second area of focus is on transit performance measures. The conclusion of the literature review is that what is proposed in this has not been completely addressed by the state of the art or state of the practice.
2.1. Social Vulnerability and Transit Deserts
- Social vulnerability is a view to examine the demand side of public transit and identify those most in need of the services provided. The concept of utilizing social vulnerability in decision-making has been explored in the past, the application to transit demand has seen limited attempts. Social vulnerability, according to Blaikie et al. [2] is "the characteristics of a person or group and their situation that influence their capacity to anticipate, cope with, resist, and recover from the impact of a natural hazard." The qualities that make it difficult to use the existing transportation supply, transit vehicles, to efficiently get from one point to another are what would be referred to as vulnerable in the context of transportation. Social Vulnerability Index (SVI) is a technique that helps us determine whether a certain area has vulnerable residents. Cutter et al. [3] provided an explanation of working on the SVI technique using sociological factors and demographic information about people are used to get a score that a show quantifies the vulnerability of a place. An SVI metric allows making a comparative analysis of vulnerability amongst various places. In the past, several social vulnerability indices have been created to quantify vulnerability using population demographics. Similarly, Novak et al. [4] evaluated 15 variables to determine whether or not to economically devalue transportation assets. Sanchez et al. [5] identified that those who use public transportation are often members of marginalized populations would face more difficulties during an emergency. Wolch et al. [6] studied crowded urban area public transit systems to determine vulnerability. Urban mobility has been studied in relation to service quality [7-9], equitable asset allocation [10-13], and sustainability [14,15] within the context of transportation and transit demands. When evaluating the supply limitations of public transit, the previous research often examines the where service is lacking, using the term, transit deserts [16]. The combined impact of high vulnerability and lack of service presents a situation where individuals in need of services are lacking critical, potential life supporting, transportation. This impact has been examined for those experience financial difficulties [17], fairness of service [18] and those without personal vehicles [19]. Additional research focused on the financial effects of transit deserts and how it may be problematic if jobs are located distant from areas where people can afford to reside [3,20]. Locating transit deserts often focuses on data collection efforts and specific demographic variables [21-25].
2.2. Performance Measures
- To measure system effectiveness, the most common methodology to incorporate a specific performance metric. Having accurate and practical indicators that we can rely on is essential for transportation service evaluation [26]. These indicators should signal that the public transit service is running effectively, equitably, and efficiently [27]. Performance measures are measuring how efficiently an agency utilizes its resources to accomplish its goals and carry out its operations [10]. However, research has cautioned against relying exclusively on limited indicators like a transit system's average speed or capacity to carry, and instead focuses on comprehensive metrics [28].Different options have been developed that expand on the simple performance metrics typically collected. One study focused on rural transit systems that included terrain and unpaved roads as a measure to evaluate service [29]. Another study examined the impact of senior citizens specifically [30] while others have tried to incorporate passenger feedback in the recommended performance metrics [31-33].A study by Paulley et al. [34] presented a concept that each city has differences in area as well as demographics. The notion that each agency has difference operating parameters with respect to area and demographics has been echoed in other studies [35,36]. Rye and Mykura [37] focused on including financial aspects when determining the performance metrics of a transit system.
2.3. Unique Aspect of this Work
- The unique aspect of this work is targeted in two areas. First, when considering the social vulnerability and transit deserts, this work expands on previous work performed determine transit deserts in rural areas in Alabama as a function of total transit needy population, not just identify locations where there is high percent of potential transit dependent individuals. Second, this work looks to expand on the performance measure for rural public transit agencies by incorporating vulnerable population measures, service area of the transit provider and financial resources (developed a proxy by total number of vehicles).
3. Methodology
- The methodology presenting in this thesis is divided into two main focuses. The first is to convert the Social Vulnerability Index developed for Alabama into actual number of transit dependent people within areas of the state. The second is to develop a new performance measure that incorporates vulnerable population, service area and financial situation. Each of these is addressed separately in this section.
3.1. Potential Transit Ridership Numbers
- The goal of this section is to develop a methodology to determine the total number of vulnerable people in census tracts to essentially develop a total number of potential transit riders. The focused goal of this methodology is to determine the number of potential transit riders in a specific area. The use of this methodology can be providing information on how well vulnerable groups are currently served by transit services and where changes are needed. Additionally, this methodology supports the development of a transit performance measure that incorporates the number of potential riders to evaluate service. The methodology presented in this work build specifically in a methodology developed to determine a Social Vulnerability Index (SVI) for Alabama [1]. The original methodology integrated 15 social, economic, and demographic variables. The implementation of the previous methodology was to develop a function of SVI for each census tract in Alabama by developing a product of the percent of the population that were determined by the authors to represent vulnerability [1]. The previous methodology identified locations where there was the greatest level of social vulnerability, essentially identifying the census tracts where the highest percent of people had a vulnerability [1]. However, for decision makers, locating census tracts that had the highest percentage of people who potentially has a vulnerability, did not specifically address the needs with respect actual number of potential riders. This is to say, knowing the locations where the greatest percentage of vulnerable people reside might not be the best investment decision depending on the total number of people who reside in the census tract. For example, a location with an 80% vulnerable population that only has 100 people in the tract will not create more riders than a census tract with 50% vulnerable population that has 500 residents. For investment decisions, it is determined in this work that providing service to the greatest number of people will lead to the greatest benefit. Since the SVI calculated is a product of percent non-vulnerable population, the SVI ranges between 0-1, with a 0 value indicating that 100% of the population is vulnerable and a value of 1 indicating that 0% of the population will be considered socially vulnerable, or transit needed.To convert the SVI value to actual number people, the following equation is presented:
 | (1) |
3.2. Development of a New Transit Performance Measure
- The new transit performance measure developed in this paper is intended to overcome shortcomings of previously develop measures. The new components are intended to incorporate vulnerable population, service area and finances.Examining basic performance measure that have previously been used for transit agencies generally use simplified measures, such as:Transit performance=Transit demand/Transit capacityWhile the metric is often seen in transportation studies, specifically for roadways, where vehicle demand divided by roadway capacity is a good measure of roadway performance. First, when examining the limitations of this simple performance measure, the incorporation of vulnerable population is deemed necessary because some transit agencies benefit simply by the demographics in the service area. If an agency is located in an area with a greater number of potential transit riders, the agency might benefit through increases demand (ridership) through no actual quality operation by those who run the agency. Conversely, a transit agency that operates in the locations where the potential number of transit riders is low, having a high ridership value might indicate exceptional operations and efficiency.Second, when examining the limitations of this simple performance measure, the incorporation of service area size is an important variable, especially for transit agencies operating in rural areas. With low population distribution, an agency might face longer distance trips to transport fewer passengers than an agency with a smaller, more densely populated service area. Again, incorporating a variable to represent service area will allow different transit agencies to be compared on a similar scale.Third, when examining the limitations of this simple performance measure, the incorporation of financial variables is necessary for even comparison. The number of vehicles that can be purchased and operated by the transit agency is a direct measure of the financial ability of an agency. Therefore, if a transit agency can operate additional vehicles, they might have an advantage with respect to performance simply by having a larger system.The development of the performance measure is approached by making changes to the transit demand and transit capacity. Initially, the conversion of transit demand is modified by:
 | (2) |
 | (3) |
 | (4) |
3.3. Contribution of the Methodology
- The two methodologies presented in this paper are intended to move toward incorporating vulnerability into the analysis of transit service. While, potentially straightforward, these three methodologies are not currently in the literature for SVI analysis and performance measures for transit agency comparisons. The next section presents an application of these three methodologies using actual data for Alabama.
4. Case Study Analysis: Alabama Transit Agencies and Counties
- The case study included in this paper focuses on Alabama. The work applies the methodologies presented in section three using actual data for the state. The agencies names have been removed and replaced with letters to allow for anonymity of agency operations. The intent is that the performance measure level is intended for decision-makers who have budget to assist the agencies. This is not to call out any specific agency.This section is outlined by first presenting a discussion of the data collected. Second, the Total Vulnerable Population for census tracts in Alabama will be develop. Third, the measure of performance for the existing agencies will be presented, again without specific agency name.
4.1. Data Collection
- There are currently 23 transit agencies operating in 53 of the 67 counties in Alabama. The majority of the transit agencies are single-county, however, there are some agencies that cover multiple counties with the largest agency covering 10 counties in western Alabama. For each of the existing agencies, data was collected from the Alabama Department of Transportation as part of the data that is supplied to the Federal Transit Administration quarterly. The data used is the total for 2022. The census data used for population and demographics at the census tract level was obtained from the census.gov website and the year of the data was 2020. The SVI from the previous study were made available as a database file.
4.2. Total Vulnerable Population
- The determination of the Total Vulnerable Population (TVP) for Alabama follows the steps presented in the methodology. As indicated, the previous study that determine the level of SVI for census tract in Alabama through a product of the percent of the population that was non-vulnerable to determine the census tract level of vulnerability. Figure 1 shows the data for Alabama maps with the level of SVI.
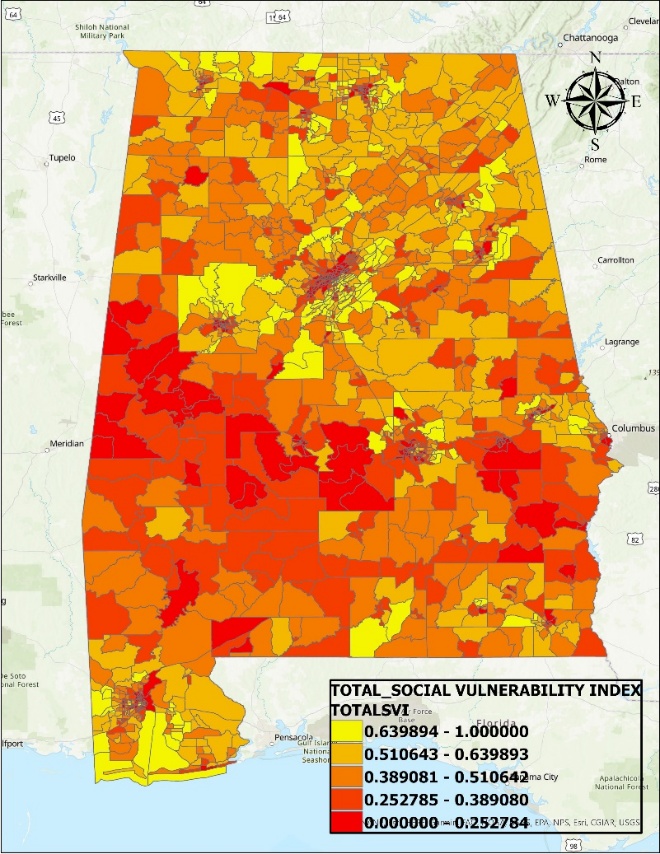 | Figure 1. Total Social Vulnerability Index for Alabama |
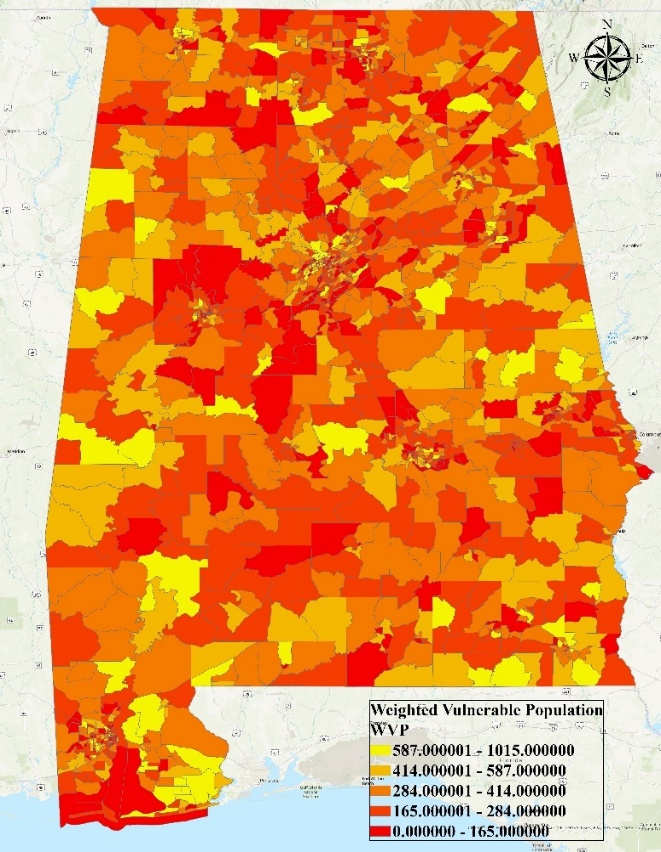 | Figure 2. Number of Potential Transit Riders in Each Census Tract |
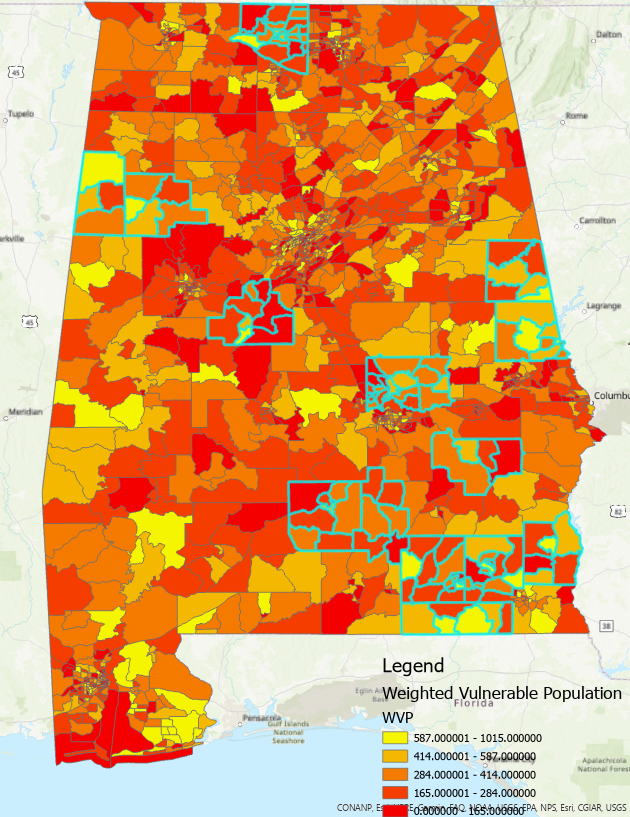 | Figure 3. Number of counties that do not have transit service |
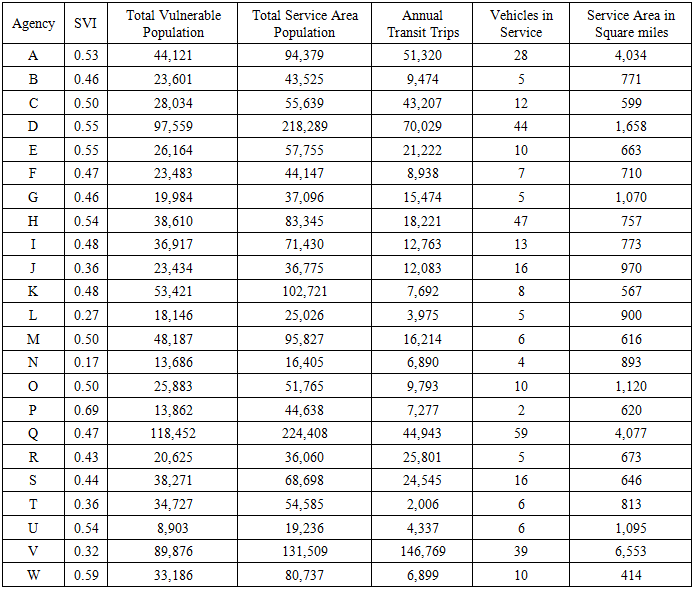
4.3. Application of a New Performance Measure
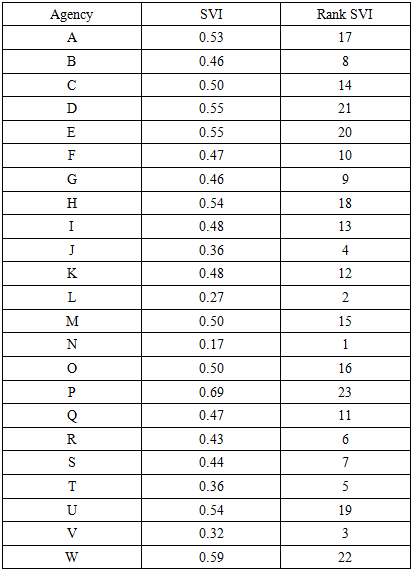
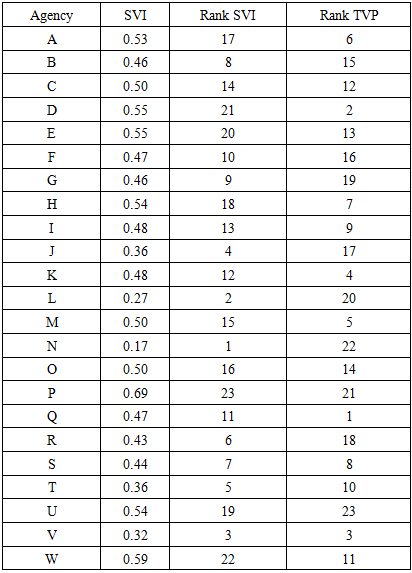
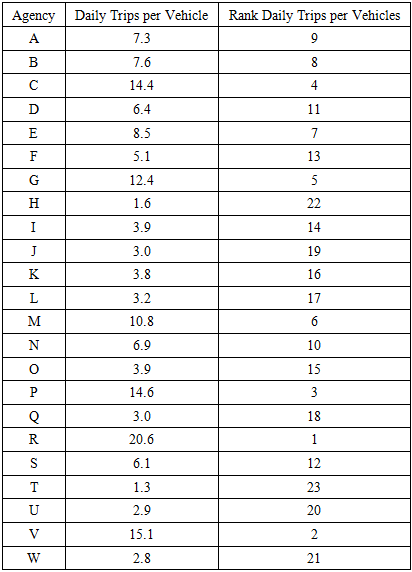
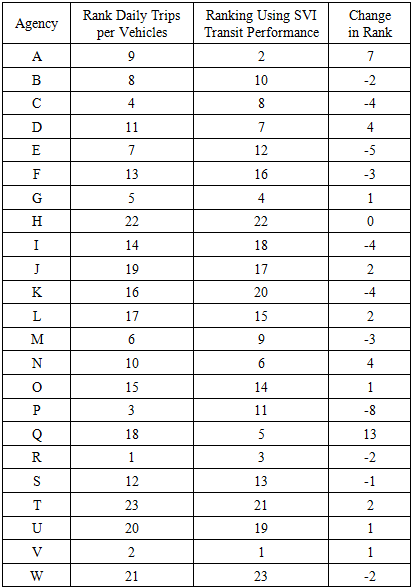
- The case study in Alabama to demonstrate the application of the new performance measure uses existing data from the Census Department and actual transit agencies operating in Alabama. As mentioned, there are currently 23 agencies operating in 53 of the 67 counties in Alabama. The data used in the study is shown in Table 1.
|
|
|
|
|
5. Conclusions
- The goal of this paper was to expand on the SVI work that has been performed in Alabama to truly get an understanding of the disadvantaged rider population throughout the state, to develop a performance metric that incorporates the number of disadvantaged riders and study area, and to use the performance metric to predict necessary vehicles and ridership to determine the appropriate amount to service to ensure “good” service.The effectiveness of existing rural transportation systems in Alabama has been evaluated in this work by using a new performance measure approach that considers the number of potential transit riders, service area and number of vehicles. The new measure has advantages and removes the limitations of simple performance measurements. Transit agencies that have higher performance levels simply because they are located in areas with more potential transit riders and smaller service areas will have to show an increase in passengers moved to be compared equally with agencies that have larger service areas and fewer people.The methodology presented in work provides decision makers information that can assist in the decisions related to establishing a new transit system. By addressing the complexity of varied communities and populations, this study ultimately offers a contribution to transit planning by enabling more effective and responsive services. This methodology relies on quantitative information. As shown in the literature review this transit performance measure might be improved by incorporating a passenger feedback component, to get attitudes toward service, as well as operations policies that relate to travel time and on-time performance to add to the developed measure. Additional future research may involve applying this methodology beyond Alabama to provide a measure of how well transit agencies are performing nationally.