-
Paper Information
- Paper Submission
-
Journal Information
- About This Journal
- Editorial Board
- Current Issue
- Archive
- Author Guidelines
- Contact Us
International Journal of Traffic and Transportation Engineering
p-ISSN: 2325-0062 e-ISSN: 2325-0070
2024; 13(3): 49-55
doi:10.5923/j.ijtte.20241303.01
Received: Nov. 20, 2024; Accepted: Dec. 9, 2024; Published: Dec. 11, 2024

Enhancing Road Safety: Evaluating the Impact of Bus Tracking and Speed Control Systems on the Dar es Salaam to Dodoma Corridor in Tanzania
Benson Rugalema Mwemezi
Department of Building Economics, Ardhi University, Dar es Salaam, Tanzania
Correspondence to: Benson Rugalema Mwemezi, Department of Building Economics, Ardhi University, Dar es Salaam, Tanzania.
| Email: |  |
Copyright © 2024 The Author(s). Published by Scientific & Academic Publishing.
This work is licensed under the Creative Commons Attribution International License (CC BY).
http://creativecommons.org/licenses/by/4.0/

Transportation in Tanzania comprises several modes, with road transport being one of the most prominent. Public road transport primarily involves inter-regional travel by buses, which carry both passengers and goods between regions. However, road crashes have significantly impacted transportation in Tanzania, with regional buses being involved in numerous accidents. Road safety has become a critical issue, as the consequences of road crashes extend beyond fatalities to include the destruction of buses and damage to highway infrastructure, such as road signs, posts, and markings. This increases the need and cost of highway maintenance. The study examines the effectiveness of a vehicle tracking system as a method to reduce road crashes. This system was introduced to monitor and control the speed of regional buses. It operates by alerting drivers when they exceed the speed limit, set at 80 km/h on the device. If a driver exceeds this limit, the system sends information to the nearest traffic office along the bus route. The study further suggests improvements to enhance the functionality of these devices to better reduce road crashes and improve safety for all road users. Descriptive research designs were used to collect and analyze crash data for all regional buses operating along the corridor.
Keywords: Transportation, Crashes, Vehicle tracking system, Tanzania
Cite this paper: Benson Rugalema Mwemezi, Enhancing Road Safety: Evaluating the Impact of Bus Tracking and Speed Control Systems on the Dar es Salaam to Dodoma Corridor in Tanzania, International Journal of Traffic and Transportation Engineering, Vol. 13 No. 3, 2024, pp. 49-55. doi: 10.5923/j.ijtte.20241303.01.
Article Outline
1. Introduction
- Road transport is one of the most commonly used modes of transportation in Tanzania. The regional movement of people via road transport is facilitated by privately owned regional buses, which typically have a carrying capacity of 30 to 50 passengers. These buses operate across the country, with ticket prices regulated by the Land Transport Regulatory Authority (LATRA). For instance, ticket prices for travel from Dar es Salaam to Dodoma range from 19,000 TSH to 40,000 TSH, depending on the service level of the bus. The service levels are categorized as luxury, semi-luxury, and normal. Regional buses primarily operate on trunk roads managed by the Tanzania National Roads Agency (TANROADS). Some of these roads are paved, while others remain unpaved. The total length of paved trunk roads is approximately 7,291.2 km [17].Bus stands are available in all major regions and serve as drop-off and pick-up points for these buses. The buses are assigned to specific routes that follow the network of trunk roads across the country.Regional buses face several challenges during their daily operations, with crashes being one of the most significant. These crashes occur as buses travel from one point to another, resulting in negative impacts on road users. The causes of these crashes are varied. According to [5], less than 10% of crashes are attributed to environmental factors such as weather or road conditions, while more than 90% are caused by human factors, including reckless driving and speeding.Speeding whether exceeding the posted speed limit or driving at inappropriate speeds for prevailing conditions significantly increases the likelihood and severity of crashes [13]. Road crashes are identified as a major cause of fatalities, often resulting in the deaths of many people at once and causing damage to highway infrastructure [5].The Surface and Marine Transport Regulatory Authority (SUMATRA) implemented measures to reduce these incidents by addressing human factors. This was achieved through the introduction of bus tracking and speed control devices under the Vehicle Tracking System (VTS).
2. Literature Review
- Road transport, compared to other modes of transportation, is more flexible, relatively cheaper, and faster. It also has a high capacity for carrying goods over short distances. However, one major disadvantage of this mode is the cost of maintenance [11]. Road safety, a crucial aspect of road transportation, involves the interplay between the driver, vehicle, road, and environment [16]. In Tanzania, some common causes of road crashes include overloading vehicles, speeding, drunk driving, mobile phone use while driving, poor infrastructure, animal crossings, running red lights, driver distractions (caused by internal or external factors), and adverse climatic conditions.The severity of crashes indicates how serious the crash was. In Tanzania, road transport accommodates 80% of all passengers [4], meaning that crashes often involve a significant number of people. The severity of road crashes can be categorized into three main levels: fatal, injury, and property damage [7].The Vehicle Tracking System (VTS) is a system that enables the tracking and control of vehicles through an online computer that provides real-time information about a vehicle's location, details, and speed. The system involves installing a device inside the vehicle, which is connected to a control room at the control centre. These devices send information to SUMATRA offices when buses exceed the speed limit of 80 km/h, which requires a stopping distance of 55 meters once the brakes are applied [14]. The device installed in the vehicle consists of a global positioning system (GPS) and a speed sensor with an alarm system. The GPS operates using a trilateration technique, which calculates location, velocity, and elevation by collecting signals from satellites [3]. Before the introduction of VTS, speed control was managed using speed governors. These devices were installed in vehicles to limit their speed by restricting fuel flow [18]. The speed of vehicles was regulated and confined to the limits prescribed by traffic regulations [15].The Vehicle Tracking System (VTS) in Tanzania operates by connecting the Traffic Police Office and LATRA. Each major regional bus stand and traffic police office is equipped with a control room featuring a large screen that displays a map of Tanzania, including all regional bus routes. A bus symbol indicates the location of each bus, along with relevant information such as the driver's name, vehicle details, speed, and owner. The system also calculates the time taken by the bus on its route, enabling transit agencies to improve their management and service levels. Additionally, the system allows passengers to plan their journeys more effectively [20].
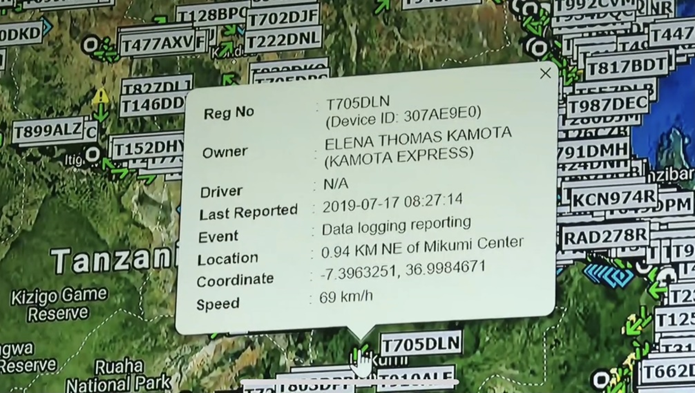 | Figure 1. Information of a regional bus displayed on Vehicle tracking system |
3. Methodology
- The study used an ordered logit regression model. Since many transportation applications involve ordered discrete data, the ordered logit regression model was applied to examine the relationship between attributes such as speeding, driver’s age, reckless driving, vehicle malfunction, day of the week, and time of day, and the severity of crashes [19] [10]. The study involved two types of data: primary data and secondary data. According to [1], data collected through surveys, interviews, case studies, and problem-solving are called primary data because they are obtained firsthand, while data collected using desk research are called secondary data, as they are obtained from other sources. The secondary data collected consisted of qualitative data, including crash data from regional traffic officers and average daily traffic data obtained through documentary review. Primary data included the number of regional buses using the devices and the mode of operation of vehicle tracking and speed control devices in Tanzania. These data were collected through interviews with the director of the safety department at LATRA. The collected data were analyzed and summarized using tables, charts, graphs, and textual descriptions through descriptive analysis. The research design was developed after identifying the research problem. The design required a conceptual framework to maximize data yield, ensuring that data collection was conducted efficiently in terms of time and cost [6].
4. Data Processing, Analysis and Discussion
4.1. Data Processing
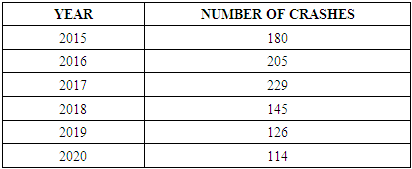
- Regional bus crash data were collected from 2015 to 2020 (i.e., the years before the introduction of the vehicle tracking system (2015 to 2017) and after the introduction of the system (2018 to 2020)). Descriptive analysis was conducted to identify the months with the highest number of crashes. December had the most crashes, as people tend to travel more during the holiday season at the end of the year. June and September recorded the second highest number of crashes, following December.
|
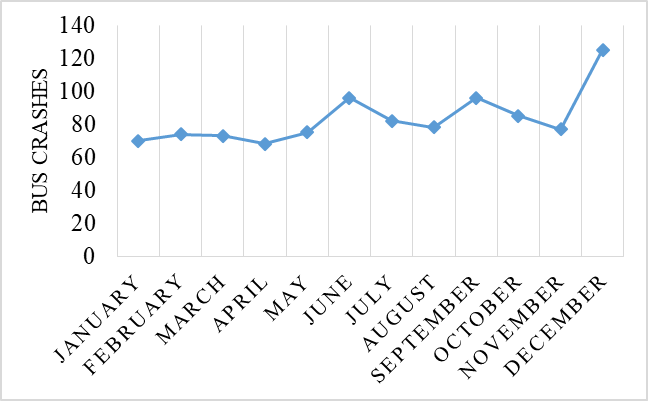 | Figure 2. Monthly distribution of bus crashes in Tanzania |
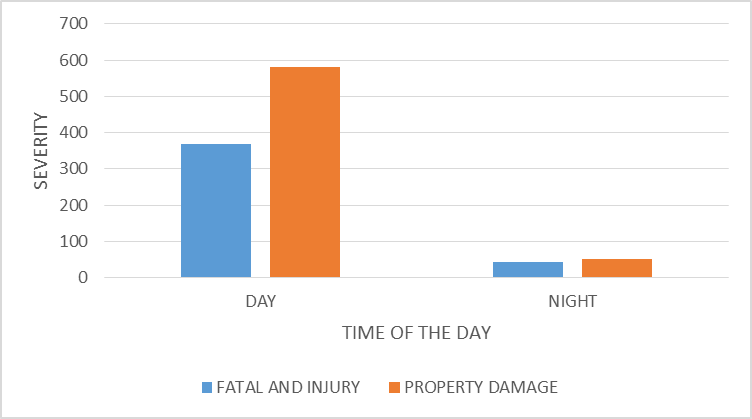 | Figure 3. Severity distribution on time of the day |
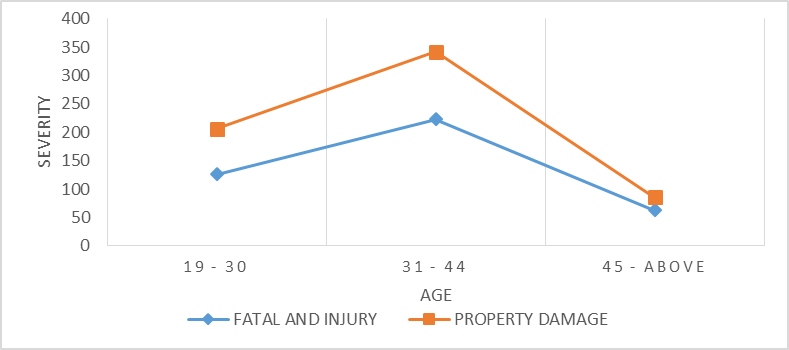 | Figure 4. Crash severity on age group basis |
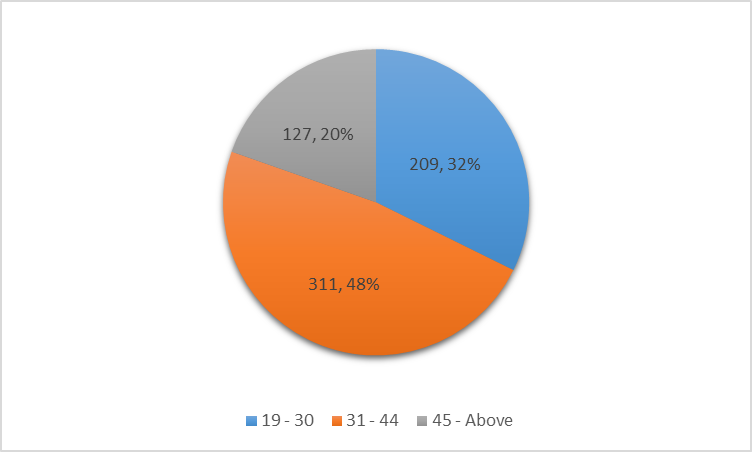 | Figure 5. Speed and reckless driving distribution on age group basis |
4.2. Data Analysis
- The study used an ordered logit regression model. The model was derived by defining an unobserved variable, z, which is a linear function of all observations [19].
 Where; X is a vector of variables determining the discrete ordering for crash observation, β is a vector of estimable parameters, and ε is a random error term. Using the above equation, each injury outcome level (y) which are ordinary, can be represented as observable;
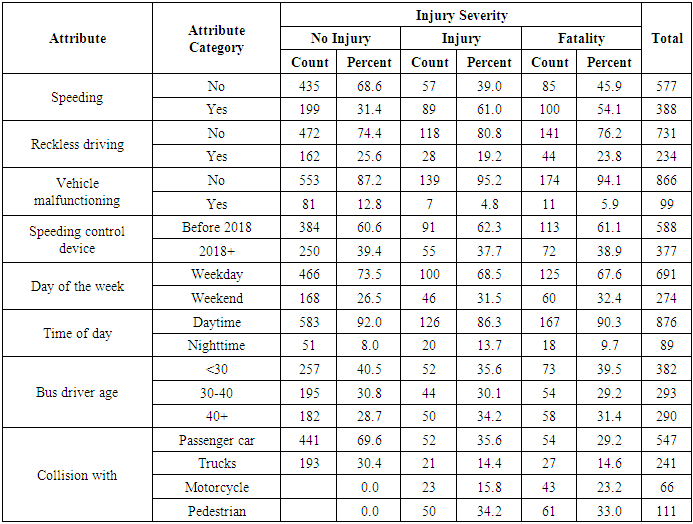
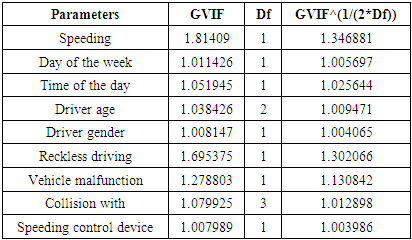
 The crash data contain several variables used by the model to generate the study results. The model describes the severity of crashes in relation to other variables such as speeding, reckless driving, vehicle malfunction, day of the week, time of day, driver’s age, and type of collision. Each variable is categorized as coded in the model.Table 2 shows different variables in relation to crash severity. Speeding contributes more to fatal severity in the case of crash causes, with a total of 54%. Reckless driving and vehicle malfunction have a lesser contribution in comparison to speeding.
|
|
4.3. Results and Discussion
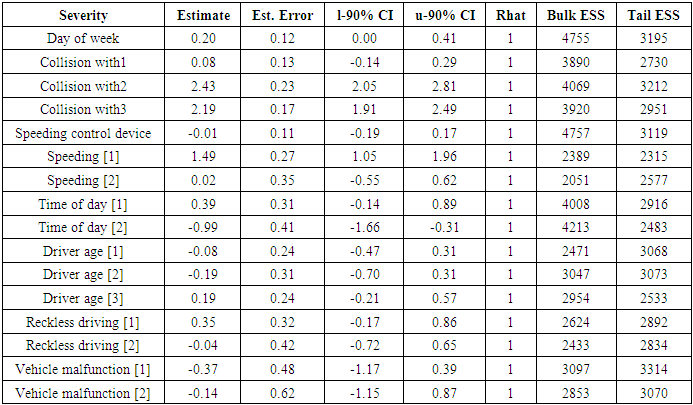
- The results of the model are discussed as displayed in Table 4. The table contains parameters that explain the results and findings of the study. Parameters are considered significant if the 90% confidence intervals are both of the same sign (either negative or positive) in the model result (i90% CI and u90% CI).
|
5. Conclusions and Recommendations
5.1. Conclusions
- Regional bus crashes show a difference between the years before and after the introduction of vehicle tracking devices. The findings of the study show that the number of crashes reduced after the introduction of the devices. The severity of bus crashes along the corridor is predominantly characterized by property damage. During the six-year period, a total of 633 crashes were classified as property damage. Both buses and highway facilities are affected when a crash occurs. As a result, regional buses in the corridor have led to fatalities, injuries, and damage to vehicles and highway facilities, such as signposts, light posts, and pavements.Crash severity and occurrence have both reduced after the introduction of the vehicle tracking system. Mid-year and end-of-year periods have experienced more bus crashes, as these times coincide with holidays for schools, colleges, and universities, leading to higher regional movement of people. Between May and August, a total of 320 crashes occurred in the corridor between Dar es Salaam and Dodoma. In the period between September and December, there were 375 bus crashes in the corridor. This shows that the end-of-year period experiences more crashes involving regional buses in this corridor.During the week, the study found that more regional bus crashes occurred on weekends. Saturdays and Sundays recorded a total of 275 crashes over the six-year period. Most regional bus crashes are caused by speeding and reckless driving, while environmental factors and vehicle malfunction contribute less. A total of 645 crashes were caused by speeding and reckless driving during the six-year period. Reckless driving in this case involves drunk driving, rubbernecking, sleeping, cellphone use, and chatting with passengers. Human factors are the primary contributors to the majority of regional bus crashes.Driver's age can influence crash severity and occurrence. Most young drivers under the age of 45 have been involved in more crashes compared to drivers above that age. Drivers in this age range typically feel energetic and sharp, which leads them to speed, ultimately resulting in more crashes. Drivers under 45 years old have been involved in a total of 520 crashes over a six-year period along the corridor from Dar es Salaam to Dodoma, causing 349 fatalities and injuries.Driver's gender has an influence on crash occurrence. Over the past six years along the corridor, male drivers have been involved in more crashes compared to female drivers. The aggressiveness of male drivers on the road is one of the reasons they are involved in more crashes.
5.2. Recommendations
- A critical analysis of the study found that the vehicle tracking system is effective in improving safety to some extent. The study provides the following recommendations to increase the safety effectiveness of the vehicle tracking system and reduce crashes involving regional buses and other road users:• Strict penalties for all drivers exceeding the posted speed limit detected by the system. Once a driver exceeds the speed limit, a heavy penalty should be issued to make drivers realize the consequences of speeding.• Road signs should be clearly visible, and regular maintenance of highway facilities should be adopted to ensure drivers have a clear view of all signs and obstacles along the road.• The vehicle tracking system should be able to detect areas with a high crash history and alert drivers or reduce the speed limit in those areas. The devices should be more digital so that sudden changes can be made and communicated to the driver.• The study also recommends that clear education be provided to passengers so that, when on the road, they can take responsibility and talk to the driver if they hear an alarm from the system. Currently, if you travel on regional buses, you may hear the alarm when the driver exceeds the speed limit, but no passengers complain.
 Abstract
 Reference
 Full-Text PDF
 Full-text HTML