Frédéric Esse Esse1, 2, Cyrille Mezoue Adiang3, Fabien Kenmogne1, Moussa Sali1, 4
1Department of Civil Engineering, Advanced Teachers Training College of the Technical Education, University of Douala, Cameroon
2Doctoral School of Basic and Applied Sciences, Doctoral Training Unit for Engineering Sciences, Mechanical Laboratory, University of Douala, Cameroon
3National Polytechnic School, University of Douala, Cameroon
4Laboratory of Materials, Mechanics and Civil Engineering, National Higher Polytechnic School of Maroua, Cameroon
Correspondence to: Fabien Kenmogne, Department of Civil Engineering, Advanced Teachers Training College of the Technical Education, University of Douala, Cameroon.
| Email: |  |
Copyright © 2023 The Author(s). Published by Scientific & Academic Publishing.
This work is licensed under the Creative Commons Attribution International License (CC BY).
http://creativecommons.org/licenses/by/4.0/

Abstract
The traffic congestion measurement parameters are estimated for the case of the most congested roads in the Douala city of Cameroon, that is the Village section (Borne 10 crossroads) - Ndokoti (Tradex) in the 3rd district municipality of Douala for the period from March 6 to April 1, 2023. The main goal here is the estimation of the average time taken, the speed variation, the delay and the congestion index for road traffics, which would help town hall officials and engineers in the process of expanding roads to facilitate urban expansion, and the fluidity of traffics. To this end, the area under consideration is geolocated and subdivided into six subsections. By using a GPS fixed in a car, the data were collected from Monday to Friday, within four weeks and this for the time slots: 7am-11am, 12pm-4pm and 4pm-8pm. These data allowed us to estimate the average travel time, the speed variation, the delay and the congestion index on the considered section. The results found show that the average journey time is higher in the evening between 4 p.m. and 8:43 p.m. and in the morning between 7 a.m. and 11:41 a.m. The delay spent in the section is very considerable (more than 3 min/km), which is due to the presence of intersections and markets. The extra time to be added to the route is 32 minutes in the evening and 30 minutes in the morning, which is understandable since the congestion indices are generally very high in the evening and during the day. The 12 p.m. to 4 p.m. time slot is the best time slot for daytime travel on this stretch.
Keywords:
Average travel time, Measurement parameters, Congestion index, Urban traffic, Road section
Cite this paper: Frédéric Esse Esse, Cyrille Mezoue Adiang, Fabien Kenmogne, Moussa Sali, Estimation of Measurement Parameters of Urban Traffic Congestion: Case of a Road Section of the Douala 3rd District Commune in Cameroon, International Journal of Traffic and Transportation Engineering, Vol. 12 No. 2, 2023, pp. 29-39. doi: 10.5923/j.ijtte.20231202.03.
1. Introduction
Urban transport is considered essential in improving economic growth, especially in developed countries. Fast and reliable movement of people and goods is one of the key functions of arterial and sub-arterial roads in urban areas [1]. These areas are engines of economic growth and employments, according to the World Bank, cities generate more than 80% of gross domestic product (GDP) [2]. This might not be possible in developing countries where traffic congestion, especially in urban metropolises is highly observed [3]. Cities can only survive whether they can guarantee viable and efficient transport systems [4], which is one of the major problems that most metropolises face [5]. Major transport problems are usually related to urban areas and they arise when transport systems cannot meet the many demands of urban movement [6]. The travel time remains a worrying element for the transport of urban populations, passengers and goods. Time is associated with financial value, so the extra time on the roads constitutes a huge economic loss which leads to their inefficiency.In urban areas, congested roads consume time and energy, and therefore have a negative impact on the economy, the environment and health [7]. Congestion phenomena are manifested by traffic jams and these have a negative impact on society, they have serious environmental consequences (CO2 emissions). This is why it becomes necessary to control them. Let us mention that congestion is a condition in which the number of vehicles attempting to use a road at any time exceeds the capacity of the road to support the load at generally acceptable levels of service [8]. Particularly in Cameroon, Douala and Yaoundé are the most densely populated cities and there, road must be as large as possible to avoid congestion.Douala is the economic capital of Cameroon (capital of the Littoral Region), cosmopolitan it stands out as the largest city in the CEMAC zone and one of the most populated cities in the country. Due to its position as a port city, it provides a privileged maritime access route to the Atlantic Ocean, making it the economic heart of Central Africa. Douala is currently facing serious problems of recurring urban traffic congestion and has become denser over the years in the city, giving way to recurring traffic jams to some times of the day. The frequency at which production and distribution should flow is slowed down due to traffic jams thus causing a considerable shortfall in the city's economic sector. The Douala 3rd district municipality is crossed by the national N3, it is the penetrating east of the city. This section is very stressed by inter-urban and intra-urban transport, the impact of this solicitation is felt by an extended period during the trip. The section that poses a problem on this penetrating road is between Village (Borne 10 crossroads) and Ndokoti (Tradex). The query is the seeking of efficient mechanisms to reduce the phenomenon of traffic congestion on this section, which could be extended in all the city of Douala, and this which involves its deep study. This is why this paper aims to investigate traffic congestion indicators in the municipality of Douala 3rd more precisely on the Village section (Borne 10 crossroads) - Ndokoti (Tradex). Thus the work is structured in two main parts. The first part which will deal with the methodology used and the second deal with the presentation of the results obtained and the discussion.
2. Methodology and Tools
2.1. Study Area
The municipality district of Douala 3rd belongs to the six municipality districts of the city of Douala, it extends over the south-east of the city. Bounded in the south and east by the Dibamba river, to the north by the municipality of Douala 5 and the Nkam division and to the west by the municipality of Douala 1st and Douala 2nd, it is located between the geographical coordinates: 3 °94'1253''N, 4°12'0657''N; and 9°71'2378''E, 9°86'3319''E. Figure 1 shows the geolocation of the municipality of Douala 3rd in Central Africa and particularly in Cameroon.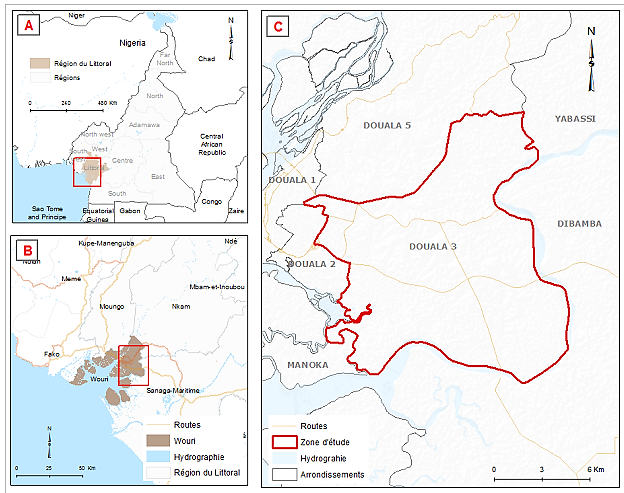 | Figure 1. (A): Location of the Littoral Region in Cameroon; (B) Location of the Wouri division in the coast; Location of the Douala 3rd district municipality [9] |
2.2. Project Road Section
The road section studied is 8.4 km long and is located between Village town (Borne 10 crossroads) and Ndokoti (Tradex). It is mainly contained on the penetrating east of the city which serves as an exit to the national N3 which connects the city of Douala to the political capital Yaoundé. It is an artery with heavy urban traffic that experiences congestion phenomena on a recurring basis.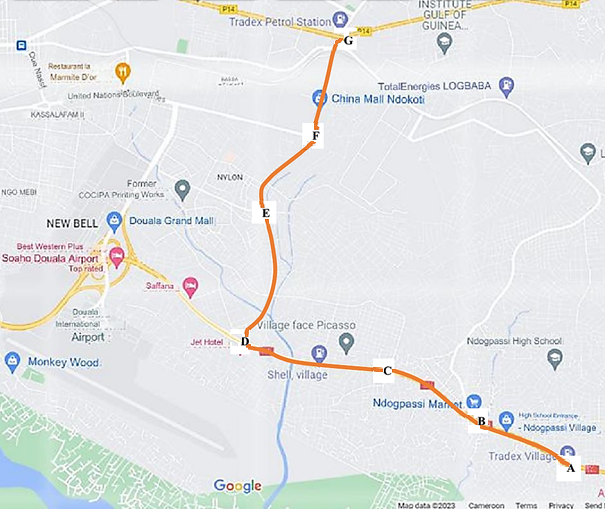 | Figure 2. Road section (In orange color): Village (Borne 10 crossroads) - Ndokoti (Tradex) |
2.3. Delimitation of the Subsections
The section was delimited by taking as intersection points: Tradex Borne 10 (A), Ndogpassi market roundabout (B), Ball entry roundabout (C), Elf roundabout (D), Roundabout- Dakar (E), Roundabout CCC (F) and Tradex Ndokoti (G) as shown in Fig. 3, while the distances between two adjacent points are shown in Table 1.Table 1. Distance between intersections
 |
| |
|
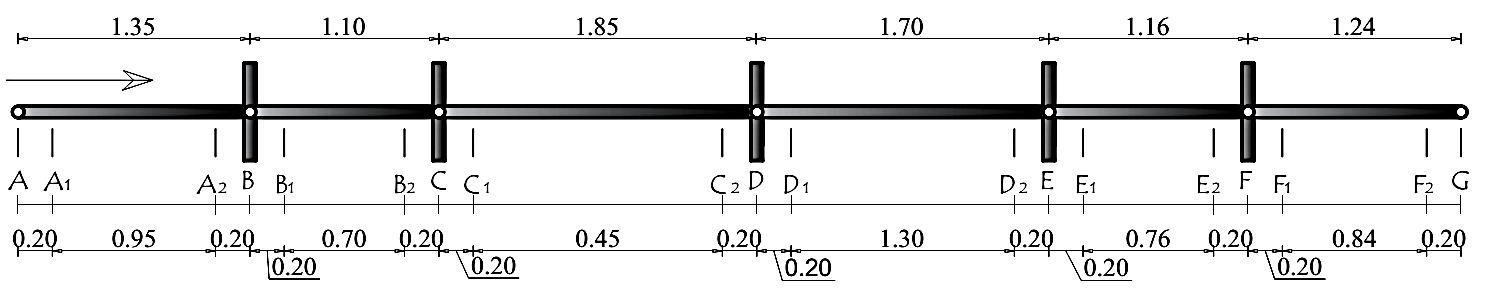 | Figure 3. Modeling of the study section |
2.4. Determination of Congestion Measurement Parameters
2.4.1. Average Journey Times of the Section
The average journey times made are calculated using the following expression: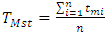 | (1) |
Where  is the average time taken on the sub-sections (in minutes);
  is the time taken on the subsections in week (in minutes);
  is the number of weeks of data collection. The times taken on the different sections were recorded over a period of four weeks for three time slots each day (7 a.m. to 11 a.m.; 12 p.m. to 4 p.m. and 4 p.m. to 8 p.m.) from Monday to Saturday. From these data, the average times were calculated according to the time slots and recorded in the Tables A1 to A3 in the Appendix.
2.4.2. Variation of Speeds on Section
The speed variation occurs whether there is an obstacle, increasing the traffic density on the section or an intersection of two sections, meaning that the driver has to modify his speed to adapt to the circumstances. It is expressed by calculating the average speeds on the sub-sections, using the expression: | (2) |
where  is the average speed on the subsection in (km ⁄ h),
  is the travel distance (in km) on the subsection.
2.4.3. Delay on Section
It expresses the additional time suffered by a road user due to traffic congestion compared to the journey in a fluid situation or in acceptable journey time [10]. The calculation of the delay (R) on the section is given by the following expression: | (3) |
where ∆T is the variation of the travel time, related to the average time in acceptable traffic condition on the section  by:
by: | (4) |
The traffic speeds in urban areas are conditioned by the 2001 CEMAC community highway code such as: For intermediate sections, an acceptable speed  of 60 km/h is set. But 200 m before crossroads, markets, zebra crossings, the maximum speed fixed is
  = 30 km/h. one can thus estimate the average time spent in acceptable traffic condition on the section
  . Subsequently we deduce the delay per unit distance
  according to the following expression:
 | (5) |
2.4.4. Congestion Index
The congestion index, which expresses the state of occupation of the road surface by traffic, is related to travel times following the expression [11]: | (6) |
A zero value of this  is found for very low level of congestion, which is for the travel condition close to the free flow condition or the acceptable condition. A very congested condition is obtained whether
  . This calculation method was also used by [12] for the calculation of congestion indices on the sections.
3. Results and Discussion
3.1. Estimation of the Average Journey Times of the Section
The tables from 2 to 4 give the average travel times for some arbitrary choice of the period of days, which allow us to plot the graphs as shown in Fig. 4, according to different reference points and the mileages which are shown in Fig. 5. From where one notices that it takes more time when moving on this section between 7 a.m. and 11 a.m. (about 43 minutes), although between Tradex terminal 10 (A) and Ndogpassi market (B) the time taken is also great between 4 p.m. and 8 p.m. The most requested time intervals during the trip are between 7 a.m. to 11 a.m. and 4 p.m. to 8 p.m., which correspond respectively to the period of going out in the morning for the various activities of the day and to the period of return in the evening. These periods are therefore the busiest when travelling. Let us outline that regardless of the travel time slot during the day, the times spent are very high considering the travel time on a free road (about 11 minutes). These are the indicators of the traveling difficulty in the day on this section which is congested and increases the journey time.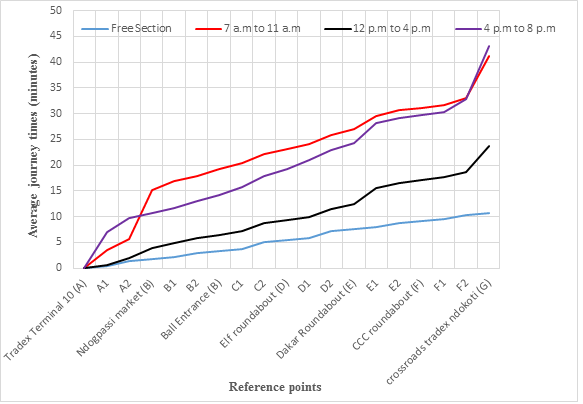 | Figure 4. Average travel time according to the different reference points |
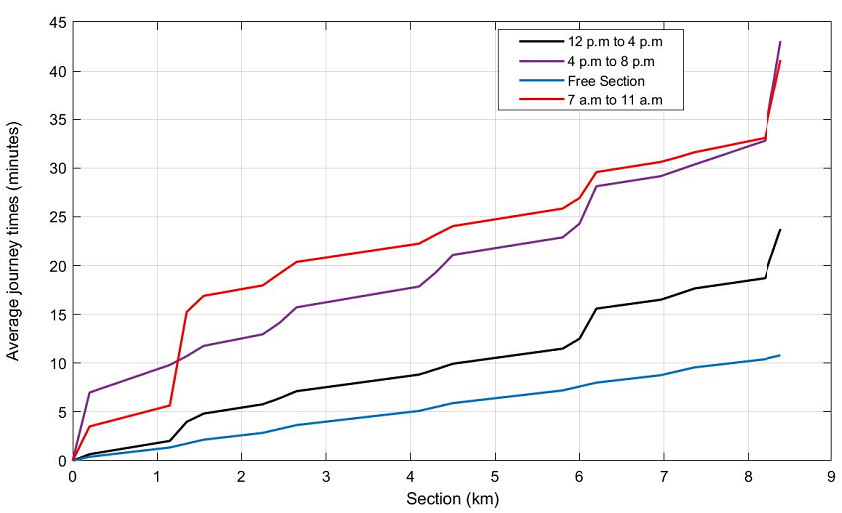 | Figure 5. Average travel time according to the distance of the section |
3.2. Estimation of Speed Variations on the Section
The average travel speed at different chosen time slots is very disproportionate, taking the reference on the acceptable speed. Figure 6 illustrates the variation of these speeds as a function of reference points, while Fig. 7 shows the variation of speeds as a function of mileage.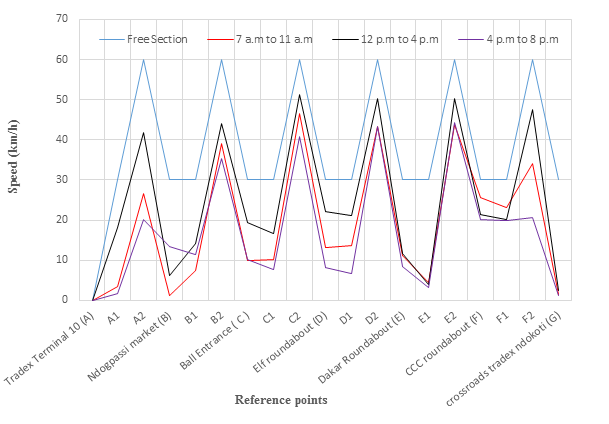 | Figure 6. Variation of average velocities according to the reference points on the section |
 | Figure 7. Variation of average speeds according to the mileage of the section |
The most significant intervals of speeds occur between 7 a.m.-11 a.m. and 4 p.m.-8 p.m., corresponding to periods of dense traffic. The lowest speeds are obtained: at the Ndogpassi market (1 km/h) and its surroundings (7 km/h), at the Dakar roundabout (3 km/h) and its surroundings (9 km/h), at tradex Ndokoti (1 km/m), at the Bille entrance (10 km/h) and its surroundings (8 km/h) then at the Elf roundabout (8 km/h) and its surroundings (7 km/h). All these points are commercial centers, either located near the road or intersection points where anarchic parking proliferates.
3.3. Estimation of the Delay on the Section
The delay or extra time to be expected during the route was analyzed in two ways, first between subsections (Fig. 8), then generally over the entire section (Fig. 9).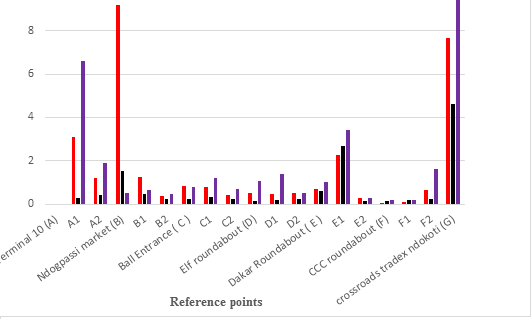 | Figure 8. Intermediate delay at the subsections |
 | Figure 9. General delay on the section |
The delay on the subsections is very high when approaching the Ndogpassi market between 7 a.m to 11 a.m. (9 minutes) and Tradex Ndokoti between 4 p.m. and 20 p.m. (nearly 10 minutes), this indicates the heavy demand on these sections at the times.The delay observed on the whole section is enormous and at any time of the day. This is found when it is greatest between 4 p.m to 8 p.m. (about 32 minutes). The 12 p.m to 4 p.m time slot remains the best and most suitable for traveling on this section. The delay per kilometer is expressed by Fig. 10, from where it is obvious that the traveling between 7 a.m to 11 a.m, leads to an additional time of 3.6 min per km which will have to be added, between 12 p.m to 4 p.m. one has the increasing of 1.5 min per km, while between 4 p.m to 8 p.m. one must add 3.80 min per km to the travel time. | Figure 10. Delay per kilometer on the section |
3.4. Estimation of the Congestion Index
Figure 11 shows the results found giving the congestion index on the section for the three time slots under consideration according to the intersection points, while Fig. 12 is plotted according to the distance of the section. | Figure 11. Congestion index according to intersection points |
 | Figure 12. Congestion index according to the mileage of the section |
Let us mention that all sections of the road is generally highly congested for the time slots varying from 7 a.m. to 11 a.m. and 4 p.m. to 8 p.m, and the congestion indices are greater than 2 and slightly congested between 11 a.m. and 4 p.m. according to [11]. Similarly, the indices are very high after tradex terminal 10 (16.5), at the Ndogpassi market (23), after the Dakar roundabout (6.7) and at tradex Ndokoti (24.6). These points therefore constitute breakpoints where speed drop on this largely borrowed section in the commune of Douala 3rd. The main cause is the temporary occupation of the sidewalk lane by traders and itinerant traders. Anarchic trade is a major problem responsible to congestion at intersections. The district municipality distributes authorizations for temporary occupation of the public road to traders, which motivate pedestrians to find themselves on the surface of the roadway to move, thus reducing the mobility area.One can also mention the degradation of the roadway on certain subsections. The proliferation of potholes is a consequence of the permanent lack of maintenance of the roads, which makes traffic very difficult for vehicles and originates speed drops. Another cause and not the least is the high traffic on this road. Indeed this section is very solicited for interurban transport, because of its position on the exit of the national N3 and intra-urban, and the massive urban sprawl towards the suburbs of Yassa. Figure 13 summarizes the traffic conditions at these intersections.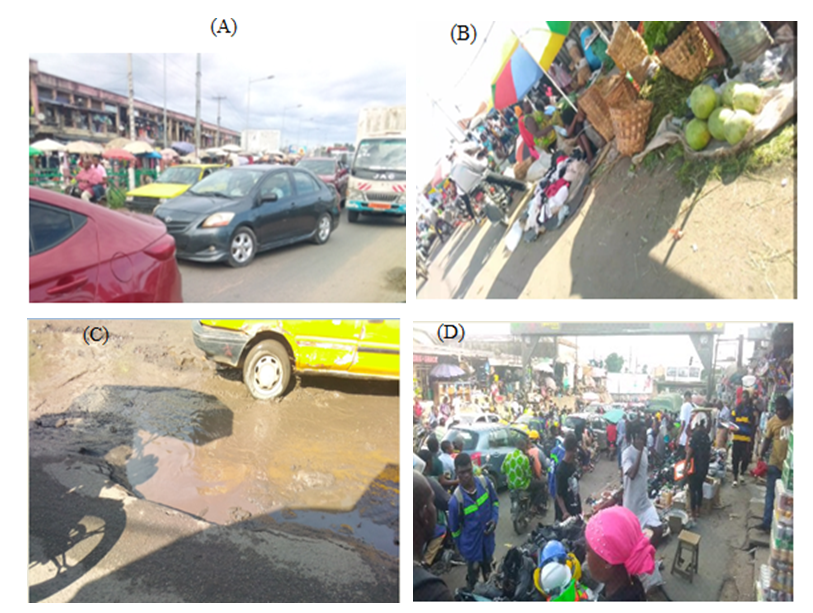 | Figure 13. (A) Intersection of the section at Ndogpassi market; (B) Intersection of the section at the Dakar roundabout; (C) Strong degradation of the section at the Dakar market; (D) Passage of tradex Ndokoti towards the tunnel |
3.5. Discussion
It is obvious in this work that at certain times interval of the day, the congestion rate is high, meaning that the traffic is very difficult because of traffic jams while approaching intersections and markets. This situation can therefore lead to tiredness of some drivers while driving vehicles, and could originate some road accidents. To solve this problem, it would be necessary to adopt autonomous cars [13] and [14], which can operate without a driver, which will also allow solving the incivility problem of certain motorists on the road [15]. These types of cars are equipped with a GPS to signal their location and also radar systems, which can detect obstacles and trigger acceleration or braking. In order to avoid excessive maneuvering which can quickly damage these vehicles, the flow of traffic on the road must be regulated. For this, the road must be in good passable condition and the interchanges must be built at the most congested intersections.Let us remember that during the COVID 19 period, the confinement imposed by the authorities in place pushed most workers to lose their jobs, who could only travel for vital necessities [16]. The part-time system imposed in schools and the closure of certain businesses such as drinking establishments has meant that the number of passengers requesting transport was considerably decreased. However due to the fact that the number of passengers allowed in vehicles is reduced by half because of confinement [13], we noted during some of our trips on this road that there was no significant gap between the travel times and this in the time slots during the day, but the traffic flow was relatively high, despite the low congestion rate obtained.
4. Conclusions and Recommendations
The aim of this work was the estimation of some parameters for measuring urban traffic congestion in the district commune of Douala 3rd, taking as a reference road section, the road section Village (Borne 10 crossroads) - Ndokoti (Tradex). To carry out this study, the chosen road section was identified and modeled, while certain reference points were materialized at each spatial interval of 200 meters, before and after the intersections on the section. Then the daily time data of travel on the section were collected within a period of four weeks. These data are used to calculate the mean velocities from varying time intervals of the day, namely: 7 a.m. to 11 a.m., 12 p.m. to 4 p.m. and 4 p.m. to 8 p.m. By using these data, the average travel times, the variation in average speeds, the delays and congestion indices were found and plotted. According to these results it was obvious that: The average travel times are highest between 7 a.m.-11 a.m. and 4 p.m.-8 p.m., while the average speeds are very low when approaching intersections. The delays on sections are very high between 7 a.m.-11 a.m. and 4 p.m. to 8 p.m. and congestion indices are very high between 7 a.m. and 11 a.m. and 4 p.m. to 8 p.m., and more particularly at the Ndogpassi market and the Ndokoti Tradex crossroads. The results shown here are alert elements to the municipality agents of Douala 3rd on the level of road congestion in their community, and can be extended in roads in the Douala city. They could also be the decision-making support tools for the authorities in charge of decentralized communities. The excessive delays and very high congestion indices on the Village (Borne 10 crossroads) - Ndokoti (Tradex crossroads) section sufficiently show that public authorities should seriously consider immediate and long-term solutions to improve travel conditions for people. The following recommendations must be taking into account in order to reduce the congestion phenomenon faced by the Commune of Douala 3rd.- It should be important to think about the total release of the mobility area on the roads, the markets present at certain crossroads should be compelled to the sole occupation of the areas fitted out for the cause (shops, hangars, counters, etc.). To this, one can combine the abolition of anarchic parking at intersections by motorcycles.- It should be also important to think about revitalizing the road maintenance services. The maintenance action is curative so letting the evil grow would only be detrimental to the good circulation.- To end, one should think of long-term solutions to reduce the excessive flow of traffic on the main arteries by particularly considering solutions such as the polycentrism of the Douala metropolis. Setting up the polycentrism of the city would mean that large urban centers can be created in each district municipality of the city. By equipping these centers with certain services (administrative, port, commercial, etc.) that encourage people to travel long distances, their travel would be limited, mainly within their district municipality.
Appendix
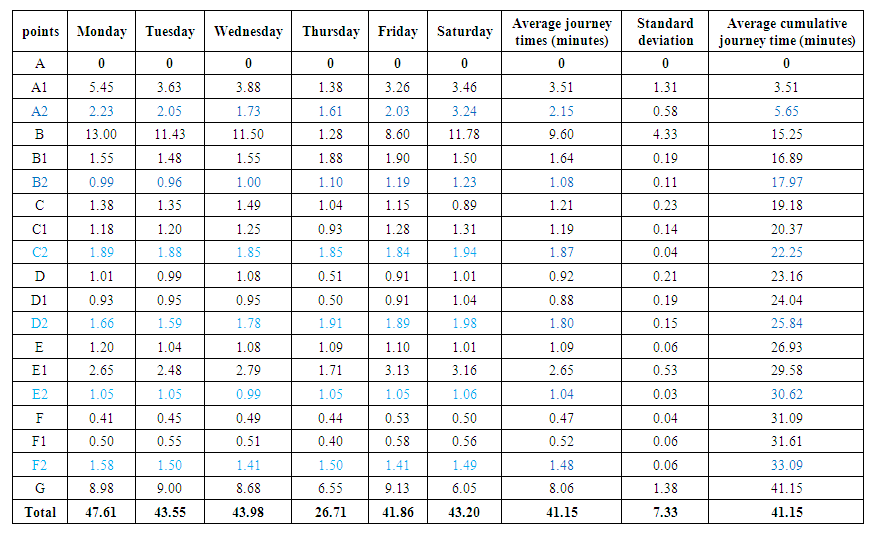 | Table A1. Average journey times (in minutes) for the time slot (7 a.m. to 11 a.m.) |
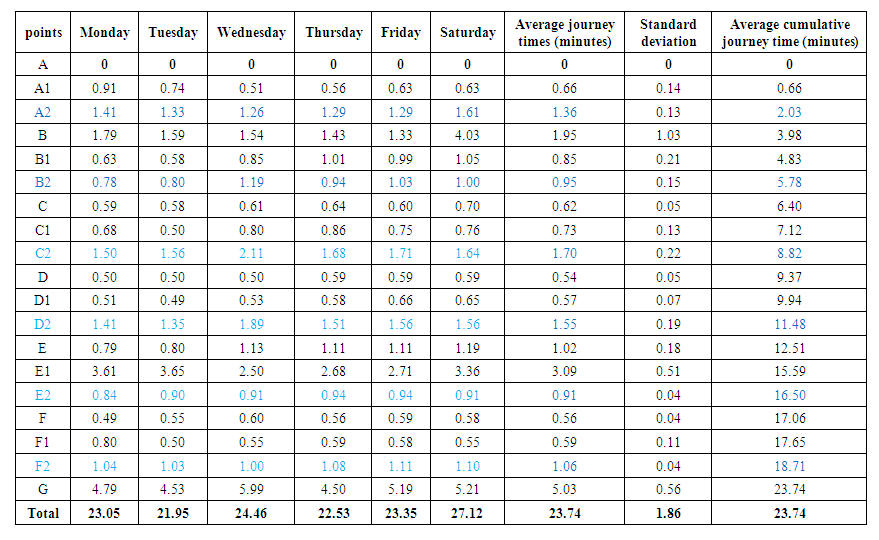 | Table A2. Average journey times (in minutes) for the time slot (12 p.m. to 4 p.m.) |
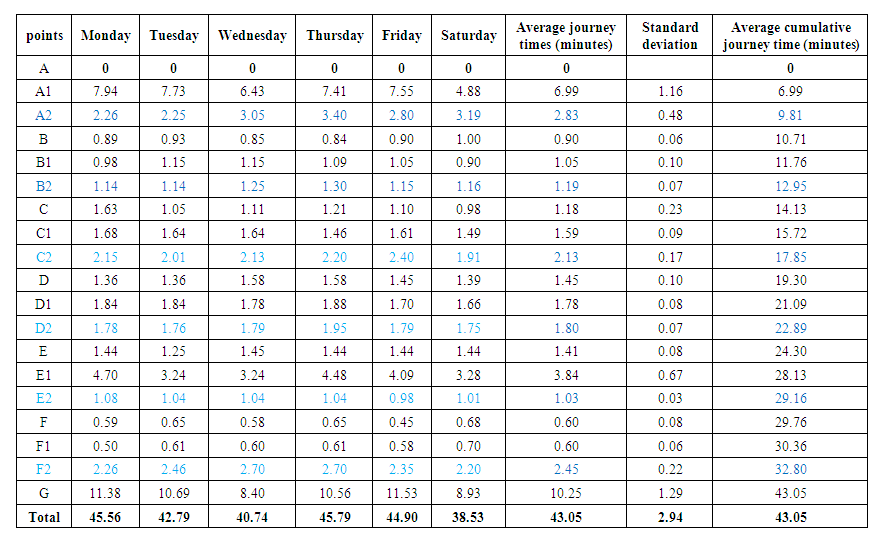 | Table A3. Average journey times (in minutes) for the time slot (4 p.m. to 8 p.m.) |
References
| [1] | Yang, J.-S. (2005), A study of travel time modeling via time series analysis, Proceedings of IEEE Conference on Control Applications CCA, 855-860 (2005). |
| [2] | United Nations, World urbanization prospects: The 2007 revision population database, United Nations New York (2008). |
| [3] | Njimanted, G. F., and Mobit, M. O., Determinants of Traffic Congestion in the Metropolis of Douala, Cameroon: An integrated approach. Journal of the Cameroon Academy of Sciences, 11(2 & 3), 209-222 (2013). |
| [4] | Reddy, B. S., and Balachandra, P., Urban mobility: A comparative analysis of megacities of India, Transport Policy, 21, 152-164 (2012). |
| [5] | Rao, A. M., and Rao, K. R., Measuring urban traffic congestion-a review, International Journal for Traffic and Transport Engineering, 2(4) (2012). |
| [6] | Ogunbodede, E., and Ogundare, B. A., Intra-Urban Parking Capacities and Parking Demands in Akure, Ondo State, European Environmental Sciences and Ecological Journal, 1(1), 1-10 (2014). |
| [7] | Khelafa, I., Ballouk, A., and Baghdad, A., Control du trafic urbain en temps réel. Colloque sur les Objets et systèmes Connectés (2019). |
| [8] | Anthony, D. Still Stuck in Traffic: Coping with Peak-Hour Traffic Congestion. Washington DC: The Brookings Institution. Press, P 472 (2004). |
| [9] | Essouman, O. S. E. Evaluation de la vulnérabilité sociale aux mouvements de masse: Cas des populations de la Commune de DOUALA 3e (Cameroun). Espace Géographique et Société Marocaine, 1(54). (2021). |
| [10] | Lomax, T., Turner, S., Shunk, G., Levinson, H., Pratt, R., Bay, P., and Douglas, G., Quantifying Congestion. Volume 2: User’s Guide. (1997). |
| [11] | D’Este, G. M., Zito, R., & Taylor, M. A. Using GPS to measure traffic system performance. Computer-Aided Civil and Infrastructure Engineering, 14(4), 255‑265 (1999).. |
| [12] | Hamad, K., and Kikuchi, S., Developing a measure of traffic congestion: Fuzzy inference approach. Transportation research record, 1802(1), 77,85 (2002). |
| [13] | Wiseman. Y., Intelligent transportation systems along with the covid-19 pandemic will significantly change the transportation market, The Open Transportation Journal. 15(1) (2021). |
| [14] | Tafti. M. F., A study on the merits for coordinated use of ramp metering and variable speed limit traffic control systems, The Open Transportation Journal. 12(1) (2018). |
| [15] | Fernandes. P.. & Nunes. U. , Platooning with IVC-enabled autonomous vehicles: Strategies to mitigate communication delays. improve safety and traffic flow. IEEE Transactions on Intelligent Transportation Systems. 13(1). 91-106 (2012). |
| [16] | Djoumessi. Y. F., The Adverse Impact of the Covid-19 on Labor Market in Cameroon, Afr. Dev. Rev. 1–14 (2021). |

 Abstract
 Reference
 Full-Text PDF
 Full-text HTML