-
Paper Information
- Paper Submission
-
Journal Information
- About This Journal
- Editorial Board
- Current Issue
- Archive
- Author Guidelines
- Contact Us
International Journal of Traffic and Transportation Engineering
p-ISSN: 2325-0062 e-ISSN: 2325-0070
2023; 12(1): 10-14
doi:10.5923/j.ijtte.20231201.03
Received: Mar. 30, 2023; Accepted: Apr. 22, 2023; Published: Apr. 23, 2023

Use of a Social Vulnerability Index in Investigating Transit Deserts in Alabama
 Abstract
 Reference
 Full-Text PDF
 Full-text HTML
Mehrnaz Doustmohammadi1, Eric Merschman1, Michael Anderson1, Sharareh Biglari2
1Civil and Environmental Engineering Department, University of Alabama in Huntsville, Huntsville, AL, USA
2Civil, Construction and Environmental Engineering Department, University of Alabama, Tuscaloosa, AL, USA
Correspondence to: Michael Anderson, Civil and Environmental Engineering Department, University of Alabama in Huntsville, Huntsville, AL, USA.
| Email: |  |
Copyright © 2023 The Author(s). Published by Scientific & Academic Publishing.
This work is licensed under the Creative Commons Attribution International License (CC BY).
http://creativecommons.org/licenses/by/4.0/

Accurately predicting the true demand of transit is one of the most challenging and crucial matters that various departments of transportation are attempting to solve. One of the tools for predicting the demand and creating the proper infrastructures and facilities, is using a social vulnerability index (SVI). This index is developed using the vulnerability demographics of old age, poverty, vehicle ownership, crowded housing, and disability. The value of estimating demand using social vulnerability is to attempt to focus on individuals who are more likely to rely on transit for their means of transportation, as such, socially vulnerable demographics which limit an individual’s ability to traverse the network may be used by a decision-maker when attempting to allocate resources or investment towards underrepresented areas. The index is then used to identify potential transit deserts or areas in which demand exists but has no transit service. In this study, the index uses U.S. Census data to identify the most vulnerable counties for the state of Alabama. The areas designated as most vulnerable are areas with historic economic deficiency and tend to be more rural counties. Future research is required however to relate transit ridership to the vulnerability attributes selected. To this end, cooperation with state transit agencies is required to have a more in-depth understanding of the results.
Keywords: Social Vulnerability Index, Transit Deserts, Demand Prediction
Cite this paper: Mehrnaz Doustmohammadi, Eric Merschman, Michael Anderson, Sharareh Biglari, Use of a Social Vulnerability Index in Investigating Transit Deserts in Alabama, International Journal of Traffic and Transportation Engineering, Vol. 12 No. 1, 2023, pp. 10-14. doi: 10.5923/j.ijtte.20231201.03.
Article Outline
1. Introduction
- The role of a transit agency is to connect passengers from their location of origin to their intended destination. While at first glance, this seems to be obvious, the machinations which allow the system to function and complete its objectives is quite complex. An agency must accurately predict transit needs and match appropriate capacity to this demand. Furthermore, without active feedback systems in place, the decision-maker has no avenue to validate whether their estimated demand reflects that of reality. This is especially difficult in areas which have unknown demand and no service. These areas are what is known as “transit deserts.”In order to estimate the demand for an area, a decision-maker must have some form of parameter or set of parameters to estimate the demand about. For example, if riders of certain demographics are overrepresented in transit ridership across a wide area, these demographics may be used to estimate demand. Economic theory would lead an agency to believe that a good or service, transit ridership in this case, is only consumed if and only if the perceived cost of acquiring the good or service is less than the utility an individual reaps by acquiring it [1]. As utility is a function of an individual and not static through time, estimation of utility for an individual as well as a group comes with some degree of uncertainty. Likewise, the demand for transit services is innately dependent on the utility of the good or service the transit system is connecting the individual to.Taylor, Miller [1] performed regression analyses for potential indicators of transit ridership for 265 urbanized areas throughout the United States, however the distinction between urban and rural environments was not explicitly stated and it is obvious that the generation of trips differs between urban and rural areas. Additionally, it is assumed that the systems analysed in the study were strictly fixed-route trips and did not separate mode of travel within the study.In small urban and rural areas, which encompasses most of the United States, a lack of dependable transportation can severely limit an individual's mobility and ability to interact with their community. Even though by land mass, rural areas are the majority, according to DESA [2], over half of the world’s population reside in urban areas and this trend continues to increase. However, in the United States, the cultural identity of personal vehicles providing freedom of mobility is creating an unsustainable trend of urban sprawl and without efforts to increase transit capacities, individuals with limited mobility may find themselves isolated from their communities.The purpose, then, of this study is to correlate existing transit trips and their ridership to create a demand function which may then be transferred to underrepresented areas. Unlike in urban areas, it is common for rural areas to rely on demand-response system over fixed-route systems due to the lack of predictability in origins and destinations for transit riders as well as the low population density.
2. Background
- While the concept of social vulnerability has been studied over the past decades, previous literature on the subject tend to use qualitative descriptive states to describe the populations under investigation. Using the context of natural disasters, Blaikie, Cannon [3] define social vulnerability as “the characteristics of a person or group and their situation that influence their capacity to anticipate, cope with, resist and recover from the impact of a natural hazard.” By expanding upon the definition, generalized social vulnerability may be described as the socioeconomic or demographic factors which inhibit an individual's or group’s ability to interact with or react to changes in their community [4]–[10]. Several institutions have developed social vulnerability indices in the past to attempt to describe vulnerability using community demographics such as the Human Development Index [11], The Disaster Risk Index [12], and the Environmental Sustainability Index [13]. The most commonly referenced social vulnerability index is the SoVI metric developed by Cutter, Boruff [14] which combines 30 socioeconomic variables in the context of environmental hazards. Similarly, Novak, Sullivan [15] used 15 variables to decide for economic disinvestment for transportation assets.Additionally, within the scope of transportation and transit needs, urban mobility has been investigated with respect to elderly communities, [16]–[18], quality [19], equity [20]–[22] sustainability [23], [24], and autonomous vehicles [25]. As previously mentioned, the needs of rural transit along with the objectives of rural agencies vary drastically from that of urban areas. As such, the need for determination of transit deserts for rural areas is needed.
3. Methodology & Case Study
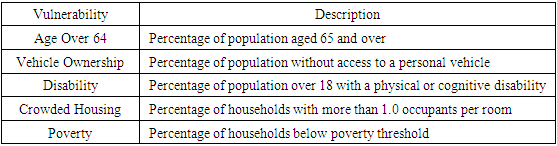
- The Alabama Department of Transportation (ALDOT) defines rural areas as “an area encompassing a population of less than fifty thousand people that has not been designated in the most recent decennial census as an ‘urbanized area’ by the secretary of Commerce” [26]. Within the state of Alabama, only 4.36% of the area is designated as urban under this definition leaving the other 95.64% as rural areas. The distinction as to what constitutes an “area” is unclear, but within the scope of this study, county level data is used to create a Social Vulnerability Index (SVI) to measure the extents to which the population of a county is vulnerable. The SVI is developed based on a combination of five demographics obtained through the U.S. Census using data from the 2019 American Community Survey’s 2019 5-year Estimates. Table 1 below describes the factors contributing to vulnerability.
|
3.1. Social Vulnerability Index
- The social vulnerability index developed for this study takes a multi-dimensional statistical approach to determine areas which may have concentrations of vulnerable populations. Equation 1 describes the development of the Social Vulnerability Index of a county, n, as
 | (1) |
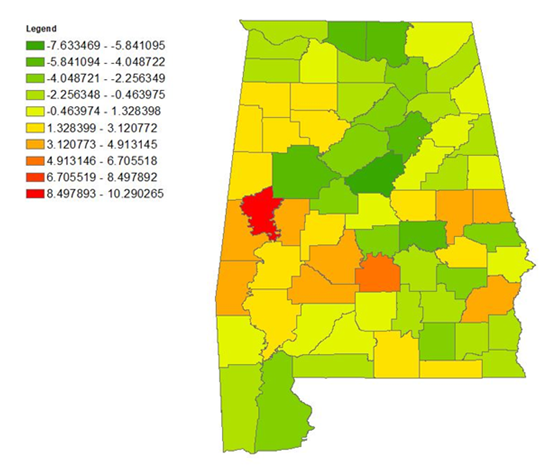 | Figure 1. Social Vulnerability of Counties in the State of Alabama |
 | Figure 2. Geographic Distribution of Vulnerabilities for a) Age 65 and over b) Disability c) Poverty d) No vehicle e) Crowded Housing |
4. Conclusions
- Management of transit agencies are not simple procedures and prediction of demand to be able to allocate adequate resources to meet that demand requires a robust framework in which to operate about. By looking at attributes which may contribute to reliance on transit systems, whether they are fixed-route or demand-response, is critical in ensuring that adequate supply is available.Within the state of Alabama, a large portion of counties across the state exhibit vulnerable populations, especially in rural and impoverished communities. The impoverished areas in the center of the state may be most reliant on transit systems as they represent the largest area without access to a vehicle and have the highest rates of poverty. This leads the authors to believe that not only structural systems must be in place to provide for this expected demand, but the internal policies must be accommodating for the needs of the ridership in ways of subsidized fares to lessen the economic burden of using the system. Further cooperation with transit agencies is required to verify the accuracy of the results found within this investigation and come to more in-depth conclusions.