-
Paper Information
- Paper Submission
-
Journal Information
- About This Journal
- Editorial Board
- Current Issue
- Archive
- Author Guidelines
- Contact Us
International Journal of Traffic and Transportation Engineering
p-ISSN: 2325-0062 e-ISSN: 2325-0070
2022; 11(1): 1-7
doi:10.5923/j.ijtte.20221101.01
Received: Dec. 29, 2021; Accepted: Jan. 24, 2022; Published: Jan. 27, 2022

Prediction of Road Accidents Trend in Tanzania Using ARIMA Model: The Road Safety Implication by 2021-2030
 Abstract
 Reference
 Full-Text PDF
 Full-text HTML
Vitalis Agati Ndume1, Edwin C. Rutalebwa1, Angela-Aida K. Runyoro2
1Dar Es Salaam Institute of Technology, Tanzania
2National Institute of Transport, Tanzania
Correspondence to: Vitalis Agati Ndume, Dar Es Salaam Institute of Technology, Tanzania.
| Email: |  |
Copyright © 2022 The Author(s). Published by Scientific & Academic Publishing.
This work is licensed under the Creative Commons Attribution International License (CC BY).
http://creativecommons.org/licenses/by/4.0/

The purpose of this study is to predict the road accidents and justify whether Tanzania can reach the target of the global Second Decade of Action for Road Safety 2021-2030 calls. The study applied time-series modeling to determine and predict road traffic accidents patterns in the selected regions in Tanzania. Regions selection was based on those with the high rate of accidents. The secondary data obtained from Tanzania Road Safety Squad were used in analysis. Data were then loaded on R- packages for analysis. A time-series analysis using ARIMA Model was conducted to characterize and predict the frequency of road traffic accidents that lead to injury. The traffic accidents were categorized into four separate groups; these are accidents related to the car driver's behavior, motorcyclists, bicyclists and pedestrian. ARIMA model was used to model time series in each group from 2013 to 2021 and to predict the accidents up to 10 years later (2030). The analysis was carried out using R-4.1.1 statistical software package. The main contribution of our study in the field of road safety is estimation of number of death that can occur due to road accidents by 2030 which is estimated to decrease by 97%.
Keywords: ARIMA Model, Road accidents, Time series, Driving error, Overtaking, Pedestrian accident
Cite this paper: Vitalis Agati Ndume, Edwin C. Rutalebwa, Angela-Aida K. Runyoro, Prediction of Road Accidents Trend in Tanzania Using ARIMA Model: The Road Safety Implication by 2021-2030, International Journal of Traffic and Transportation Engineering, Vol. 11 No. 1, 2022, pp. 1-7. doi: 10.5923/j.ijtte.20221101.01.
Article Outline
1. Introduction
- The road traffic accident system can be considered to consist of essentially two predominant engineering sections, these are the roads and its environment and the vehicle including its contents but excluding driver; and two predominant human systems including driver on one side and pedestrian or form animal on the other side (Abdulhafedh, A. 2017). A road traffic accident therefore is a type of failure of one object when interacting with another object on the transportation protocol.Traffic accidents’ modeling is an aspect that requires deeper analysis and innovation to predict and if possible prevent the roads accident. A wide range of statistical approaches to traffic accident modeling are available. Abdulhafedh, A. (2017) provide a general overview of these models. The statistical modeling approach are meaningful for identifying most critical factors and association among the parameters for road accident but lack forecasting results of the factors contributing to the roads accidents (Kumar & Toshniwal, 2016; Meißner & Rieck, 2021). Another widely used approach is the data mining approach. This study focus on using mathematical structure of ARIMA model in predicting the road accidents in Tanzania for the next 10 years from 2021 and it uses more than 8-years’ time series data in prediction. The ARIMA models have been used extensively in modeling traffic accidents data based on time series framework (Avuglah, R. K. etal., 2014)).Time Series Modeling (TSM) is a method which deals with time dependent data. In this method data depends on the series of times where time refers to year, month, quarters, days, hours, minutes or seconds. The interest of TSM in this study is to predict the future of road accident in Tanzania by year 2030. This is in relation to the recent UN announcement of the 2nd Decade of action for road safety which call for each country member to half the road accidents and injuries by 2030 (Peden & Sminkey, 2004). According to (ERIC, 2019) the time series data is collected at different points in time. This is opposed to cross-sectional data which observes individuals, companies, etc. at a single point in time. Since such data points in time series are collected at adjacent time periods there is a potential for correlation between observations.
2. Study Methods and Material
2.1. Study Design
- The data was obtained from accident data repository of Tanzania and was proof checked by the division of Tanzania Road Safety Squad. A consent letter was approved and submitted to the Tanzania road safety squad with the title “research on road safety program in Tanzania the framework of IRAP”.The accidents data are collected as the event of road accident occurs and they are accumulated for some months before submission to the regional office for compilation. Each region is responsible for the data quality, and finally the data are submitted to the central head quarter for national reporting. A purposeful data gathering approach was meaning for this study. Either vast data was required for modeling.
2.2. Structure of the Region for Reporting Road Accidents
- The region report for road accidents in Tanzania does not follow the government physical division of the regions. The ministry of Home Affairs divided Dar es Salaam region in three (3) divisions i.e. Ilala, Temeke and Kinondoni therefore the road accident data are compiled for the divisions and not as a single region of Dar es Salaam.
2.3. Data Analysis
- The time-series analysis models were applied to model the observed frequency of accidents in the study regions and to predict the future accidents. According to (Abdulhafedh, 2017; Harris, 2013) the Autoregressive Integrated Moving Average (ARIMA) model formulation is appropriate in our study data since it’s the best model used to model the time series. For this study the yearly total frequencies time series were used. As explained by (Avuglah & Harris, 2014) the ARIMA model was expressed by ARIMA (p, d, q), where the p, d, and q represented the number of autoregressive, differences, and moving average parameters, respectivelyThe ARIMA (p,d,q) equation is given by
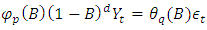 | (1) |
 and
and  is the Box-Jenkins operator given by
  for an integer
  The constants
  are autoregressive parameters to be estimated and
  are the moving average parameters to be estimated. The variables
  are a series of observed time series and
  are a series of unknown random errors (or residuals) that are assumed to follow a normal distribution. This model is applicable for a non-seasonal time series. For a seasonal time series, a modified model called SARIMA is appropriate.Implementation of the Box-Jenkins methodology (in this case ARIMA) in practice, which most statistical software packages will perform, includes:1. Model Identification: Using plots of the data, autocorrelations, partial autocorrelations, and other information, a class of simple ARIMA models is selected. This amounts to estimating (or guesstimating) an appropriate value for d followed by estimates for p and q. 2. Model Estimation: The autoregressive and moving average parameters are found via an optimization method like maximum likelihood.3. Diagnostic Checking: The fitted model is checked for inadequacies by studying the autocorrelations of the residual series (i.e., the time-ordered residuals).Note that purpose of the differencing in equation (1) is to remove the trend and seasonal components in the series so that the resulting series is stationary. It does not model the trend in the series. The aim of this study is also to describe the trend and seasonal patterns of the road accidents. In order to model the trend and seasonal patterns, the time series is decomposed in to three components (assuming that the series has additive property): Trend, seasonal and stationary components:
 | (2) |
 and2) The second stage is to calculate the residual series
  which should be stationary, and model its short-term correlation using a time series model (in our case ARIMA model).There are many methods for modeling trend and seasonal variation in a time series, and three of the most common ones are regression, moving average and differencing. In this study a regression method is used. The idea is to represent the trend and seasonal variation as
 | (3) |
 are known covariates and
  are the unknown regression parameters. For a time, series with linear trend and with no seasonal component, equation (3) becomes
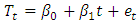 | (4) |
 are residuals and
  is a vector of index of data points. For instance, if the time series involves 100 years of annual records,
3. Results and Discussion
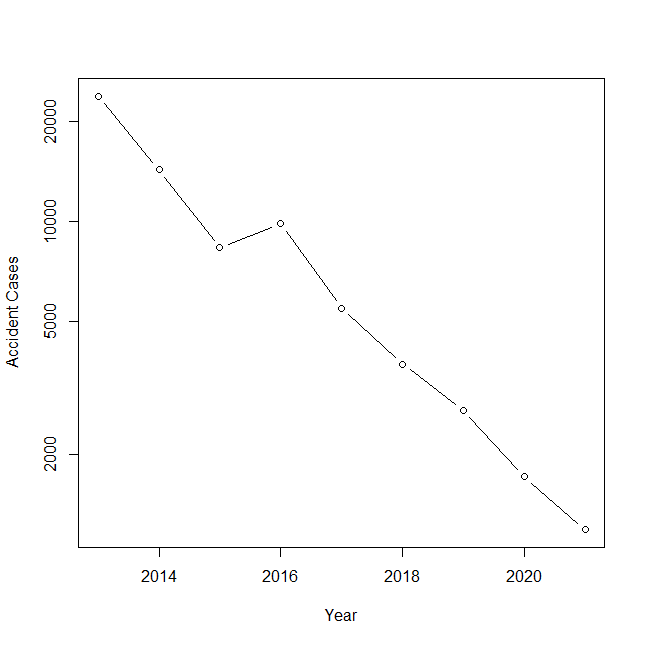
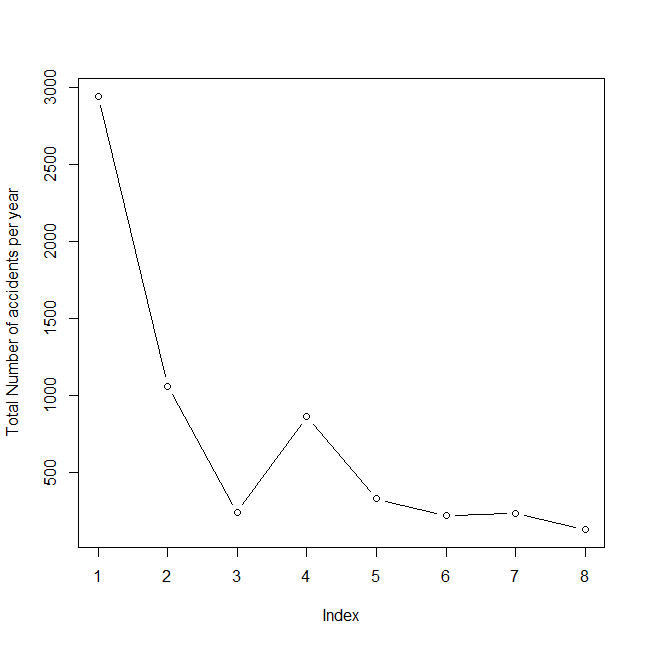
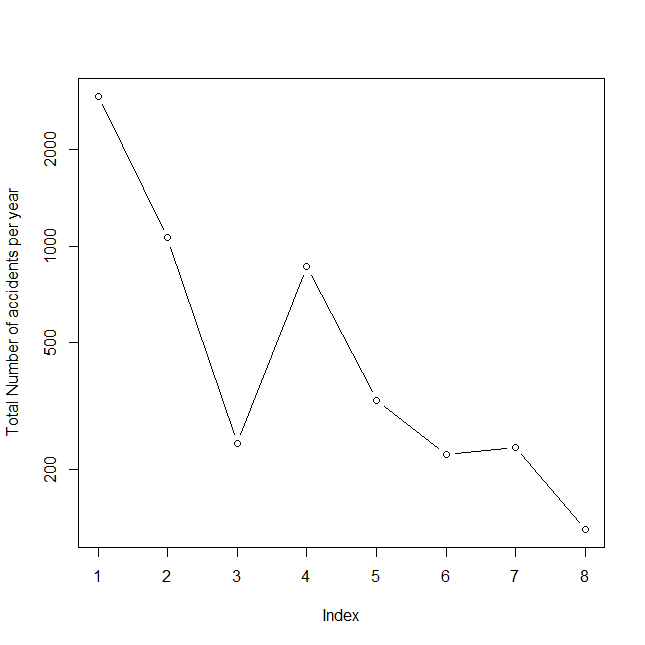
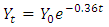
- Over the 9 years’ observation (from 2013 to 2021), a total of 70039 road traffic accidents were reported. The time plot is given in Figure 1. The time plot exhibits a systematic change, therefore giving evidence of trend in the data. Moreover, the trend shows an exponential decay. This is reviled on Figure 2 when the accident cases are plotted on a logarithmic scale. Therefore we will be working with transformed data as
 so that equation (4) becomes
 | (5) |
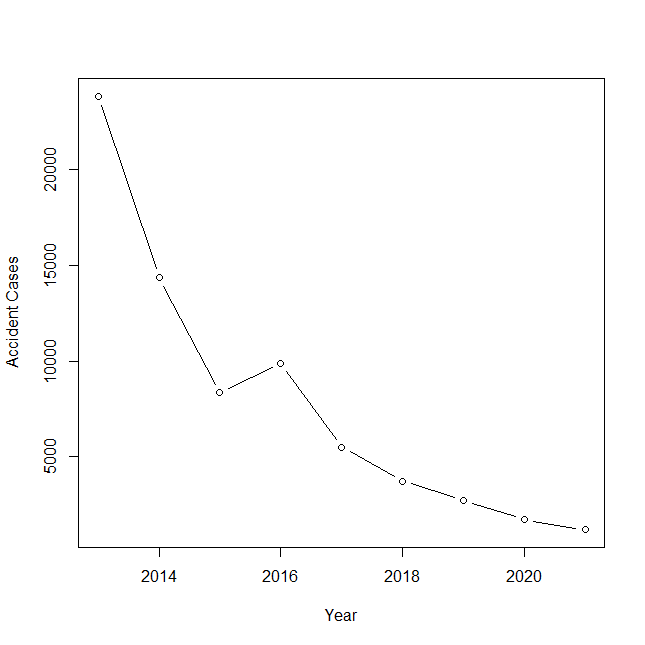 | Figure 1. Time plot of accident cases in Tanzania from 2013 to 2021 with accident cases on a linear scale |
 | Figure 2. Time plot of accident cases in Tanzania from 2013 to 2021 with accident cases on a logarithmic scale |
 | (6) |
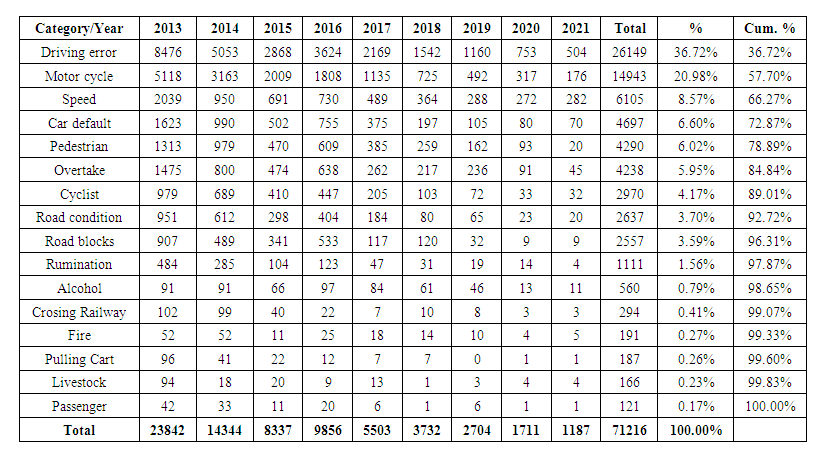 | Table 1. Number of accidents per year for each category |
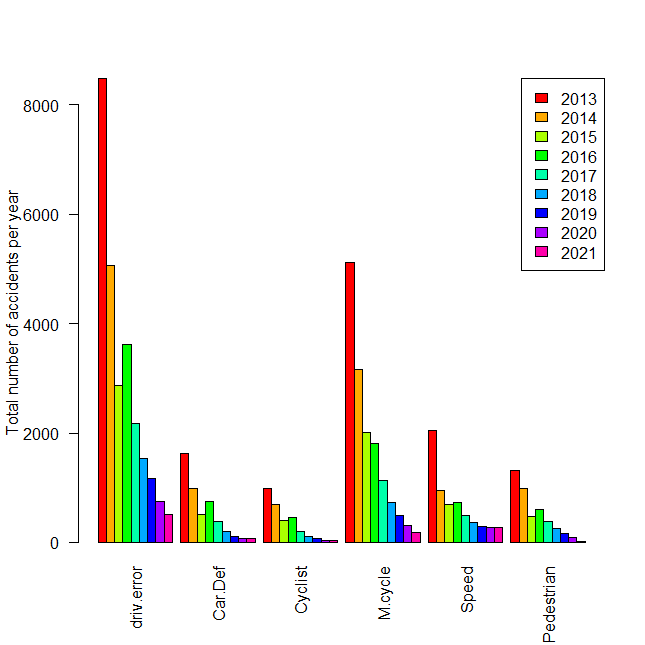 | Figure 3. Total number of accidents per year for each category for the year 2013 to 2021 |
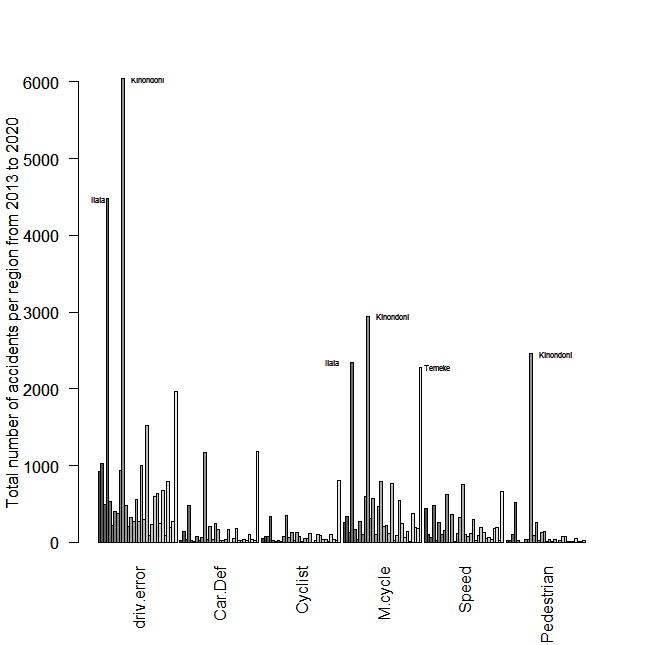 | Figure 4. Total number of accidents per region from year 2013 to 2021 |
 . Figure 5 depict the raw data for driving negligence variable for the case of Kindononi region plotted on the linear scale and Figure 6 corresponds to same case plotted on the logarithmic scale. The empirical regression equation for this case is given by equation (7).
 | (7) |
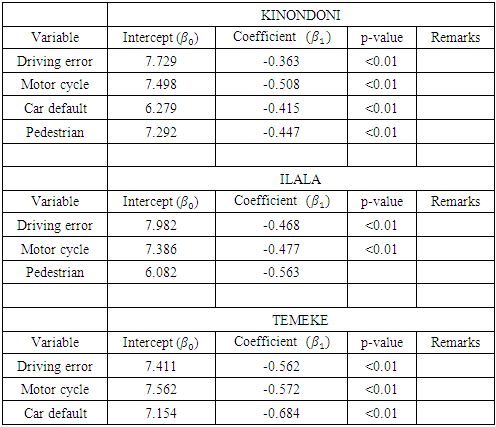
 ) accidents per year. Those due to motorcycle are reducing at rate 0.508, car default is reducing at the rate of 0.415 and pedestrian are reducing at rate of 0.447. The 95% confidence interval of this estimate of decreasing rate is (0.142, 0.585) and the p-value of this rate is less than 0.01, showing that the estimated value is significant at 1% level. The regression model for data from Ilala shows that driver error is reducing exponentially at rate of 0.468 a bit higher than those of Kinondoni while Motor cycle decrease at rate of 0.477.
|
 | Figure 5. Total number of accidents per year for the category of driving negligence in the Kinondoni region, in Dar es Salaam with accident cases plotted on a linear scale |
 | Figure 6. Total number of accidents per year for the category of driving negligence in the Kinondoni region, in Dar es Salaam with accident cases plotted on a logarithmic scale |
 The autocorrelation function (ACF) plot and partial autocorrelation function (PACF) plots (see Figure 7) suggest ARIMA (0,d,0) model. Using "auto.arima" function in R-package, the fitted model is ARIMA (0,1,0). This model is used for forecasting. The forecasted logarithm of the number of accidents for the next nine (9) year is shown in Figure 8. The ARIMA (0,1,0) entails that the annual numbers of traffic accidents in Tanzania can be model using trend component only in equation (2). The trend component for the transformed data is given by equation (6). Transforming equation (6) back to the original scale we have
  | (8) |
 These time steps could be months, years or weekly. In this study the annual number of accidents are used, hence
  are time steps in year. Figure 9 depict the actual time series and the estimated time series of the number of traffic accidents in Tanzania for the period 2013 to 2021.
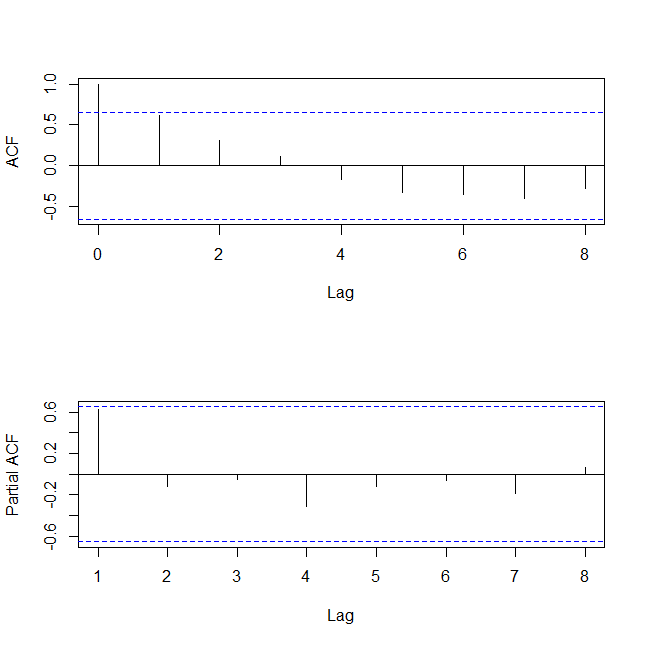 | Figure 7. Autocorrelation function (above panel) and partial autocorrelation (below panel) of a transformed number of accidents series |
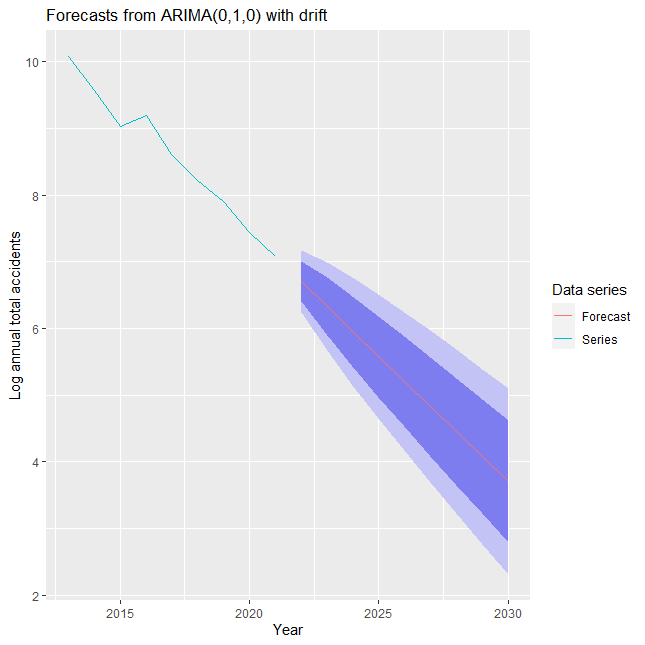 | Figure 8. ARIMA(0,1,0) Forecasting plotting |
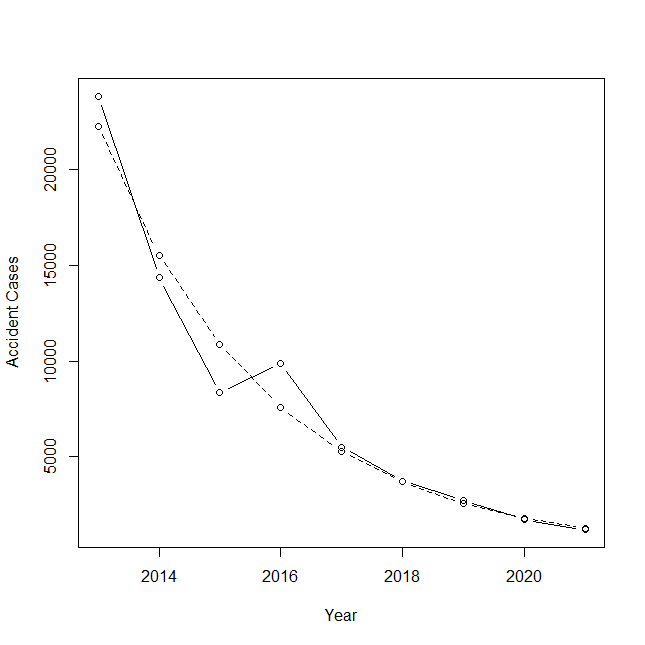 | Figure 9. Time series (solid line) and estimated time series (dashed line) of the number of traffic road accidents in Tanzania for the period 2013 to 2021 |
 | (9) |
 is the number of accidents for reference year.Equation (8) or (9) can be used to predict the number of traffic accidents in the coming year, setting t = 1 at the year 2013 or any referencing year (say 2020) and
  is equal to number accidents recorded in the reference year (1711). For instance, the expected number of traffic accidents in year 2030 is obtained by setting t = 10 in equation (9) with
  = 1711, which gives an estimate of 47 (97% decrease) number of traffic road accidents. Figure 10 depict the number of traffic road accident series (solid line) and the forecasted (dashed line) for the period from 2013 to 2021 and from 2022 to 2030 respectively. From figure 8 it is obvious that the precision of prediction decrease as you the time increase. We observe good prediction between 2020 and 2025 and more discrepancy from 2025 to 230.
 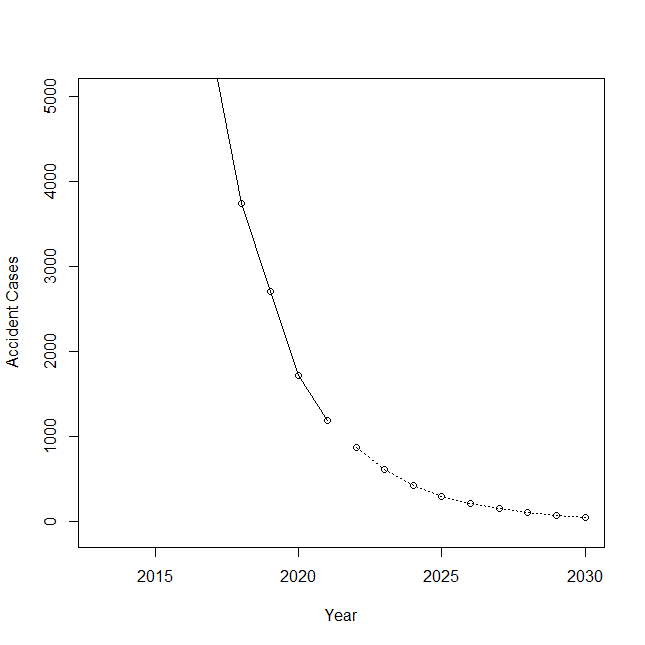 | Figure 10. Time series (solid line) and forecasted time series (dashed line) of the number of traffic road accidents in Tanzania for the period 2013 to 2021 and the period 2022 to 2030 respectively |
4. Conclusions and Recommendations
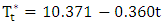
- The ARIMA model was successfully implemented in forecasting the general trends of road accidents in Tanzania. It has been successfully adopted in analysis of road accident data category especially in predict number of accidents by 2030. Our findings lead to a conclusion that road accidents are decreasing exponentially at a rate of 0.360 per year. It is forecasted that the number of the road accidents can decrease to 47 (97%) by 2030 which is above the preset target of 50%. The findings also conclude that with the annual number of road traffic accidents, the time series does not have significant seasonality and moving average components. Furthermore, even though road engineering design (Road condition) category of accident remains moderate it is claimed to be the source of other accident categories. Intervention on major three categories of causal for road accidents including driver error, motorcyclist and driving speed must be paid attention and given more priority. We propose further study on modeling and prediction of impact of road design and road asset planning in determining traffic flow based on the increasing number of cars on road traffic. Other more studies can be conducted on traffic congestion simulation in relation to pedestrian characterization and its impact on national economy.
ACKNOWLEDGEMENTS
- We acknowledge the department of Road Safety Squad in allowing and providing such data for this study. We extend our acknowledgement to Dar es Salam Institute of Technology for supporting fund for publication ofthis result.
Declaration
- Until the time of submitting this job we declared no conflict of interest in our work.