Mubiru Joel 1, Angurini Manaseh 2, Kirabo Enock 1, Nandugwa Harriet 1
1Department of Civil and Building Engineering, Kyambogo University, Kampala, Uganda
2Department of Road Development, Uganda National Roads Authority, Kampala, Uganda
Correspondence to: Mubiru Joel , Department of Civil and Building Engineering, Kyambogo University, Kampala, Uganda.
| Email: |  |
Copyright © 2021 The Author(s). Published by Scientific & Academic Publishing.
This work is licensed under the Creative Commons Attribution International License (CC BY).
http://creativecommons.org/licenses/by/4.0/

Abstract
Road traffic noise is one of the environmental pollutants that people in Uganda tend to ignore. This maybe because they tend to grow fond of it as a result of its continuous prevalence. Some even go to the extent of purchasing plots of land in close proximity to highways and other roads for residential purposes for ease of access to the Central Business District. This paper however, entails an assessment of road traffic noise particularly in the Greater Kampala Metropolitan Area and its impacts to the people settling or working in close proximity to the road network. It shows the main impacts of the traffic noise according to respondents’ questionnaire surveys, the greatest of which was found to be sleep disturbance (with over 40% of the respondents in concurrence). The magnitude to which the prevailing traffic noise exceeded the noise criteria in Uganda was undertaken by carrying out noise measurement procedures using the sound level metre which gave results between 19-33dB (A) in excess of the criteria. Its root causes and the factors affecting the road traffic noise are exhaustively brought to light in this document. This gives rise to how best this menace can be wiped off the face of Uganda by proposing effective mitigation measures through the design of suitable noise barriers and introduction of autonomous vehicles. This only means that the government of Uganda should take the issue of traffic as a serious one and should not be left out in urban planning. However, this can only happen after traffic noise is fully assessed hence the reason for this documentation.
Keywords:
Road Traffic Noise, Sound level, Noise abatement, Kampala Metropolitan
Cite this paper: Mubiru Joel , Angurini Manaseh , Kirabo Enock , Nandugwa Harriet , Assessment of Road Traffic Noise in the Greater Kampala Metropolitan Area, Case Study of Namulanda-Kisubi Stretch, Entebbe Road, International Journal of Traffic and Transportation Engineering, Vol. 10 No. 2, 2021, pp. 25-36. doi: 10.5923/j.ijtte.20211002.01.
1. Introduction
Transport in Uganda is a principal driver of economic growth and the demand for transport increases with population growth. Road transport remains the most dominant form of transport, carrying over 90% of the Country’s goods traffic and 99% of passenger traffic [10]. Road traffic has continued to grow rapidly in recent years, especially in the Greater Kampala Metropolitan Area with the current average national vehicle population growth of about 15%. There has also been increased intensity in influx of migrant job-seekers which has brought about an annual population growth of 5.6% [13]. The increase in the human population hence consequently requires more traffic volumes to transport people from place to place for different businesses and also to deliver goods, services and energy to the ever increasing population [12]. The increase in vehicular traffic volumes directly increases a substantial amount of gas consumption especially when driving at high speeds for vehicles accelerating extensively and braking unnecessarily [14] subsequently causing traffic noise that has negative health effects, a significant issue to the environmental management of the Country. Transportation noise in the area is not solely generated by land transportation. Entebbe International Airport also generates significant levels of noise in populated areas like Ssazi [15].In EU member states, according to the World Health Organisation, a study in Germany showed that each year traffic noise causes 1,629 non-fatal heart attacks. In the city of Berlin, 1.1% of all myocardial infarctions are attributable to road traffic noise [2]. A study carried out in Greater London indicated that up to 108 heart attacks and nearly 500 cases of heart disease are directly as a result of prolonged exposure to high levels of road traffic noise [2]. Another study from Denmark showed that increased risk of stroke is greatly influenced by road traffic noise. Specifically, it showed that exposure to residential road traffic noise increases the risk of stroke among people over 64 years of age. In fact, Francesco Cappuccio, a professor of cardiovascular medicine at the University of Warwick, told Britain's Science Media Centre, “Public-health policies must pay more attention to this emerging evidence.” Unfortunately, in Uganda there’s either scanty research that has been made about traffic noise or it may be there but not published however adverse its effects may be. All this necessitates an assessment and the Government of Uganda investment into traffic noise situation in Uganda because most people may be dying or adversely affected health wise by traffic noise unknowingly. This research was therefore carried out basing on the above background to assess the current traffic noise level in the study area and compare it with the Ugandan permissible noise levels, the potential impacts of the traffic noise and propose measures for mitigation of traffic noise pollution.
2. Materials and Methods
2.1. Study Area
Sensitive receptors like schools, hospitals, kid’s care centers and dwellings along Entebbe road were identified. This was achieved through questionnaires and interview guides. The questionnaires were addressed to occupants in the receptor rooms whose facades were closest to the road hence more susceptible to traffic noise impacts. In Kisubi High School (0.16°N, 32.55°E), the rooms with the closest facades to the road were a senior two classroom block and a senior three dormitory. Questionnaires were used to obtain information from all the students of the classroom block (40) and all students sleeping in the senior three dormitory (45). From Mirembe Kid’s Care Centre (0.15°N, 32.55°E), the survey was purposive and the questionnaires were assigned to all the (6) caretakers and teachers of the kids that were present. At CoRSU Hospital (0.13°N, 32.54°E), the room with the closest façade to the road was an emergency room and the nurses to the patients were given the questionnaires to obtain the required information. Nurses (8) taking care of 15 patients were each given questionnaires to fill. For the ten Residential Houses; residential house 1; (0.13°N, 32.54°E), residential houses 2 and 3 (0.13°N, 32.55°E), residential houses 4, 5, 6 and 7 (0.16°N, 32.53°E), residential houses 8, 9 and 10 (0.15°N, 32.53°E), an average of (5) people per household from each were assigned questionnaires to obtain information about the residents.
2.2. Noise Exposure Assessment
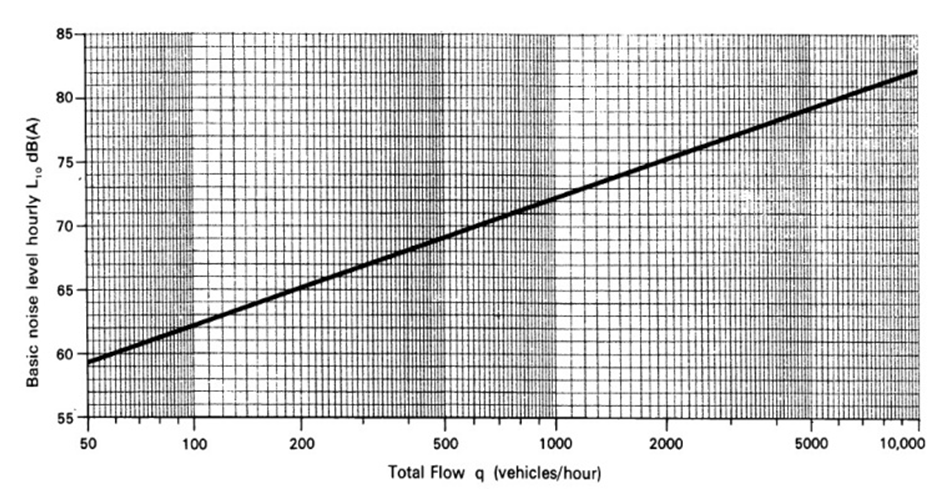
Because of limitation of time and cost, the traffic noise (Leq) exposed to the rest of the places in the study area within 25 metres either side from the roadway by the traffic flow q was approximated using Figure 1. Four environmental noise indices were used to assess road traffic noise LA10, LAeq, LA90 and LAmax.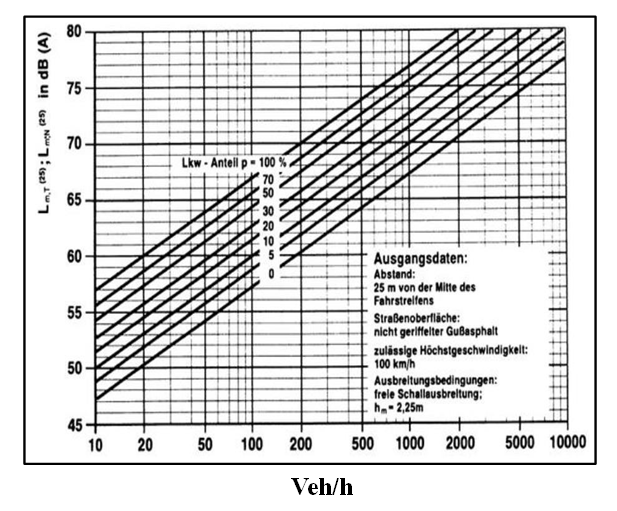 | Figure 1. Leq estimation chart [1] |
LA10 level is the noise level exceeded for 10% of any period typically 60 minutes. LAeq level is the equivalent energy level that is constant over a period of time that contains the same amount of sound energy as the varying levels of the road traffic noise. LA90 level is the noise level exceeded for 90% of a period which is also regarded as a representative of background noise level. LAmax level is the maximum noise level generated from a single noise event.
2.3. Traffic Data
Manual traffic count was done to determine whether a correction was to be made on the traffic noise levels obtained or not. The aim was to determine the number of vehicles using the roadway per hour. It was done for one hour; counting the number of vehicles for every 15 minutes. The total number of vehicles obtained for each of the four quarters in an hour were compared and the one having the highest number of vehicles was selected as the representative and the number of vehicles in that interval was multiplied by 4 to obtain the total number of vehicular traffic in one hour (veh/hr). The traffic count sheet was divided into three major categories for automobiles, medium trucks and heavy trucks. The contribution of each of the automobiles, medium trucks and heavy trucks to the traffic noise level (Leq(A)) was then obtained.The average speed measurements were also carried out using a stop-watch to record time of travel between two end points of the section of the road under survey.
2.4. Traffic Noise Measurement
In noise sensitive receptor areas, sites for measurement were selected to cover the range of traffic noise conditions encountered in the area of interest. Since only levels of road traffic noise were of importance, locations with significant sources of noise other than road traffic were avoided to prevent their contribution to the measured noise level [6]. Before the sound level meter was used, it was set to A-weighted frequency response (perceivable by the human ear) and fast time response. The microphone of the sound level metre was then placed at a distance of 1.0 metre from the façade of the building in order not to capture the sound reflected by the wall of the façade (which could cause a noise error of > 6dB) and 1.2 metres from the ground or from the floor level of the veranda where it was present in order to capture the sound that enter through openings such as windows. The noise level was recorded every interval of 30 seconds for a period of 15 minutes [9] at each of the four stations. Thirty (30) readings (Leq) of A-weighted noise level, dB(A) were measured and recorded in the 15 minutes for each station. During measurement, the sound metre was left to run continuously to prevent missing out of any traffic noise reading.From the traffic noise measurement, the traffic noise values were classified in different class widths and the data grouped and an Ogive was drawn for each receptor to obtain values of L10, L50 and L90 which were then used to calculate Leq using equation (1).  | (1) |
The Traffic Noise Index (TNI) was calculated from equation (2) below and a correlation was established between traffic noise levels and the corresponding traffic volumes. | (2) |
The contribution of each of the vehicles to the Leq was then calculated from the following equations;  | (3) |
 | (4) |
 | (5) |
Where; S- Medium speed in mph V- Respective traffic flow for each of the traffic types D- Distance in feet from source to observer (assuming 25m = 83 feet)
3. Results and Discussions
3.1. Questionnaire Survey
Question one: Are you bothered by noise from road traffic? 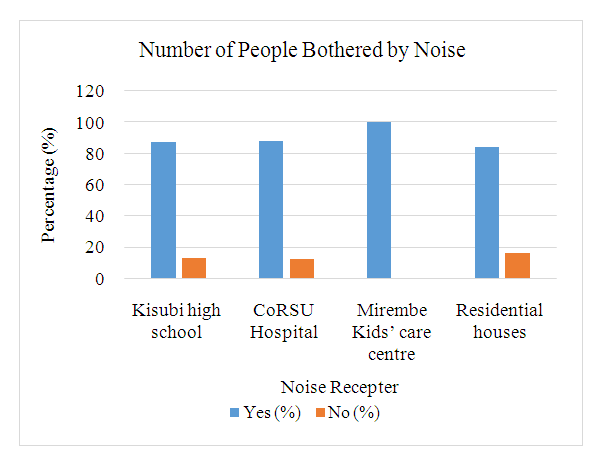 | Figure 2. Percentage of Respondents Vs Noise Receptors |
Question two: Which of the following parameters bothers you most due to road traffic noise? 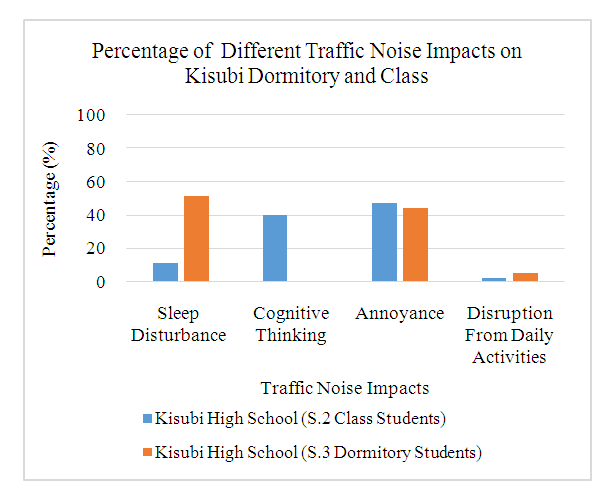 | Figure 3. Percentage of Respondents in Kisubi High School Vs Traffic Noise Impacts |
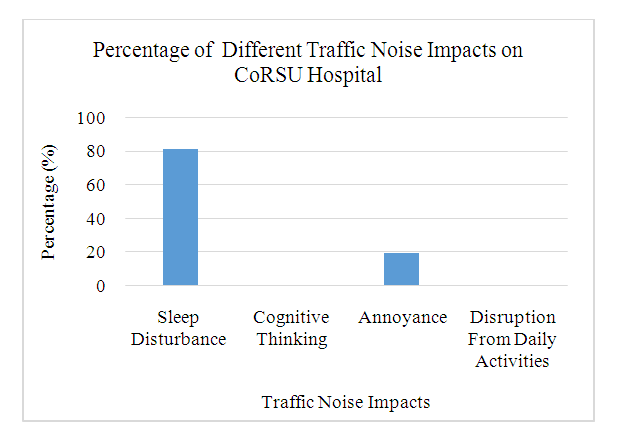 | Figure 4. Percentage of Respondents in CoRSU Hospital Vs Traffic Noise Impacts |
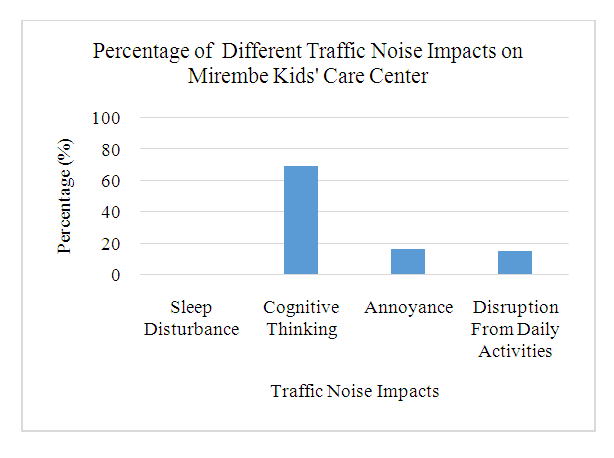 | Figure 5. Percentage of Respondents in Mirembe Kids’ Care Centre Vs Traffic Noise Impacts |
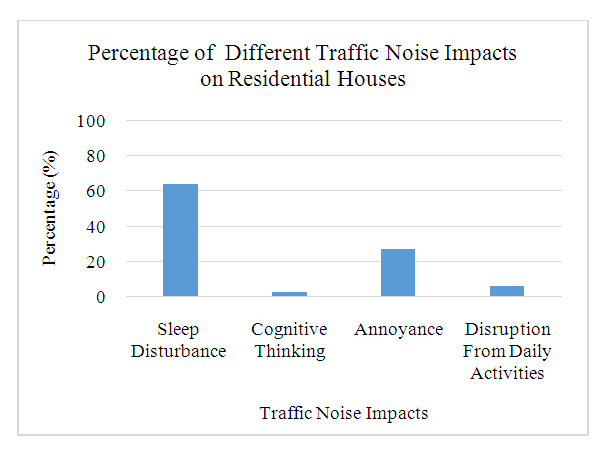 | Figure 6. Percentage of Respondents in the Residential Houses Vs Traffic Noise Impacts |
3.2. Noise Levels
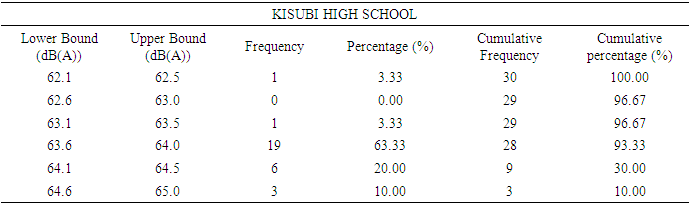
 | Figure 7. Cumulative Percentage Vs Upper Bound Traffic Noise Levels for Kisubi High School |
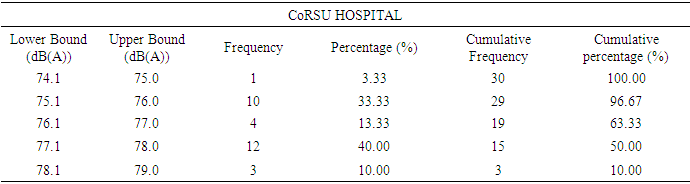
L90 = 64.0dB, L50 = 64.4dB, L10 = 65.0dB. From (1), Leq = 64.4dB, From (2), TNI = 38dB.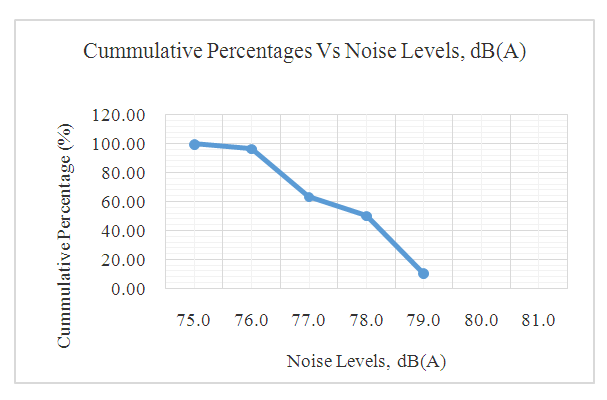 | Figure 8. Cumulative Percentage Vs Upper Bound Traffic Noise Levels for CoRSU Hospital |
L90 = 76.2dB, L50 = 78.0dB, L10 = 79dB. From (1), Leq = 78.1dB, From (2), TNI = 57.4dB.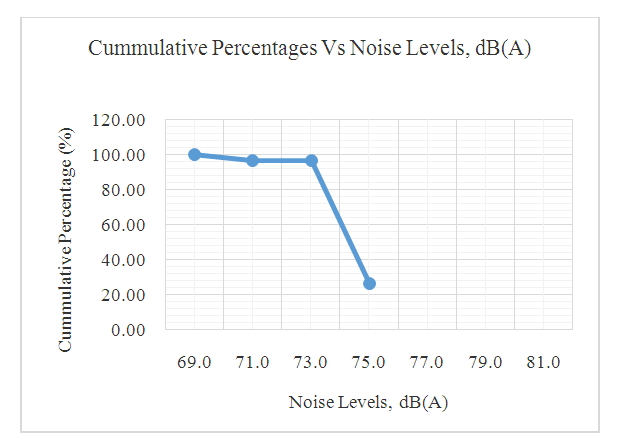 | Figure 9. Cumulative Percentage Vs Upper Bound Traffic Noise Levels for Residential Houses |
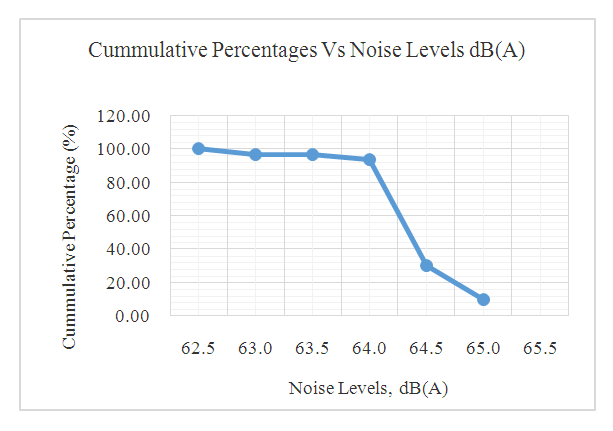
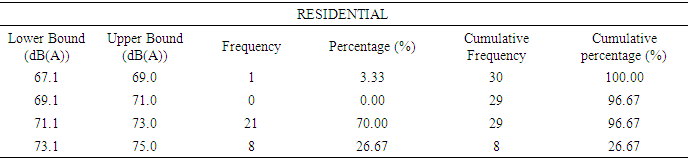
L90 = 73.1dB, L50 = 74.4dB, Using linear interpolation, L10 = 73-((96.67-10) (73-75)/(96.67-26.67)) = 75.5dB. From (1), Leq = 74.4dB, From (2), TNI = 52.7dB. 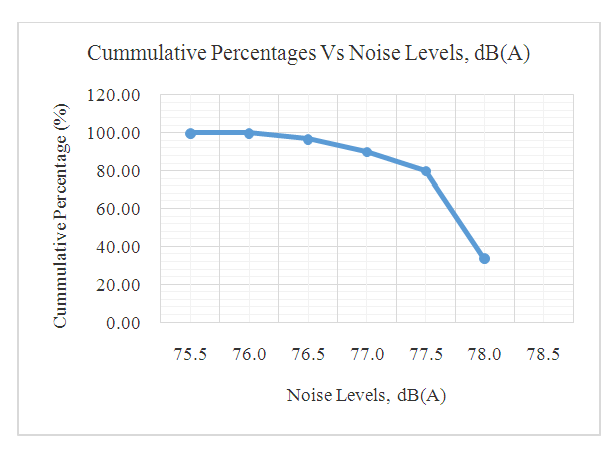 | Figure 10. Cumulative Percentage Vs Upper Bound Traffic Noise Levels for Mirembe Kids’ Care Center |
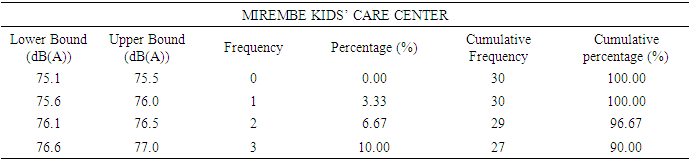
L90 = 77.0dB, L50 = 77.8dB, Using linear interpolation, L10 = 77.5- ((80-10) (77.5-78)/ (80-33.33)) = 78.2Db. From (1), Leq = 77.8 dB, From (2), TNI = 51.8 dB.
3.3. Calculation of Leq, LNight and L10 for the Rest of the Study Area
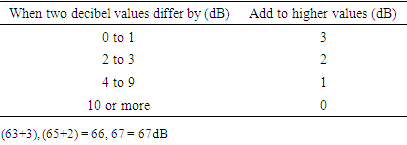
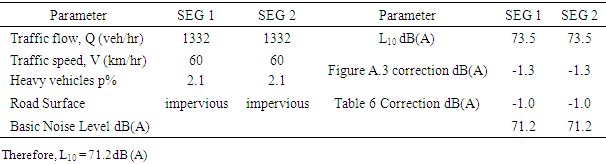
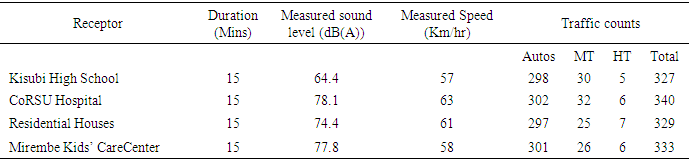
Taking the 15-minute interval with the highest traffic from Table A.6, the total traffic = 340 x 4 = 1360 veh/hr, p, the percentage of heavy trucks = 100(7 x 4)/1360 = 2.1%. From Figure 1, taking M as 1360 veh/hr and p = 2.1%, the estimated noise level, Leq for the rest of the areas in the study area = 69.0dB. Referring to Table A.6 to obtain the largest number of veh/hr for each vehicles category and the medium (average) speed; For Automobile = 302 x 4 = 1208 veh/hr, Medim trucks = 32 x 4 = 128 veh/hr, Heavy trucks = 7 x 4 = 28 veh/hr. Medium speed = (57+63+61+58)/4 = 60km/hr.Substituting the respective values of S, V and D in each of the equations (3), (4) and (5) of each vehicle category contribution to Leq, the following was obtained:Automobiles, Leq = 63dB Med trucks, Leq = 63dB Heavy trucks, Leq = 65dB The portions were then added to check whether the total matched with the calculated Leq from the Figure 1. Using the following guidelines, Table 1. Decibel Addition Approximation [9]
 |
| |
|
The addition is less than the value from Figure 1, therefore take Leq = 69dB. The estimated traffic noise from 10pm – 6am, LNight can be obtained from the following equation: 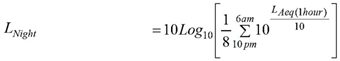 | (6) |
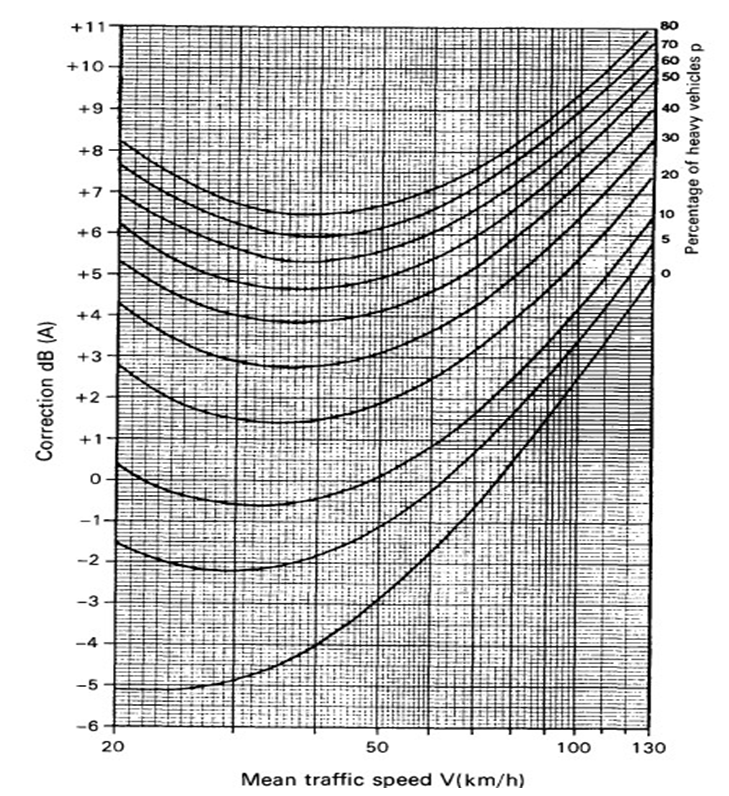
Substituting Leq = 69dB obtained above in (6) gives LNight = 69dB. From Figure A.1, taking q as (1360-28) = 1332 veh/hr, L10 = 73.5dB. Table 2. L10 Adjustment Due to V, p and Road Surface Using Figure A.2
 |
| |
|
3.4. Sound Barrier Design
3.4.1. Kisubi High School
From surveying, the horizontal distance between the edge of the road and the school’s façade was 53 metres and the existing wall fence was 48 metres from the façade, assuming the half width of the road is 3.5 metres.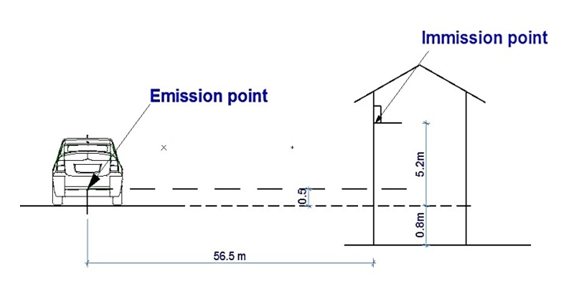 | Figure 11. Location of Emission and Immision Points for Kisubi High School |
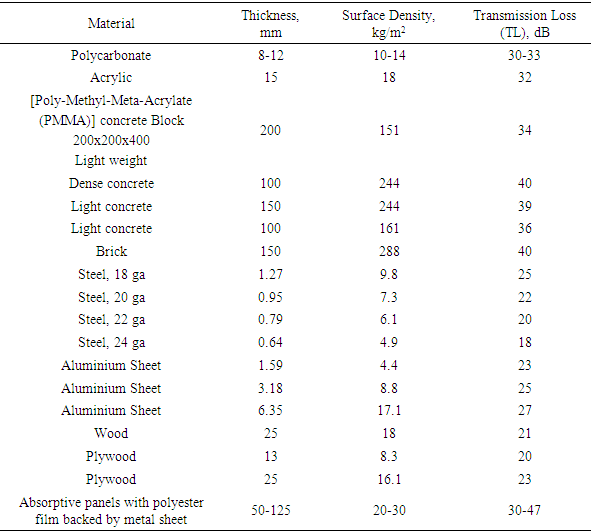
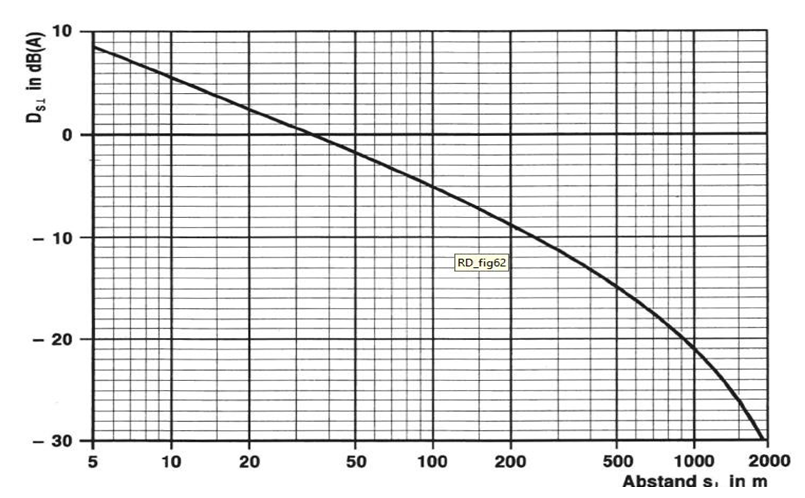
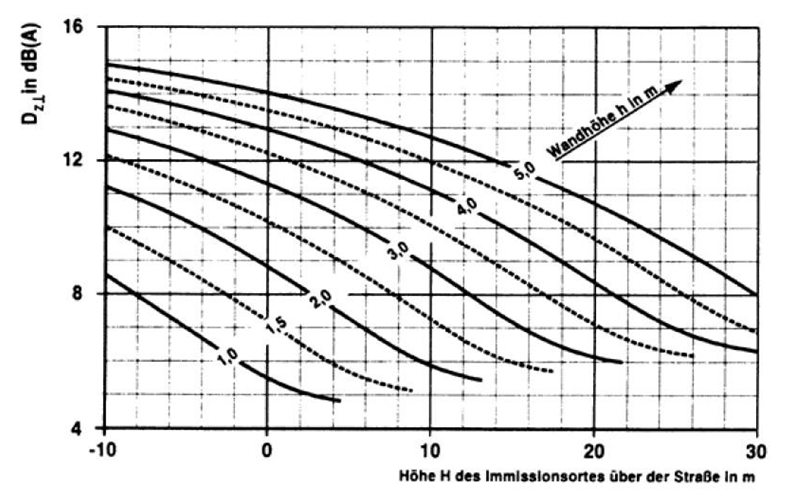
From Figure 1, using 2.1% as p (percentage of heavy trucks) the expected value of Leq level = 69dB (A). From Figure A.3., the distance 56.5 metres of Kisubi High school’s façade from the emission point coincides to a correction of -3dB (A). Therefore, resultant Leq level = 69-3= 66dB (A). But the measured value of Leq from the noise metre is 64.4dB (A), which is in the same range with a difference of 66-64.4 = 1.6dB (A). The measured value is 64.4dB (A). The permissible level of Leq from Table 3 in a school environment is 45dB (A) and therefore the noise level required for reduction is 64.4-45 = 19.4dB (A). From Figure A.4., taking H= 4.7 m (from Figure 11 above), the most effective noise wall height is 5.0 metres corresponding to an attenuation of 13.2dB (A). Material to be used; from Table 4, masonry wall 150 mm thick, with a density of 288kg/m2 which gives a 40dB loss greater than 19.4dB (A) with a T-shaped coping to increase deflection of sound waves away from the wall, is to be used.
3.4.2. CoRSU Hospital
From surveying, the horizontal distance between the edge of the road and the hospital’s façade was 16 metres and the existing wall fence was 11 metres from the façade, assuming the half width of the road is 3.5 metres. 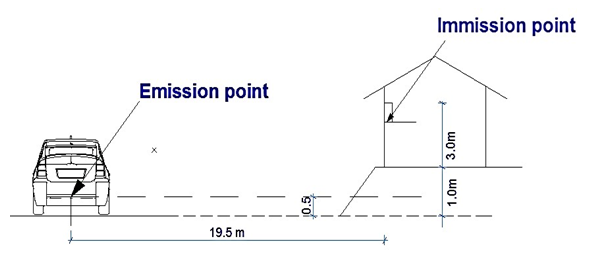 | Figure 12. Location of Emission and Immision Points for CoRSU Hospital |
From Figure 1, using 2.1% as p (percentage of heavy trucks) the expected value of Leq level =69dB (A). From Figure A.3, the distance 19.5 metres of CoRSU hospital’s façade from the emission point coincides to a correction of 2.8dB (A). And therefore resultant Leq level = 69.2+2.8 = 72dB (A). But the measured value of Leq from the noise metre is 78.1dB (A), with a difference of 78.1-72 = 6.1dB (A) which could have been caused by irregularities like the elevation of the hospital and high number of heavy trucks in this specific time interval of noise measurement. Taking Leq as 78.1dB (A). The permissible level of Leq from Table 3 in a hospital environment is 45dB (A) and therefore the noise level required for reduction is 78.1-45 = 33.1dB (A). From Figure A.4, taking H= 3.5 m (from Figure 12 above), the most effective noise wall height is 5.0 metres corresponding to an attenuation of 13.8dB (A). Material to be used; from Table 4, masonry wall 150 mm thick, with a density of 288kg/m2 which gives a 40dB loss greater than 33.1dB (A) with a T-shaped coping to increase deflection of sound waves away from the wall, is to be used.
3.4.3. Residential Houses
From surveying, the horizontal distance between the edge of the road and the school’s façade was 10 metres and the proposed wall fence was 5 metres from the façade, assuming the half width of the road is 3.5 metres. 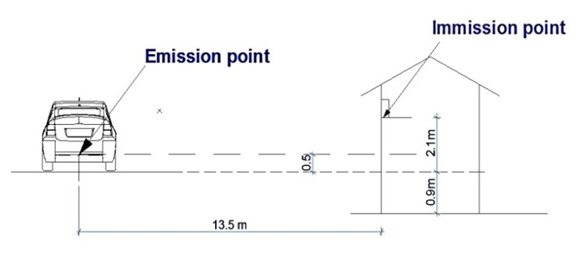 | Figure 13. Location of Emission and Immision Points for Residential Houses |
From Figure 1, using 2.1% as p (percentage of heavy trucks) the expected value of Leq level = 69dB (A). From Figure A.3, the distance 13.5 metres of the residential façade from the emission point coincides to a correction of +3.5dB (A). Therefore, resultant Leq level = 69+3.5= 72.5dB (A) But the measured value of Leq from the noise metre is 74.4dB (A), with a difference of 74.4 -72.5 = 1.9dB (A) which could have been caused by irregularities like the elevation of the residential house and high number of heavy trucks in this specific time interval of noise measurement. Taking Leq as 74.4dB (A). The permissible level of Leq from Table 3 in a residential environment is 50dB (A) and therefore the noise level required for reduction is 74.4-50 = 24.4dB (A). From Figure A.4, taking H= 1.6m (from Figure 13 above), the most effective noise wall height is 5.0 metres corresponding to an attenuation of 14.0dB (A). Material to be used; from Table 4, masonry wall 150 mm thick, with a density of 288kg/m2 which gives a 40dB loss greater than 24.4dB (A) with a T-shaped coping to increase deflection of sound waves away from the wall, is to be used.
3.4.4. Mirembe Kids’ Care Centre
From surveying, the horizontal distance between the edge of the road and the hospital’s façade was 15 metres and the existing wall fence was 10 metres from the façade and 2 metres above the surface of the road, assuming the half width of the road is 3.5 metres. 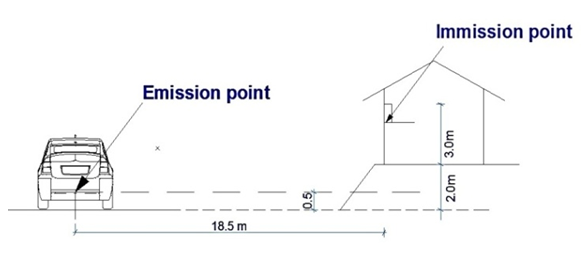 | Figure 14. Location of Emission and Immision Points for Mirembe Kids’ Care Center |
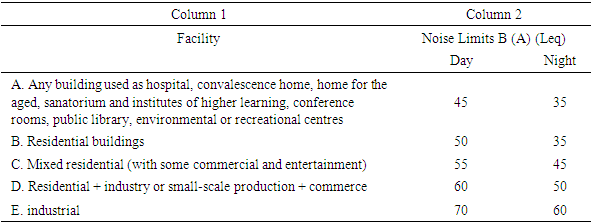
From Figure 1, using 2.1% as p (percentage of heavy trucks) the expected value of Leq level = 69dB (A). From Figure A.3, the distance 18.5 metres of Mirembe kid’s care centre’s façade from the emission point coincides to a correction of +3.0dB (A). And therefore resultant Leq level = 69+3 = 72dB (A). But the measured value of Leq from the noise metre is 77.8dB (A), with a difference of 77.8-72 = 5.8dB (A) which could have been caused by irregularities like the elevation of the hospital and high number of heavy trucks in this specific time interval of noise measurement. Taking Leq as 77.8dB (A). The permissible level of Leq from Table 3 in a school environment is 45dB (A) and therefore the noise level required for reduction is 77.8-45 = 32.8dB (A). From Figure A.4, taking H= 4.5 m (from Figure 14 above), the most effective noise wall height is 5.0 metres corresponding to an attenuation of 13.3dB (A). Material to be used; from Table 4, masonry wall 150 mm thick, with a density of 288kg/m2 which gives a 40dB loss greater than 32.8dB (A) with a T-shaped coping to increase deflection of sound waves away from the wall, is to be used.Table 3. Maximum Permissible Limits for General Environment [11]
 |
| |
|
Table 4. Noise Barrier Materials with Respective TL Values [5]
 |
| |
|
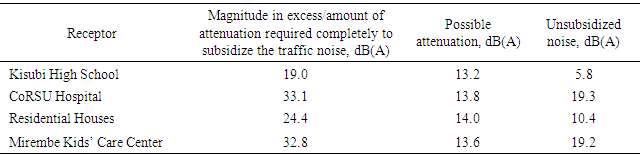
Considering the worst case scenario, the limits are 45dB (A) during day and 35dB (A) during night. Judging from the results of Leq for the noise sensitive receptors and that of the general environment 25 metres away from the mid-point of the road, the following shows the extent to which the noise criteria has been exceeded.Table 5. Excess and Possible Attenuation for Noise Sensitive Receptors
 |
| |
|
From the Table 5 above, the maximum noise level that was not attenuated was 19.3dB (A) which according to [3] cannot have any negative effects in any environment. Therefore, in order to maximise attenuation, a uniform design of a masonry wall with H = 5meters, 150 mm thick and a density of 288kg/m2 with a T-shaped coping which gives a 40dB attenuation. And in addition trees were to be planted along the street to further attenuate traffic noise and improve on aesthetics.
3.5. Content Analysis for Noise Abatement Measures
According to [3], there are three main ways in which the impact of road traffic noise can be reduced; At the source, At the reception point and Along the propagation path.
3.5.1. Control at the Source
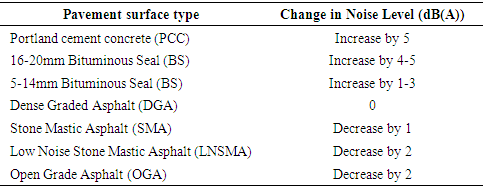
These abatement measures reduce the amount of traffic noise leaving the source. At source abatement measures may be achieved either through Traffic management measures or Modification of pavement surfaces. Traffic management measures: Technically, road traffic noise may be regarded as the aggregation of the noise produced by individual vehicles in the traffic stream [8]. For each vehicle, there are several noise sources including the engine, the exhaust system, tyre/road interaction, the air intake and the cooling fan. Therefore, in order to minimise the noise produced by all these components, the government of Uganda must put a ban on the importation of old vehicles. However, this measure may not be so viable because such vehicles bring in a lot of revenue for the government. Another ‘at the source’ mitigation measure would be putting speed limits because vehicle speed in excess of around 40-50 km/hr is a source of noise produced from the tyre/road surface interaction. Reduction of speed has the potential to reduce traffic noise levels. Generally, a reduction of 20 miles per hour would be needed to reduce the traffic noise level by 5dB (A). However, the noise reduction design goal requires at least an 8dB (A) traffic noise reduction for at least one benefited receptor location [4]. Speed reductions of this magnitude may have adverse impacts on the ability to achieve the purpose of the project, such as increased traffic capacity [9]. Another traffic management measure would be prohibition of heavy and medium trucks, which are the main vehicular contributors of traffic noise, although this may have adverse impacts on the designated uses of the roadway or create unreasonable hardship on the local businesses. Modification of pavement surfaces: This involves modifying the pavement surfaces to increase their sound absorbent properties. Some of the pavement surfaces that would be used include the following; Stone Mastic Asphalt (SMA): An asphalt mix design typically that has a higher proportion of the larger stones and fine particles but relatively few stones of the intermediate size as opposed to the other asphalt mix designs. Dense Graded Pavement (DGA): Is a smooth, uniform aggregate graded pavement surfacing. The depth depends on the purpose of the pavement surface layer (i.e. structural or surface layer). The table below shows the behaviour of the different pavement surfaces in relation to the DGA.Table 6. Pavement Surface Correction Factors [3]
 |
| |
|
Open Graded Asphalt (OGA): Comprised of a porous layer, usually a minimum of 25 to 45 mm thick, which is usually overlaid on DGA and provides a water drainage path within the porous layer. OGA has a higher proportion of the larger stones (compared with DGA) and a smaller percentage of small stones and fine particles. This type of pavement surface is also referred to as an Open Graded Friction Course in some references. The modification of pavement surfaces was not considered a viable abatement measure because it would be very costly to remove the existing pavement surface and replace it with a more absorbent surface. Nonetheless, the traffic noise reduction achieved by doing this is much less than when a noise barrier is constructed.
3.5.2. Control at the Reception Point
The traffic noise abatement measures under this would require proper planning and the design at the land development approval stage should remove the need to attenuate impacts at a later date. Where dwellings are built after construction of the road, appropriate architectural design and treatment at the reception point to limit the intrusion of road traffic noise. Measures such as acoustic seals/paints, thickened glass, double glazing of windows and ceiling insulation, sound proof materials can be effective means of treatment. These should be applied where effective indoor communication, sleeping and other noise-sensitive activities are required. In addition, the architectural designs should also require the noise sensitive rooms of noise sensitive premises to be positioned away from the road hence traffic noise and the less noise sensitive on the side of the road or highway [12].
3.5.3. Control along Propagation Path
Propagation path mitigation measures involve use of noise barriers. The common examples of noise barriers included earth berms, noise walls, a combination of both noise walls and earth berms and lastly, plantations like trees. Noise barriers reduce noise levels by impeding transmission of noise, absorbing noise or reflecting it back toward the noise source. Noise that still reaches a receptor has been either transmitted through the noise barrier or forced to take a longer path to reach the receptor than if no barrier were present. Earth berms have been cited to reduce traffic noise by approximately 3dB (A) more than vertical noise walls of the same height. However, earth berms can require a substantial amount of right-of-way to construct. At least a 3:1 slope on earth berms is required within the right-of-way for maintenance purposes. Combining earth berms with noise walls provides an opportunity to incorporate earth berms up to the height that can be achieved within the available right-of-way. The noise wall can then be constructed on top of the berm to the height necessary to achieve a substantial noise reduction. In addition to this, vegetation such as trees can be planted along the wall to further reduce the noise and also improve aesthetics.
4. Conclusions and Recommendations
4.1. Conclusions
The traffic noise levels in all the sensitive noise receptors all exceeded the noise criteria in the National Environment Act [11] by magnitudes of 19.4, 33.1, 24.4 and 32.8dB (A) in Kisubi high school, CoRSU hospital, Residential houses and Mirembe kids’ care centre respectively. The main contributor to this noise being heavy trucks with a traffic noise level of 65dB (A). The most significant traffic noise impacts Kisubi high school dorm, classroom and from the results obtained makes sleep disturbance the most significant in all the noise receptors. This occurs at night with traffic noise levels going up to 72dB(A). The total vehicular traffic was 1360 veh/hr with a percentage contribution of 2.1% for heavy trucks which corresponded to a traffic noise level of 65dB (A) and 69dB (A) from the rest to the study area. Therefore, in the general environment, this is above the permissible limits. There are three main ways in which traffic noise can be abated and these include; control at the source, control along the path of propagation of the noise and control at the reception point. Control at source and at a point of reception are costly meaning the most feasible and less costly is control along the path of noise propagation with noise walls being the most economical option. From the noise wall design, a brick masonry wall of height 5 metres and thickness 150 mm and density 288kg/m2 was selected for effective attenuation. However, the limitations to this research that require future improvements include the traffic data obtained. It does not cater for peak hour flows and event triggered variations since traffic count was done in one hour. Study on the same needs to be carried out using Average Daily Traffic (ADT) carried on for 7days and projected to a specific strategic plan or period as Average Annual Daily Traffic (AADT).
4.2. Recommendations
Knowledge of traffic noise is important for the public since it sensitises them about its impacts if it is not paid attention to and therefore the government of Uganda through its relevant ministries need to include traffic noise assessment as part of elements to be monitored during land-use planning and to this effect restrict noise sensitive receptors such as schools, hospitals and residential units from occupying spaces close to a main highway. Any development to be made along or near a road should have the necessary designs to abate noise pollution. Introduction of Autonomous Vehicles in Uganda will abate the current high levels of traffic noise. Currently, there are no autonomous vehicles in Uganda but the Government is encouraged to pursue its introduction in achieving it substantial economic growth [14].As much as emphasis have been put to manage land transportation noise, the Government of Uganda should take actions to abate the noise of aviation at the Entebbe International Airport and other regional Airports under development [15].
ACKNOWLEDGEMENTS
We would like to express our gratitude to Eng. Mwesigwa Leonard of Kampala Capital City Authority (KCCA) for providing us with very rich and timely information as regards to this paper. In his efforts towards this paper, Eng. Leonard provided us with the traffic network system of the Greater Kampala Metropolitan Area from which we were able to choose Entebbe road as our case study given its desired constituent in terms of settlement and traffic mix.A sincere gratitude goes to Dr. Muhwezi Lawrence, the Head of Department of Civil and Building Engineering, Kyambogo University for providing us support towards the review of this paper and ensuring that all necessary items are included before submission.Finally, our gratitude towards the Local Authorities along Entebbe Road, specifically the Head Teacher of Kisubi High School, the Administrator of CoRSU hospital, the local area leaders within the residences in which part of the surveys were carried out and lastly the Administrator of Mirembe Kids’ Care Center for providing a conducive environment in which we were able to carry out the sound surveys successfully.
Appendix
Table A.1. Most significant traffic noise impact in each noise receptor
 |
| |
|
Table A.2. Noise measurement results for Kisubi High School
 |
| |
|
Table A.3. Noise measurement results for CoRSU Hospital
 |
| |
|
Table A.4. Noise measurement results for residential house
 |
| |
|
Table A.5. Cumulative percentage Vs upper bound traffic noise levels
 |
| |
|
Table A.6. Leq, V and traffic count results
 |
| |
|
 | Figure A.1. L10 estimation chart [7] |
 | Figure A.2. Chart for adjustment of L10 due speed V and heavy truck percentage p [7] |
 | Figure A.3. Determination of barrier correction, D using the emission point distance [1] |
 | Figure A.4. Determination of noise wall height using barrier potential for distances S┴,0, up to 70 metres but greater than 50 metres [1] |
References
| [1] | Alimohammadi, I., Nassiri, P., Behzad, M., & Hosseini, M. R. (2005). Reliability analysis of traffic noise estimation in highways of Tehran by Monte Carlo simulation method. Iran. J. Environ. Health. Sci. Eng. Vol 2. No. 4, pp. 229-236. |
| [2] | Boer, L. C., & Schroten, A. (2007). Traffic noise reduction in Europe: Health effects, social costs and tecchnical and policy options to reduce road and rail traffic noise. The Netherlands: CE Delft, Solutions for environment, economy and technology, www.ce.nl. |
| [3] | DTMR. (2003). Transport Noise Management Code of Practice: Volume 1-Road Traffic Noise. Queensland: Department of Transport and Main Roads. |
| [4] | DTMR. (2013). Transport Noise Management Code of Practice: Volume 1-Road Traffic Noise. Queensland: Department of Transport and Main Roads, QueensLand Goverment. |
| [5] | EPD, & HD. (2003). Guidelines on design of noise barriers. Hong Kong: Government of Hong Kong. |
| [6] | Feingold, L. S., Harris, C. S., & Gierke, H. E. (1994). Community annoyance and sleep disturbance: Updated creteria for assessing of general transportation noise on people. Noise Control Engineering 42(1). |
| [7] | HMSO. (1988). Calculation of Road Traffic Noise. Netherlands: Department of Transport. |
| [8] | Houghton, J. (1994). Transport and the environment, Eighteenth report of the UK Royal commission on environmental pollution. London, England: HMSO. |
| [9] | IDoT. (2017). Highway Traffic Noise Assessment Manual. Springfield, Illinois: State of Illinois, Illinois Department of Transport. |
| [10] | Kayemba, P. (2013). Sustainable Transport in Kampala-Uganda: context, Initiative, challenges and the future. Kampala : https://sustainabledevelopment.un.org. |
| [11] | NEMA. (1995). The National Environmental act, Cap 153. Kampala: National Environmental Management Authority, Uganda. |
| [12] | Pignier, N. J. (2015). The impact of traffic noise on economy and environment: Performed within the scope of the ECO2 project "Noise propagation from sustainable ground vehicles". Trita Ave, Stockholm, Sweden: KTH Royal Institute of Technology. |
| [13] | Vermeiren, K. (2012). Landscape and Urban Planning, Urban growth of Kampala, Uganda: Pattern analysis and scenario development. Kampala: vol. 5 (8), pp. 2-4. |
| [14] | Wiseman, Y. (2021). Autonomous vehicles. In Encyclopedia of Information Science and Technology, Fifth Edition (pp. 1-11). IGI Global. |
| [15] | Wiseman, Y. (2014). Noise Abatement Solutions for Ben-Gurion International Airport. International Journal of U-& E-Service, Science & Technology, 7(6), 265-272. |

 Abstract
 Reference
 Full-Text PDF
 Full-text HTML