Olufemi Jacob Oyekanmi 1, Ejem Agwu Ejem 2, Uchenna Moneke 3
1Federal Ministry of Works and Housing, Highways Department, Mabushi, Abuja, Nigeria
2Department of Transport Management Technology, Federal University of Technology, Owerri, Owerri, Nigeria
3Department of Project Management Technology, Federal University of Technology, Owerri, Owerri, Nigeria
Correspondence to: Ejem Agwu Ejem , Department of Transport Management Technology, Federal University of Technology, Owerri, Owerri, Nigeria.
| Email: |  |
Copyright © 2021 The Author(s). Published by Scientific & Academic Publishing.
This work is licensed under the Creative Commons Attribution International License (CC BY).
http://creativecommons.org/licenses/by/4.0/

Abstract
The paper assessed road pavement damage caused by heavy goods vehicles and their associated costs. The paper adopted pavement damage estimation technique that combined the HERS and the AASHTO. The highway sections of Lokoja-Abuja, Ilorin-Jebba and Abakiliki-Ogoja via Mbok roads were selected and data were collected through an axle-load survey, automatic traffic count and from secondary sources. The Metrocount Executive software and Excel Ad-ons were used in analyzing the data. The damaging effects of the HGV are more severe at Lokoja-Abuja Road (with g = 0.30), followed by Ilorin-Jebba Road (with g = 0.35) and Abakiliki-Ogoja Road (with g = 0.43). The heaviest overload of 94% of the 6-axle vehicles from cement carrying trucks plying the Lokoja-Abuja road could explain this intense damaging effect on the road pavement. Upon aggregation, the benchmark average annual maintenance costs per kilometre in Nigeria stands at ₦143,182,853.55, while the average annual per-km maintenance costs attributed to Heavy Goods Vehicle traffic is ₦101,385,881.57. Thus, the unit damage cost per ESAL-km was computed as ₦5.65, ₦5.70 and ₦0.74 for Lokoja-Abuja, Ilorin-Jebba, and Abakiliki-Ogoja roads respectively. Hence, the benchmark per- equivalent single axle loads unit cost for the Nigerian roads is ₦4.03. This figure represents the benchmark damaging cost of overload per equivalent single axle loads (ESAL) on the Nigerian road. This becomes a basis for control of excessive axle-load violations on the Nigerian roads.
Keywords:
Highways, Overloading, Pavement, Damage Cost and ESAL
Cite this paper: Olufemi Jacob Oyekanmi , Ejem Agwu Ejem , Uchenna Moneke , Estimation of Pavement Damage Costs Attributed to Overloaded Heavy Goods Vehicles on Nigerian Highways, International Journal of Traffic and Transportation Engineering, Vol. 10 No. 1, 2021, pp. 10-19. doi: 10.5923/j.ijtte.20211001.02.
1. Introduction
Overloaded trucks is now a common scene on Nigerian roads and it is not surprising to see vehicles carrying as much as twice the legally permissible axle loads on the roads. The road network in Nigeria comprises Federal, states and local government roads. The development of modern roads along the major arterials is funded by the Federal Government. There are several studies, and some are still in progress to understand the effect of overloading on the road pavement [1]. The current value of Nigeria road asset stands at an estimated cost of about N3.4 trillion as of March 2018 [2]. It is improper to allow this value of the asset to go down by unhealthy practices most characterised by the overloading of vehicles. Hence the need to see the roads as a national asset that should be managed adequately by engaging International best practices models for road asset management. In the event of increasing destruction of roadways (see Figure 1), maintenance burden and increasing economic loss in value, the Federal Government set up the Road Asset Management System (RAMS). It aimed to assist the Federal Ministry of Works, Housing and Power in ensuring optimal decision making in planning, provision and sharing of scarce resources in the road sector. The RAMS is funded by the World Bank [1].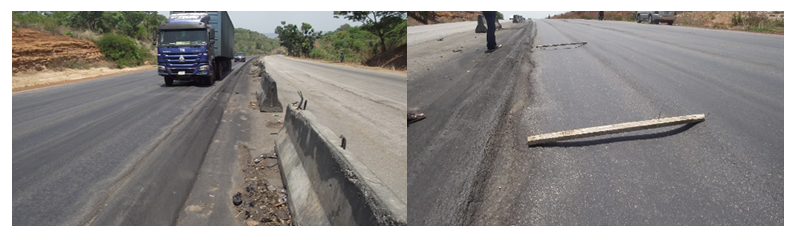 | Figure 1. Pavement Damage on Abuja-Lokoja Expressway due to Overloading. Source: [3] |
The investment of the Government in road infrastructure has been increasing since Independence. The current value of Nigeria road asset is considerably high at an estimated value of about N3.4 trillion as of March 2018 [3]. It is improper to allow this value of the asset to be destroyed by all manners of abuse most typified by the overloading of vehicles. There is therefore an urgent need to see the roads as a national asset that should be properly managed by deploying International best practices models for road asset management. In the wake of increasing dilapidation of roads, maintenance backlog and accelerating loss of asset value, the Federal Government in 2016 established the Road Asset Management System (RAMS) to assist the Federal Ministry of Works in rationalizing decision making in planning, programming, funding, procurement and allocation of scarce resources in the road sector. The RAMS is being funded by the World Bank.Axle load control issues are of great importance in road maintenance management. The construction of weighbridge stations for the axle load control is one of the effective ways in this regard. The Public-Private Partnership (PPP) model currently being envisaged by the government requires research-based recommendations for the appropriate model for the financing of road maintenance. This paper is of invaluable contributions to the establishment of sustainable highway maintenance in Nigeria. Hence, this paper will be beneficial to the government who is presently a major financier of road development and maintenance by providing a sustainable strategy of road infrastructural management. In this paper, three road sections were selected, namely: Lokoja-Abuja Federal road in Kogi state, Ilorin-Jebba Federal highway in Kwara state and Abakaliki-Ogoja Road in Ebonyi State. These roads were recently fully rehabilitated by the Federal Government of Nigeria. Data on these road sections were collected within four months between February and May 2019. The Coordinates of data collection locations are as follows: 1. Abakaliki - Ogoja road; Lat. 6.322194, Long. 8.192417; 2. Lokoja – Abuja; Lat. 8.447871, Long. 6.935635; 3. Ilorin – Jebba; Lat. 8.664952, Long. 4.592739.
2. Literature Review
Road failure is a major problem in both developing and the developed countries. Given the high cost of maintenance and reconstruction, Researchers are anxious to investigate the causes of these failures [4]. The additional weight carried by overloaded trucks accelerates the deterioration of the roadway, leading to rutting, fatigue cracking, and in certain cases structural failure [5], [6]. In the context of [7], attributable costs are load-related pavement damage costs that are allocated to different vehicle classes according to their pavement damage contribution; in each class, these costs vary across different vehicles due to their weight. [8] estimated that 28%, 78% and 38% of the expenditures for flexible, rigid and composite pavements, respectively, are load related. The fact vehicle overloading causes road pavement structural distress and decreases service life has also been reported by [9]. [10] quantified incremental pavement damage caused by overweight trucks. Several studies argued the validity of the AASHTO test results and re-estimated the load equivalency factors using either the AASHTO road test data or local data [11], [12], [13].Estimating vehicle loadings on the pavement is important in pavement deterioration investigation methodologies. The weight of the vehicle is directly transferred to the road surface through the axle of the vehicle. Hence Axle load conversion factor known as Equivalent Single Axle Loads (ESALs) are used to connote the impact of the number of axles of the road. An ESAL is defined as the equivalent effects of a single 18,000-pound axle load applied to a pavement segment [7]. An ESAL factor is a typical load factor that epitomizes the equivalent pavement bearing of an axle load as associated with a single 18,000-pound axle [7].A draft Policy to guide axle load control has been proposed, for inclusion into the national transport policy for the country. It is suggested that an essential part of this Policy is the creation of a Road Freight Transport Consultative Forum, in which all role players meet to discuss issues and develop strategy, including on axle load control. The draft policy aims to set heavy legal vehicle and axle load limits as close to the economic optimum as possible [14]. Strategies, targets and objectives are needed to implement Policy, and proposals for these are for discussion and refinement in the Road Freight Transport Consultative Forum proposed in the Policy. Clear, understandable legislation is an essential part of any axle load control strategy, and proposals to resolve the present difference between Federal law, State legislation and ECOWAS standards suggested.The legislation providing for these limits is more involved in structure to achieve the intended result. It also needs to be more prescriptive to protect the general public by limiting loads according to power to weight ratio, tyre capacity as well as traction requirements. The upward revision of legal limits means that some of the pavements and bridge structures are under-designed and that a project to assess the extent of this and possible resolution of the problem must be undertaken. It is, however, apparent from the data collected in the paper that ongoing excess loads are far above the proposed limits are already running on the roads. It is therefore anticipated that, if proper enforcement of the recommended limits can be effected as they are introduced, it may not be necessary to strengthen roads and bridges before changing the boundaries. The legislation needs to provide for appropriate sanction of the offender if he is apprehended. The need to make the penalty a significant deterrent requires the level of such punishment to exceed the possible profit obtained by the operator from overloading significantly. The value of the damage caused by overloading, provision for recovery of cost incurred in enforcement operations, as well as a punitive factor, needs to be included in the fine.
2.1. Gap in Literature/Contribution to Knowledge
Different studies have used different road use parameters or traffic variables to estimate the costs of pavement damage across vehicle classes such as Vehicle-mile, mile/year, GVW-mile and ESAL-mile. This research estimated damage cost using ESAL/Km, being the first of its kind to be domesticated in Nigeria. [7] motivated greatly this paper to be replicated in Nigeria. [7] estimated pavement damage cost in terms of the US dollars mile/year road use measure but did not differentiate between the different vehicle classes. For example, they estimated a pavement damage cost of US dollars mile/year attributed to the beef industry in a certain region. The methodology of Bai et al provides general information but does not show specific information based on vehicle class or weight. This paper has gone further to improve on the paper by using a synthesized HERS/AASHTO methodology by considering axle-load configuration in its computation. This enhanced estimation procedure makes it more convenient to benchmark the research output along corridors with similar vehicular traffic. It equally made it easier to build a nationwide model that can serve as a sustainable strategy to ensure high serviceability ratings for Nigerian roads. Most studies such as [15] used the axle load per mile as the road use measure for pavement damage cost estimation. Without translating the axle load into the damage caused, this approach implicitly assumes that a 100% increase in axle weight could cause a 100% increase in pavement damage. However, this paper adopted an estimation procedure that suits our construction climate and traffic conditions. The ESAL/km adopted in this paper has a unique feature of the same structural number for flexible pavement applicable in all road construction works in Nigeria. In conceptual terms, the theoretical life of a pavement is directly related to pavement strength or structural number. This paper is therefore tailored to reflect the highway engineering inputs that are consistent with the Nigerian pavement construction ecosystem.
3. Methodology
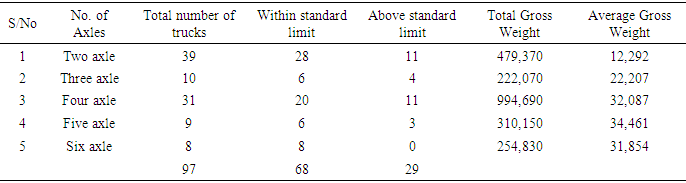
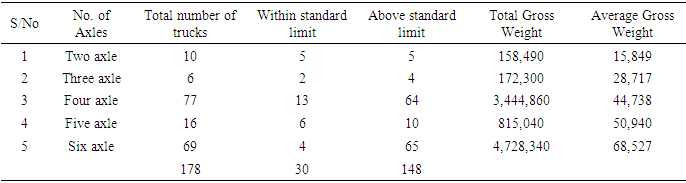
This paper aims to estimate the cost of vehicle overloading on the Nigerian highway. The estimation of highway damage costs associated with overloaded trucks on Nigerian highways required several types of information. This included truckload data on the highway section under study, truck characteristics, pavement characteristics data, and pavement maintenance cost data. Truckload data reflects the truck traffic on the highway section. Truck characteristics data are the features of the trucks primarily used for the overloaded trucks. Required pavement characteristics data for this study included data describing pavement type, length, structure, distress survey, and Pavement Serviceability Rating (PSR) index. This information is important for pavement deterioration analysis. Pavement maintenance cost data also needed to be collected to estimate the average unit cost of the highway section. A thorough analysis of the vehicle weight data, namely the GVW, was obtained to determine the vehicle overloading characteristics at the study location. The GVW permissible is categorized based on vehicle class. For this paper, the focus is given to the 1-axle, 2-axle, 3-axle, 4-axle trucks, 5-axle and 6-axle. The number of overloaded trucks is presented/summarized next for each location at each paper location (see Tables 1-3).Table 1. Summary of Truckload Data for Abakaliki towards Ogoja/Mbock
 |
| |
|
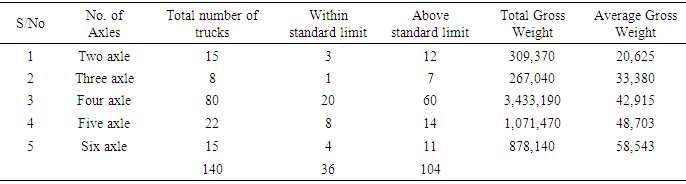
Table 2. Summary of Truckload Data for Ilorin-Jebba
 |
| |
|
Table 3. Summary of Truckload Data for Abuja - Lokoja
 |
| |
|
In determining pavement damage costs due to overloaded trucks, it was essential to estimate ESAL factors for axle types. The impact of this HGV on roadway differs depending on the road’s physical characteristics. There are three important steps involved in estimating the ESAL factor. First, the rate of damage was calculated for a typical axle. Second, the damage rates of the interest axle loads were calculated. Finally, the two damage rates were utilized to compute the ESAL factors. These calculations required information on the number of axles in respective vehicles. The only exclusion being the calculation of the structural numbers in which calculations for each pavement were used when available. Typically in Nigeria, all road pavements are assumed to have the same structural numbers.
3.1. Determination of the Index of Damage or Deterioration
The deterioration of pavements was analysed with a damage function that associated with the decline of pavement serviceability to axle passes. The general form of a damage function is illustrated as follows [7]: | (1) |
Where: g = an index of damage or deterioration = the number of passes of an axle group of specified weight and configuration (e.g., a single 18-kip axle); τ = the number of axle passes at which the pavement reaches failure (e.g., the theoretical life of the pavement); β = deterioration rate for a given axle;At any time between the construction or replacement of pavement failure, the value of g will range between 0.0 and 1.0. When N equals zero for a newly constructed or rehabilitated section, g equals zero. However, when N equals the life of a highway section (τ), g equals 1.0.One way to quantify accumulated pavement damage is through a serviceability rating. If the ratio of decline in pavement serviceability relative to the maximum tolerable reduction in serviceability is used to represent the damage index, then Equation (2) can be rewritten as follows [7]: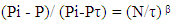 | (2) |
Where: Pi = initial pavement serviceability rating; Pτ = terminal pavement serviceability rating; P = current pavement serviceability rating.
3.2. Estimation of ESAL Factors for Flexible Pavement
For flexible pavements, the unknown parameters (β and τ) in Equation (3) can be estimated through regression equations (Equation 3 and 4) developed based on AASHTO road test data [7]. | (3) |
 | (4) |
Where: L1 = axle load in thousand-pounds or kips; L2 = axle type (1 for single, 2 for a tandem, and 3 for triple axles); N = structural number of the flexible pavement section.The rate of flexible pavement deterioration for the reference axle (the single 18-kip axle), as shown in Equation 5. | (5) |
 | (6) |
 | (7) |
The actual ESAL factor n is computed by taking the inverse logarithm of the appropriate expression, as shown in Equation (7).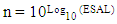 | (8) |
Where: n= ESAL factor.
3.3. Estimation of ESAL Life Functions
The ESAL life of a pavement is the cumulative number of equivalent single axle loads that the pavement can accommodate before it is rehabilitated. The ESAL life equations are derived from the same equations used to construct axle load equivalency formulas [7]: | (9) |
 | (10) |
 | (11) |
 | (12) |
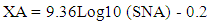 | (13) |
Where: LGE = cumulative ESALs that a pavement section can accommodate before reaching its terminal serviceability rating (in the logarithmic form); XB = rate at which a pavement's life is consumed with the addition of ESALs; XG = pavement serviceability loss in terms of the maximum allowable pavement PSR loss (from PI to Pτ); XA = theoretical life of newly constructed pavement in ESALs; SN = structural number of flexible pavement; SNA = converted pavement structural number. Finally, the actual lifecycle of flexible pavement is calculated by taking the inverse logarithm of LGE: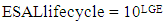 | (14) |
Equation (13) shows that the theoretical life of a pavement is directly associated with pavement strength or structural number. However, the rate of pavement deterioration is inversely related to strength, as shown in Equation (9). Naturally, both associations make sense. In reality, pavements are frequently maintained before their PSR values decline to the terminal values. Consequently, their theoretical lives are rarely realised. In such instances, the solution of XG is negative, and the ratio XG/XB adjusts the predicted ESAL life downward from its theoretical maximum [7].
3.4. Calculation of Structural Numbers
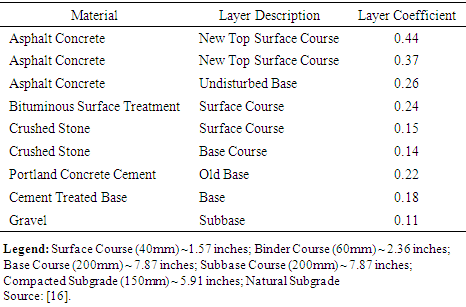
For flexible pavements, the structural number can be determined using Equation (15). See Table 4 for the layer coefficients used to compute pavement structural numbers [7].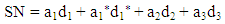 | (15) |
Where: d1 = Thickness of surface layer (inches); a1 = Surface layer coefficient; a1* = Layer coefficient of old surface layer; d1* = Thickness of old surface layer as a base course (inches)a2 = Base layer coefficient; d2 = Thickness of base (inches); a3 = Sub base layer coefficient; d3 =Thickness of sub base (inches)Table 4. Layer Coefficient used to Compute Pavement Structural Numbers
 |
| |
|
3.5. Determination of Deterioration Due to Environmental Losses
A pavement will weaken over time due to environmental factors in the absence of truck traffic. Impacts on materials are largely a function of the environment and will result in a loss of pavement serviceability. This function recommends that pavement state declines quickly when initially exposed to the environmental components, but then depreciates slowly over time. Assuming this hypothetical relationship holds, the decay rate due to environmental conditions can be established using the following Equation [7]: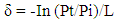 | (16) |
Where: δ = Decay rate due to environmental losses; Pt= Terminal PSR; Pi = Initial PSR; L= Maximum feasible life of pavement section.From the decay rate, the PSR due to the environmental impact can be computed as: | (17) |
Where: PE = PSR due to the environmental impact; t = Typical pavement performance period.
4. Results and Discussions
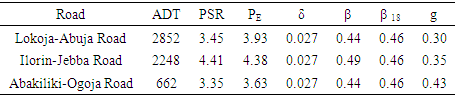
Vehicle loading, for example, is such a varied combination of many factors, varying from road to road, over time with traffic growth and changes in technology. We are obliged to gratify two extreme demands, namely: to define a hands-on and germane summary statistic representing the combined effects of vehicle loading for use in design; and to decide the relative damaging penalties arising from separate axle loadings, axle configurations, tire sizes, types and pressures, and from the various properties related with vehicle speed and distinct suspension-types, in such a way that the impact on the marginal costs of road damage and the optimum vehicle design and loading regulations can be evaluated for each factor.The conventional approach now for road pavements studies is to reduce mixed traffic loadings to the single unit of equivalent standard axle loadings (ESAL), which is the number of passages of a standard axle load that cause the same amount of damage as the diverse traffic. The desirability of a regulated damage function is that it states the fraction of terminal losses, and so relates readily to an explanation of the expended life" or "remaining life" of a pavement. The computations of the AASHTO functions, the indices of measuring the deterioration effects of the HGVs are shown in Table 5. Table 5. Highway Deterioration Indices
 |
| |
|
The damage index g defined the fractional change of serviceability index are 0.30, 0.35 and 0.43 for Lokoja-Abuja Road, Ilorin-Jebba Road and Abakiliki-Ogoja Road respectively. This ratio explains the loss in serviceability at time t to the potential loss taken at a point where PT = 3.0. The trend of the damage function, therefore, expresses the performance of the pavement concerning two standards, the quality of original construction or initial condition (PI) and the "terminal" level of distress at which maintenance or rehabilitation is deemed necessary (PT). The base of the function, therefore, changes as one or other of these two standards alters. The analytical models of AASHTO all take this form of dimensionless damage functions. Hence, the damaging effects of the HGV are more severe at Lokoja-Abuja Road (with g = 0.30), followed by Ilorin-Jebba Road (with g = 0.35) and Abakiliki-Ogoja Road (with g = 0.43). The more substantial overload of 94% of the 6-axle vehicles from cement carrying articulated vehicles plying at the Lokoja-Abuja road could explain this intense damaging effect on the road pavement.While time (and thus age) is a universal dimension, the environmental factors which influence non-traffic-associated damage are not captured. In the present paper, the non-traffic-associated effects have been quantified in coefficients (PE), and these are being related to environmental factors through comparative studies with independent databases from other climates. The approach of ecological classification appears to be the most practical since it captures the significant effects and makes empirical validation feasible. In Table 5, the PSR due to the environmental impact (PE) for Lokoja-Abuja Road, Ilorin-Jebba Road and Abakiliki-Ogoja Road are 3.93, 4.38 and 3.63, respectively. This is closely related to the PSR estimated by traffic users and operators survey of 3.45, 4.41 and 3.35 for Lokoja-Abuja Road, Ilorin-Jebba Road and Abakiliki-Ogoja Road. This shows that the present serviceability ratings of Nigerian road are more traffic-loading determined than from environmental concerns.
4.1. Costs Attributed to Overloaded Trucks
The yearly pavement damage costs credited to these vehicle miles travelled were assessed based on the projected yearly total truck vehicle miles travelled on the selected road segments. To calculate the pavement damage costs due to truck traffic, it was necessary to estimate ESAL factors for typical truck types and pavement types. The impact of this HGV on roadway differs depending on pavement characteristics. There are three necessary steps involved in calculating the ESAL factor. These computations required the knowledge of the number of the axle, the load factor, the initial and terminal present serviceability ratings, pavement characteristics and nature. As mentioned earlier, the three road sections in Lokoja-Abuja, Ilorin-Jebba and Abakiliki-Ogoja, were reflected as flexible pavements during the calculation of pavement damage. The following sections describe the pavement damage computation procedure and corresponding results.
4.2. Calculation of ESAL Factors and Annual ESALs
Pavement structural numbers are important inputs for the estimation of ESAL factors. The statistics for Lokoja-Abuja, Ilorin-Jebba and Abakiliki-Ogoja roads were computed as 5.6. These were premeditated based on their pavement structure information from the Federal Ministry of Works & Housing, Abuja. Pavement segments had a surface layer of 40 mm (1.57 in), and the base course was the original layers with a total thickness of 200 mm (7.87 in). The layer coefficients were selected from Table 4. With the structural numbers known, the full ESAL factor value n for a standard truck was the sum of the single front axle and two rear tandem axle groups. Then, the truck ESAL factor was multiplied by the yearly vehicle miles travelled to compute the annual ESALs for each pavement segment. The results are presented in Table 6.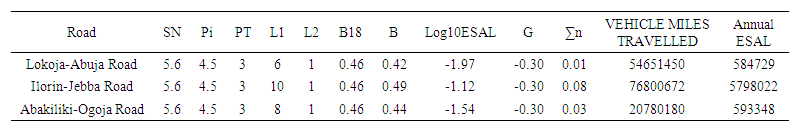 | Table 6. Calculation of ESAL Factors and Annual ESALs |
4.3. Determination of the Pavement ESAL Lives
The maximum life of pavement was defined in terms of tolerable decline in present serviceability ratings. FMW designed the studied road pavement at initial present serviceability ratings, of 4.5 and terminal present serviceability ratings, of 3.0: a maximum acceptable drop in present serviceability ratings was 1.5. The life of the selected road segments in terms of traffic, or ESAL life, was determined using this maximum tolerable present serviceability ratings, decline. ESAL life is the total number of axle passes that would cause the pavement to decline to its terminal present serviceability ratings, regardless of the time involved. The ESAL life of each studied pavement segment was determined to be 25147749.17. The results are shown in Table 7.The factors used in the pavement damage cost analysis for the three pavement segments and the calculation results are summarized in Tables 7 and 8. The damage cost for each of the selected road segment was estimated as the unit cost per ESAL multiplied by the annual ESALs on each part. After adding values from three road segments, the result denotes the annual pavement damage costs on the selected road segments accredited to high-grade vehicles.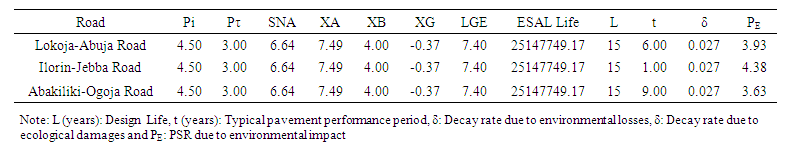 | Table 7. Calculation of Pavement ESAL Lives |
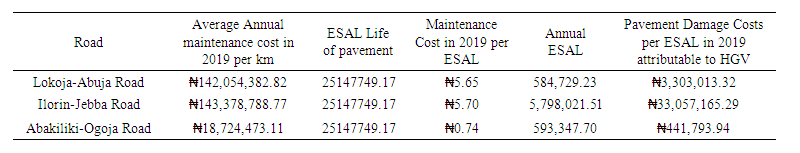 | Table 8. Pavement Damage Costs Results |
In summary, for the Lokoja-Abuja Road, Ilorin-Jebba Road and Abakiliki-Ogoja Road, the total annual highway damage related to high-grade vehicles was estimated at ₦3,303,013.32, ₦33,057,165.29 and ₦441,793.94 per ESAL respectively. Besides, the annual damage cost per ESAL/km was approximately ₦5.65, ₦5.70 and ₦0.74 for Lokoja-Abuja Road, Ilorin-Jebba Road and Abakiliki-Ogoja Road respectively.
4.4. Determination of the Per-Kilometre Pavement Maintenance Costs and Per-Equivalent Single Axle Loads Unit Cost
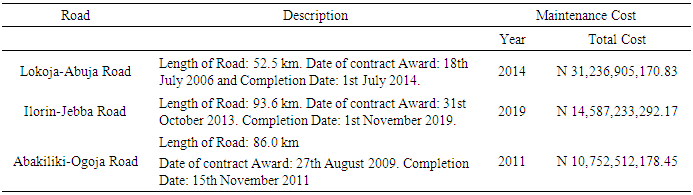
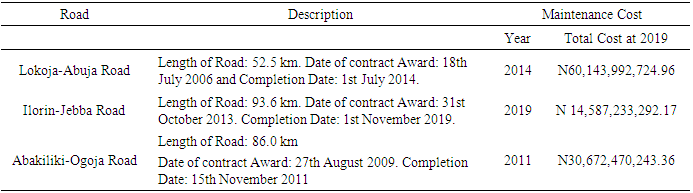
Table 9 presents the maintenance costs of three road segments that were provided by the Federal Ministry of Works and Housing. It includes a brief description of the road network being studied, action years, and total costs. Although the maintenance was performed in a specific year, the pavements decayed gradually. It was not reasonable to simply assume that the price for each maintenance action was only for that year. For example, a cost of N 31,236,905,170.83 spent in 2014 should be considered as the pavement damage of Lokoja-Abuja between 2014 (when the last maintenance action took place) and 2019, rather than just for that year (2014). Table 9. Maintenance Cost Data for Pavement Segments
 |
| |
|
Also, the money spent in previous years has to be converted to the current value to reflect a per-ESAL cost that is more meaningful for the present time. In this research, 9% was used as the rounded average interest rate (r). Table 10 shows the maintenance costs of the studied highway section converted into the naira value for the year 2019. Table 10. Maintenance Costs for Pavement Segments in the Year 2019
 |
| |
|
To compute average annual maintenance costs, it was necessary to determine the period covered by each maintenance expenditure. In this paper, the maintaining period of each spending (Mti S) was considered as the interval in years (Ii) between two contiguous maintenance activities. Using the constant naira smoothing method, annual maintenance spending (Ats) on a pavement segment was computed using Equation.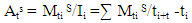 | (18) |
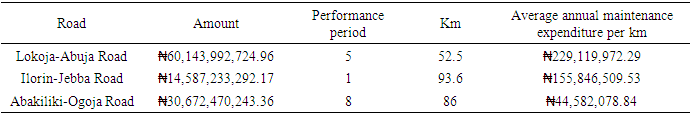
Ats = average annual maintenance cost in 2019 for segment S at time, t ϵ [ti+t, ti]Ii = interval years. According to the Federal Ministry of Works pavement management policy, the maximum feasible life of a pavement is 20 years. According to FMW, the anticipated design life for full-depth asphalt pavement was 15 years before a maintenance action was needed. The anticipated life was six years before action was required after a light rehabilitation with any overlay less than 1.5 inches or surface recycle actions. The performance period of the studied pavement segments, in terms of the number of years after a new pavement segment is resurfaced, was considered as six years because the data showed that none of the sections had any overlays less than 1.5 inches. Therefore, the average annual maintenance expenditure per km for the studied pavement segments was calculated using the following method: ((Amount)/Performance period)/length of road. The official exchange rate of naira to a dollar is shown in Table 13. The results are shown in Table 11.Table 11. Average annual maintenance expenditure per km
 |
| |
|
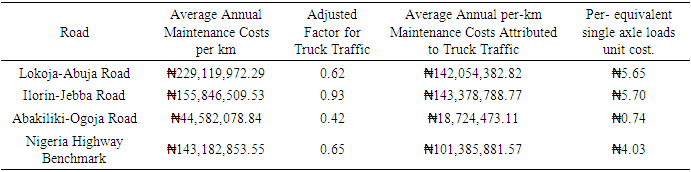
Table 12. Average Annual Maintenance Costs per km attributed to High-Grade Vehicles
 |
| |
|
Table 13. Currency Conversion
 |
| |
|
The average annual maintenance expenditure per km for Lokoja-Abuja road, Ilorin-Jebba road Abakiliki-Ogoja road are ₦229,119,972.29, ₦155,846,509.53 and ₦44,582,078.84 respectively. The annual per-km maintenance expenditure for each of the segments calculated in Table 11 was due to both environmental factors and truck traffic. Since this paper aims to estimate the maintenance cost attributed to the truck traffic, the impact of environmental factors should be included.The PSR loss of each segment due to environmental factors for the design period was determined. Given the Federal Ministry of Work’s Policy for initial PSR of 4.5 and terminal PSR of 3.0, with a maximum feasible life of 15 years, the PSR due to the environmental factor (PE) was computed as 3.93, 4.38 and 3.63 for Lokoja-Abuja Road, Ilorin-Jebba Road and Abakiliki-Ogoja Road respectively (also shown in Table 7). The PSR declined by (4.5-3.0) - (4.5-3.93) or 0.93 for Lokoja-Abuja road, (4.5-3.0)-(4.5-4.38) or 1.39 for Ilorin-Jebba road and (4.5-3.0)-(4.5-3.63) or 0.63 for Abakiliki-Ogoja road during the design period of 15 years irrespective of truck traffic. Because the maximum tolerable loss in PSR is 1.5, then the per cent of the pavement rehabilitation costs due to truck traffic was estimated as follows: Percent of maintenance costs due to related truck traffic = 0.93/1.5 = 62% for Lokoja-Abuja road; 1.39/1.5 = 92% for Ilorin-Jebba road and 0.63/1.5 = 42% for Abakiliki-Ogoja road.Thus, the average annual maintenance cost per km of each pavement segment needs to be adjusted by a factor of the respective percentages to isolate damage solely attributed to truck traffic. Table 12 shows the improved results of average annual maintenance costs in 2019 for each road segment. Thus, average annual per-km maintenance costs attributed to truck traffic for Lokoja-Abuja road, Ilorin-Jebba road and Abakiliki-Ogoja road are ₦142,054,382.82, ₦143,378,788.77 and ₦18,724,473.11 respectively. Then, the unit cost per ESAL for each pavement segment was computed by dividing the average per-km maintenance cost by the determined ESAL life of the same section. This resulted in ₦5.65, ₦5.70 and ₦0.74 for Lokoja-Abuja road, Ilorin-Jebba road, and Abakiliki-Ogoja road. Thus this represents the corresponding penalties and appropriate charges for a unit excessive ESAL per km and thereby the basis for control of axle load violation on the Nigerian roads. However, upon aggregation, the benchmark average annual maintenance costs per kilometre in Nigeria stands at ₦143,182,853.55, while the average annual per-km maintenance costs attributed to HGV traffic is ₦101,385,881.57. Hence, the corresponding per- equivalent single axle loads unit cost is ₦4.03. This figure represents the damaging benchmark cost of overload per equivalent single axle loads (ESAL) on the Nigerian road. This should describe the basis for the penalty for excessive axle-load violations on Nigerian road. For a sustainable road maintenance practice, we recommend that the government set up an agency for enforcing dimension, weights and axle load controls on the Nigerian roads. The damaging cost of excessive axle-load is quite enormous. Revenue accruing from enforcement fines by such an agency will contribute immensely to the cost of Road Maintenance and also boost job creation. It should be a uniformed agency of government with a police unit for enforcement. This agency will man the weighbridges nationwide and will also have duty post in all manufacturing factories, quarries, other mining sites and seaports in Nigeria who will compulsorily be made to install weighing stations at the exit of their loading points.
5. Conclusions
Heavy Goods Vehicles have been used mainly for moving goods, and other allied goods. The high-grade vehicles vehicle miles travelled generated by the road freight activities in Nigeria causes notable damage to the highway, which conversely results in more recurrent maintenance schedules and eventually more traffic congestion. A careful examination of HGV-related highway maintenance costs will be helpful for the determination of economical transport modes for goods and related trades in Nigeria. It will also help the Federal Ministry of Works & Housing to evaluate highway maintenance burden and to set up maintenance priorities.
Data Availability Statement
All data used in the paper can be made available on request.
Conflicts of Interest
The authors declare no competing interest.
References
| [1] | Oyekanmi, O. J., Ibe, C. C., Ebiringa, O. T., Ejem, E.A. 2020a. "Analysis of the Extent of Overloading on Nigerian Highways." International Journal of Transportation Engineering and Technology. 6 (1), 22-29. |
| [2] | Oyekanmi, O. J., Ibe, C. C., Ebiringa, O. T., Ejem, E.A. 2020b. "Estimation of the Impact of the Overloaded Truck on the Service Life of Pavement Structures in Nigeria." International Journal of Traffic and Transportation Engineering, 9(2), 41-47. |
| [3] | Federal Republic of Nigeria (2018). Official Gazette: Federal Highway Act-Control of Dimensions, Weights and Axle Load of Heavy Duty Goods Transport Vehicles Regulations, 18(105). |
| [4] | Afolayan Olaniyi and Abidoye, Abdulmumin Olalekan 2017. Causes of Failures on Nigerian Roads: A Review. Journal of Advancement in Engineering and Technology, 5(4), 1-5. |
| [5] | Bushman, R., Berthelot, C., Taylor, B. 2003. Commercial Vehicle loading in an Urban Environment, Paper presented at the Emerging Technologies in Traffic Operations Session of 2003. Annual Conference of the Transportation Association of Canada St. John's, Newfoundland and Labrador. |
| [6] | Santero, N. J., Nokes, W., Harvey, J.T., 2005. Virtual Weigh Stations: The Business Case. Institute of Transportation Studies, University of California, Davis, Research Report UCPRC-TM-2005-03. |
| [7] | Bai, Yong; Schrock, Steven D.; Mulinazzi, Thomas E.; Hou, Wenhua; Liu, Chunxiao; and Firman, Umar 2010. Estimating Highway Pavement Damage Costs Attributed to Truck Traffic. Final Reports & Technical Briefs from Mid-America Transportation Center at the University of Nebraska – Lincoln. 55. |
| [8] | Li Z and Sinha KC 2000. A Methodology to Determine the Load and Non-Load Shares of Pavement Repair Expenditure. Joint Transportation Research Program, Purdue University, West Lafayette, IN, USA, Report IN/JTRP-2000–09. |
| [9] | Mulyono, A.T., Parikesit, D., Antameng, M., Rahim, R., 2010. Analysis of Loss Cost of Road Pavement Distress due to Overloading Freight Transportation, J. Eastern Asia Soc. for Transp. Stud., Vol.8, 706-721. |
| [10] | Podborochynski, D., Berthelot, C., Anthony, A., Marjerison, B., Litzenberger, R., Kealy, T. 2011. Quantifying Incremental Pavement Damage Caused by Overweight Trucks, Paper prepared for presentation at the Effects of Increased Loading on Pavement Session of the 2011 Annual Conference of the Transportation Association of Canada, Edmonton, Alberta. |
| [11] | Archilla AR and Madanat S (2000). Development of a pavement rutting model from experimental data. Journal of Transportation Engineering, ASCE 126(4): 291–299. |
| [12] | Martin T.C. 2009. New deterioration models for sealed granular pavements. Proceedings of the Institution of Civil Engineers – Transport 162(4): 215–226. |
| [13] | Prozzi JA and Madanat S. 2004. Development of pavement performance models by combining experimental and field data. Journal of Infrastructure Systems, ASCE 10(1): 9–22. |
| [14] | World Bank and FMT 2008. Axle Load Paper and Review and Update of design Standards for Federal Roads, Nigeria, Federal Government of the Republic of Nigeria. Report on the Axle Load Paper by SSI Engineers and Environmental Consultants (Pty) Ltd. South Africa T01.IBU.000064, submitted to the Federal Ministry of Transportation (Works). |
| [15] | Alison C and Walton MC 2010. A road pricing methodology for infrastructure cost recovery. Proceedings of the 89th Annual Meeting of the Transportation Research Board. TRB, Washington DC, USA. |
| [16] | Tolliver, D. and HDR Engineering Inc. 2000. Benefits of Rail Freight Transportation in Washington: A Multimodal Analysis, Appendix C. Washington State Department of TransportationAxle Load Paper by SSI Engineers and Environmental Consultants (Pty) Ltd. South Africa T01.IBU.000064, submitted to the Federal Ministry of Transportation (Works). |

 Abstract
 Reference
 Full-Text PDF
 Full-text HTML