-
Paper Information
- Paper Submission
-
Journal Information
- About This Journal
- Editorial Board
- Current Issue
- Archive
- Author Guidelines
- Contact Us
International Journal of Traffic and Transportation Engineering
p-ISSN: 2325-0062 e-ISSN: 2325-0070
2021; 10(1): 1-9
doi:10.5923/j.ijtte.20211001.01
Received: Jan. 11, 2021; Accepted: Jan. 21, 2021; Published: Jan. 25, 2021

Driver Alertness Comparison Using BCI Data between the Voice-Based Arithmetic System and Traditional Audio and Visual Alerts
 Abstract
 Reference
 Full-Text PDF
 Full-text HTML
Jerone Dunbar1, Kiana Alikhademi1, Isabel Laurenceau1, Ben Lewis2, Juan E. Gilbert1
1Computer & Information Science & Engineering, University of Florida, Gainesville, United States
2Department of Psychiatry McKnight Brain Institute, University of Florida, Gainesville, United States
Correspondence to: Kiana Alikhademi, Computer & Information Science & Engineering, University of Florida, Gainesville, United States.
| Email: |  |
Copyright © 2021 The Author(s). Published by Scientific & Academic Publishing.
This work is licensed under the Creative Commons Attribution International License (CC BY).
http://creativecommons.org/licenses/by/4.0/

About 36,550 people lost their lives in vehicular accidents caused by unresponsiveness and drowsiness in 2018 [1]. Despite advancements in driver-assisted technologies and some automobile industries’ attempts to design technologies to alert drivers in a monotonous driving environment, there is a lack of relevant technology that notably improves driver alertness and engages drivers. We develop a Voice-Based Arithmetic System (VBAS) to engage drivers using simple arithmetic questions. During experiments, participants drove in a simulated driving environment to compare their drowsiness using the proposed VBAS versus traditional audio and visual alerts. Variation in brain signals was captured using a Brain-Computer Interface device to detect drowsiness levels. We analyzed the video recordings of sessions to compute the blink and yawn rate of participants. Participant sleep data from the night before the experiment was recorded using a Fitbit Alta. This research highlights the potential of similar technologies that can improve the alertness of drivers. According to both alpha and theta brain signals, participants were less drowsy after using the VBAS than traditional audio and visual alerts. Mitigating the drivers’ drowsiness is a critical step in decreasing the number of associated crashes and fatalities. The Voice-Based Arithmetic System has the potential to engage drowsy drivers longer than audio and visual alerts and help reduce the likelihood of drowsy-driving related crashes.
Keywords: Warning systems, Brain Computer Interfaces, EEG, Drowsiness, Drowsy Driving
Cite this paper: Jerone Dunbar, Kiana Alikhademi, Isabel Laurenceau, Ben Lewis, Juan E. Gilbert, Driver Alertness Comparison Using BCI Data between the Voice-Based Arithmetic System and Traditional Audio and Visual Alerts, International Journal of Traffic and Transportation Engineering, Vol. 10 No. 1, 2021, pp. 1-9. doi: 10.5923/j.ijtte.20211001.01.
Article Outline
1. Introduction
- Drowsy driving accounts for 36,560 deaths by accidents on U.S. roadways in 2018 [1]. According to Powell et al. and Verster et al., drowsy driving can lead to the same consequences as individuals driving while intoxicated [2,3]. A study conducted by the National Highway Traffic Safety Administration shows that approximately 168 million people have reported driving while drowsy, of which 103 million have admitted to falling asleep behind the wheel at least once [1]. Many systems, such as the Mercedes Benz COMMAND System, BMW's Driving Assistant, Volvo's CoPilot, and General Motors Super Cruise, are designed to caution the drivers using audio/visual alerts to help prevent accidents [4-6]. Research has shown that these alerts result in frustrating the user and temporarily raise their awareness [7,8]. The effects may become non-existent as drivers become accustomed to the alerts, and some stop noticing them [9,10]. Additionally, even though autonomous vehicle research has been ongoing for several years, it is unclear how long before widespread adoption of these vehicles, that would eliminate the issues associated with the majority of drowsy drivers in the near future. A plethora of factors have been noted in the literature that continue to delay autonomous vehicle implementation and widespread adoption such as infrastructure changes, network security, legal implications, human acceptance, among several others [7]. Therefore, this research proposes a Voice-Based Arithmetic System (VBAS) that keeps drivers continuously engaged. VBAS uses a series of simple arithmetic problems to increase or sustain the driver's attention in a hands-free-eyes-free manner. The difficulty of the arithmetic questions increases over time as the driver uses the system. This research utilized user studies to investigate the efficacy of the VBAS system versus audio and visual alerts. The contributions of this paper to the field are as follows:• Develop a simple arithmetic system using a set of interactive dialogue, prompts, and questions to engage drowsy drivers. • Compare the efficacy of arithmetic systems versus traditional audio and visual alerts.• Highlight the potential of future technologies to improve the alertness of drowsy drivers.
2. Related Work
2.1. Drowsiness Detection and Manipulation
- Mercedes Benz's COMMAND Driver Assistance System, BMW's Driving Assistant, Volvo's CoPilot, and General Motor's Super Cruise are current industry interventions that aim to engage drivers and lower the chance of fatal accidents due to drowsiness [4-6]. The Attention Assist System within the Mercedes Benz COMMAND creates a baseline of the driver's behavior. This system attains data from numerous external parameters (e.g., amount of time driving, lane deviations, vehicle speed) to determine the driver's drowsiness level [6].When the system predicts drowsiness, it shows a coffee cup on the dashboard as a visual alert and plays a beeping sound as an audio alert to suggest that the driver take a break. [11]. BMW's attention system also uses audio alerts based on the driver's steering behavior [5].The Intellisafe system within Volvo’s Co-Pilot uses a set of features to predict if the driver needs a break or not. This system also provides directions to the closest location where drivers could stop for a break. Research has also been done using artificial intelligence, facial recognition, and eye-blink rates to predict drivers’ drowsiness levels [4,12].Most of the systems currently available to users suffer from their alerts' temporal nature, which sends a signal anywhere from 15 minutes into a drive up to around 90 minutes, depending on the system [5,6,11]. Due to the length of time between alerts, there will be a high likelihood the driver becomes drowsy or even falls asleep before the next audio/visual alert. It is vital to couple these systems with or provides alternative technologies that can help keep the driver engaged until they arrive at a safe place to take a break. Alternative methods are even more critical considering that drowsy drivers are not always able to immediately pull over due to construction, tunnels, bridges, and highways without shoulders, among several other possibilities.
2.2. Brain-Computer Interfaces
- The electrical activity produced is representative of the brain’s mental state. Specifically, using a Brain Computer-Interface, a non-invasive device that records data through electroencephalography (EEG), alpha (8-12Hz), and theta (4-7Hz) wave values can be recorded. BCI devices have been one of the leading technologies used in sleep studies to track theta and alpha waves’ changes, correlated with drowsiness [13-17]. Dunbar, Lewis, and Gilbert evaluated the EMOTIV Insight, Emotive Epoc, and MUSE against the Karolinska Sleepiness Scale (KSS) in measuring the driver’s drowsiness [18]. The consumer-grade BCI devices were shown to be a better measure of drowsiness than the KSS. An example of a non-invasive dry electrode BCI device used in the experiment is shown in Figure 1.
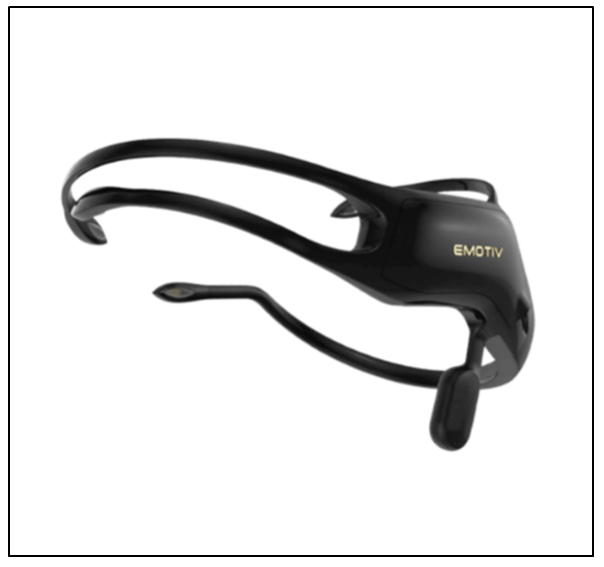 | Figure 1. EMOTIV Insight 5 Channel Mobile EEG. Photo Credits [34] |
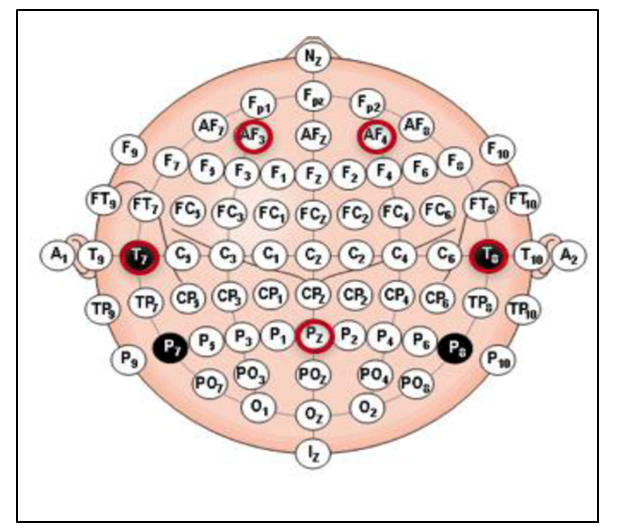 | Figure 2. Channel Locations of the EMOTIV Insight in the 10-20 international system identified by red circles |
3. Voice-Based Arithmetic System
3.1. System Design
- The Voice-Based Arithmetic System (VBAS) design and development are based on prior research on driver distraction and drowsiness. Arithmetic problems are presented to drivers to engage and ultimately increase their alertness. The questions’ overall difficulty is set at a third-grade level that reaches a wider population of users. Additionally, only single-digit operations were considered for this system to limit the driver’s cognitive demand who could already be drowsy [20-23]. Only questions with whole-number answers are asked. Within the overall difficulty, there are two levels of complexity for the problems. The first focuses on even and odd numbers, such as “Please identify the even number from the mentioned numbers; the numbers are 1,3,4,5 and 9.” The second level focuses on the use of either addition, subtraction, multiplication, or division. This could be a question such as “What is 9 times 3?” These types of single-digit arithmetic questions have been identified in the literature to engage drivers and improve alertness without severely impacting driver performance [20-23]. Figure 3 visualizes the initial data flow chart of the voice system design for both levels.
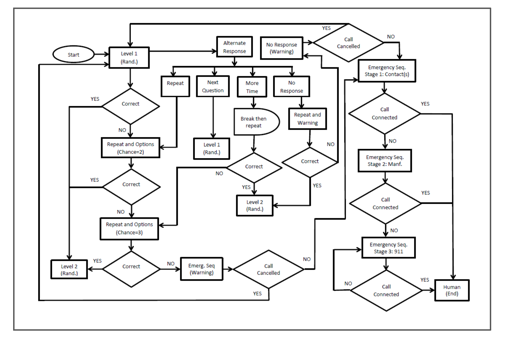 | Figure 3. High-level VBAS System Flow |
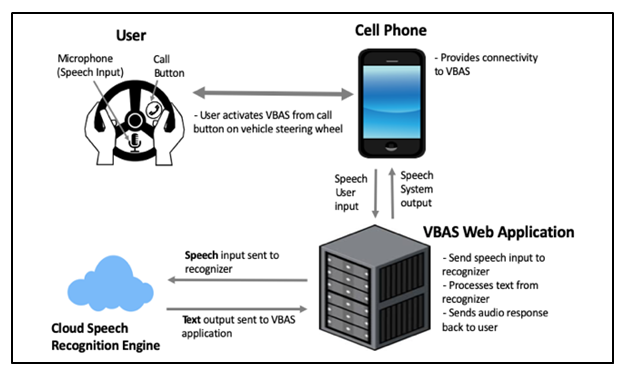 | Figure 4. VBAS architecture diagram |
3.2. System Implementations
- VBAS was connected to Google’s speech recognition engine, one of the most widely known and stable speech recognition engines available for public use [26]. Additionally, Google’s recognition engine speed is high, which enabled the VBAS to respond to the user in less than one second. Users interact with VBAS through a voice interface. However, researchers can use a visual web interface incorporated in VBAS to observe questions asked and the driver’s responses along with the confidence value computed by the system. The confidence level is a speech-to-text assessment of how confident the system is about recording the user response correctly. This visual interface allows the researcher to examine how the system is performing and restart or relaunch if necessary. A key benefit to the visual web interface is that it can show the researcher what the system processed as a user response. One error identified during testing that occasionally occurred was that the speech recognition would sometimes interpret when the user said “four” as the word “for.” Many factors affect recognition, such as background noise, microphone volume level, and user’s accent, among other factors. However, word accuracy errors rarely occurred and did not necessitate additional modification of the VBAS after an extensive amount of testing.
4. Methodology
4.1. Research Question
- This research focuses on the research question and hypothesis noted below:• RQ: Can the proposed VBAS engage drowsy drivers more effectively than traditional audio and visual alerts in a simulated driving environment?ο H0: Participants are more engaged using VBAS in comparison to traditional audio and visual alerts.ο HA: Participants are less engaged using VBAS in comparison to traditional audio and visual alerts.Researchers aim to assess how the use of two different technologies impacts driver drowsiness. Dunbar, Gilbert and Lewis found brain waves as a feasible indicator of drowsiness during the simulated driving experience [18]. Therefore, we test our hypothesis using the BCI data attained by an Emotive Insight.
4.2. Participants
- Prior research in the literature closely related to this research recruited around 20 participants [13,27,28]. Recruitment of 20 individuals was planned, with 18 completing the full study protocol. From these 18 individuals, seven identified as male, and eleven identified as female. Participants were recruited by emails sent to various departmental email lists across a university. Participants aged from 21 to 32, with a mean age of 26 years old. 39% of participants were between 21 and 24 years, 17% between 25 and 28 years, and 44% between 29 and 32 years old. Among the participants, 17% were Caucasian/White, 39% were Black/African American, 28% were Asian, 11% were Hispanic/Latino, and less than 5% were African. Participants were recruited from high school to Ph.D./MD level, while most were pursuing or obtained a graduate-level degree (M.S., M.A., MD, or Ph.D.). As this study's main focus was on drowsiness, participants who regularly slept less than an average of 6-8 hours were screened out. All participants were required to sleep for only 5 hours the night before the experiment, verified by a Fitbit Alta device.Most participants, or 72%, noted English as their first language, while the remaining 28% listed English as their second language. All participants were fluent English speakers regardless if English was their first language or not.
4.3. Procedure
- This research complied with the American Psychological Association Code of Ethics, and the Institutional Review Board approved it at the University. The participants were given a copy of the consent form at the beginning of the study. Before starting each experiment, the researcher discussed the study's details, answered any questions that the participant had, and checked to see if the participant provided the consent to move forward. After verifying the agreement to participate, participants completed a pre-survey to gather basic demographic information, vehicle information, experience with audio/visual alerts, and driving assistant systems. The researcher then assisted the participant with the mounting and calibration of the BCI device to ensure it functioned properly. The calibration step was crucial as it varied based on the participants' hair texture, hair volume, head size, and head shape, among many other factors. Participants completed a five-minute practice session to get acclimated with the driving simulator environment. All participants drove for 30-minutes on a monotonous simulated roadway before interacting with the audio and visual alerts or VBAS. The first 15-30 minutes of driving without interacting with current audio/visual alerts or VBAS was used as control data for all experiments. The Lane Change Test (LCT), shown in Figure 5, was used by the participants in this study to simulate the driving experience [29]. The LCT is a three-lane monotonous simulated driving environment, which requires drivers to change lanes based on 18 designated signs while maintaining a consistent speed of 60 km/h (maximum speed permitted by the software). As shown in Figure 5, the lane change signs are outlined by two cross signs (X) and an arrow, which shows the direction of the lane change. LCT has 9 tracks in total, which were randomized between participants to reduce the learning effect. During the experiment, participants used a track different from what they used in the training phase. Participants were tested using audio/visual alerts, the VBAS in separate trials. Additionally, prior drowsy-related studies suggest that, on average sleep-deprived participants exhibit a drowsy state within 20-45 minutes of monotonous driving [18, 27,30,31]. Dunbar, Gilbert, and Lewis used the driving simulator for 45 minutes to assess if BCI is a better indicator of drowsiness than the Karolinska Sleepiness Scale (KSS) survey [18]. Considering the minimum time for alerts from the automotive industry and approximate time to a drowsy state from prior literature [5,6,11], the first audio and the visual alert was provided at the 30-minute mark and the second at the 45-minute mark for the audio and visual alert experiment. The audio and visual alerts for the experiment were analogous to what is currently used in Mercedes Benz Attention Assist [11], shown in Figure 6.
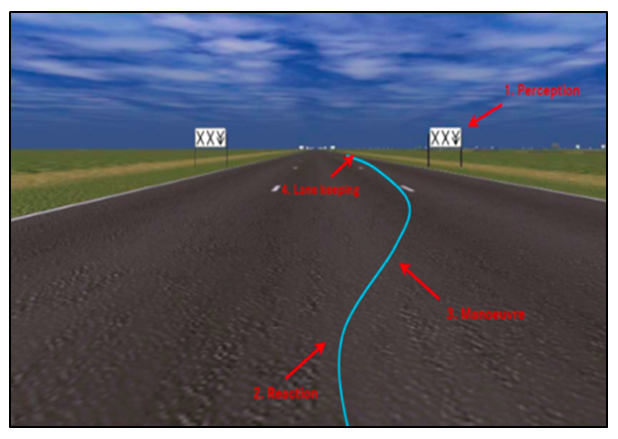 | Figure 5. The driving simulation made by LCT [29] |
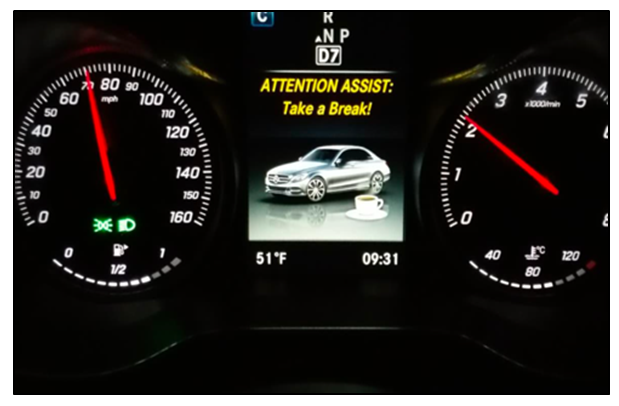 | Figure 6. 2015 Mercedes Benz Visual Alert Notification [11] |
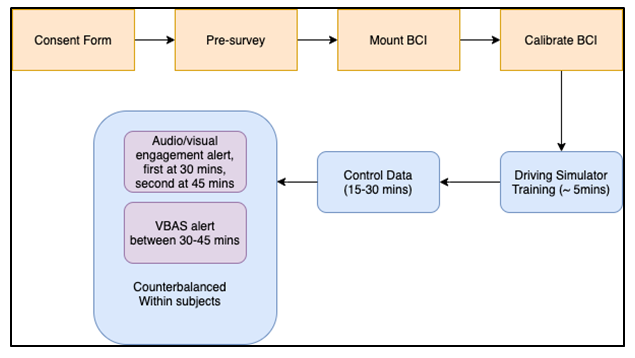 | Figure 7. Experiment steps for VBAS and Audio/Visual alert experiment |
5. Results and Discussion
5.1. Sleep Data
- Through all studies, participants were required to sleep for only 5 hours the night before the experiment, not consume any caffeinated or energy drinks, and not take any medication that could impact their alertness state at the time of the experiment. Participants needed to wear the Fitbit Alta given to them the day before the experiment to record their sleep time.In addition to the Fitbit data, participants were subjectively queried about the amount of sleep they had. For the audio/visual alert experiment, the minimum self-reported sleep time was 4 hours, 42 minutes, the average time was 5 hours and 1 minute, and the maximum time was 5 hours 20 minutes. The self-reported sleep results were similar in the VBAS condition, with a minimum of 4 hours 0 minutes, an average of 4 hours 57 minutes, and a maximum of 5 hours 30 minutes. This self-reported data was an additional data point if there were issues with the Fitbit data or the unlikely case where participant drowsiness could not be fully validated. From the audio/visual alert condition, the minimum time that participants actually slept based on the Fitbit data was 3 hours 44 minutes; the average was 4 hours 44 minutes, maximum was 6 hours 26 minutes, with a standard deviation of 49 minutes. The Fitbit sleep data for the VBAS condition had a minimum of 2 hours 41 minutes, an average of 4 hours 55 minutes, a maximum of 6 hours 20 minutes, and a standard deviation of 59 minutes. Only one participant (P-19) slept more than one standard deviation above the mean in audio/visual alerts condition and the VBAS condition; however, in both conditions, that participant exhibited signs of drowsiness, which was evident from the blink and yawn rate data explained in the next subsection.
5.2. Blink and Yawn Rate Data
- The blink and yawn rate from all participants was captured using a high-definition Sony camera. Based on prior research, participant drowsiness can be determined from blink rate data if there is an eye closure for more than five seconds or two or more yawns within eight minutes [24,32,33]. A researcher could Identify drowsiness from yawn rate by examining the video data via playback recording for visual signs of airflow from the chest to the throat and through the participant’s mouth, where the participant’s mouth was slightly or completely open. Once the researcher visually determines that air came up through the participant’s throat, it was coded as a yawn. An additional researcher examined this video data for the audio/visual alerts and VBAS conditions to ensure that coding remained consistent. In the cases where coding of a participant’s drowsiness state did not match, a third senior researcher reviewed the data, and the final results were determined by consistent coding between at least two of the three researchers. Due to the small number of participants, it will be challenging to implement or validate an automated blink/yawn detection software, which could be a feasible option for larger experiments.To validate drowsiness based on the blink and yawn rate, the 15 to 30-minute time segments of video data were examined to identify whether the participant was drowsy in the control study before interaction in the audio/visual alert or the VBAS conditions.Based on the parameters of this experiment, if the blink and yawn rate passed a certain threshold for participants during that 15 to 30-minute time frame, it was highly likely that participants were drowsy. Using the audio/visual alert technology and the VBAS technology, 72.22% and 77.78% of participants were drowsy, respectively. Only a small number of participants were deemed not drowsy: 27.78% in the audio/visual condition and 22.22% in the VBAS condition. However, these results do not fully verify that this small number of participants were not drowsy and could mean that they were not drowsy enough to be defined as drowsy from a blink and yawn rate perspective.
5.3. BCI Data
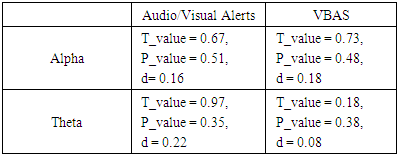
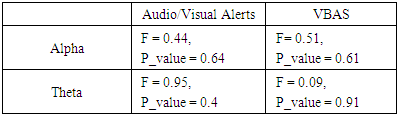
- BCI results obtained during the control data, during the intervention, and after the driving experiences indicated no statistically significant differences in either alpha or theta measures while using the audio/visual alerts or the VBAS. Even though we cannot reject the null hypothesis, we examined the mean EEG values across both alpha and theta were across the control data, the audio/visual alerts, and the VBAS. Prior research found that drowsiness is closely related to an increase in alpha and theta values [14-17]. The alpha and theta values in the control data are considered as the baseline (equal to zero) in Figure 8.
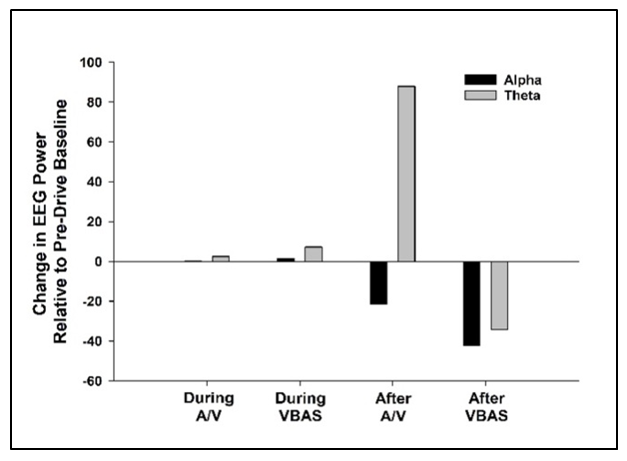 | Figure 8. Changes in EEG values during the Audio/Visual (A/V) and VBAS experiments. The control data was used as a baseline to depict changes in values during and after the intervention |
|
|
6. Limitations
6.1. BCI Challenges
- There is no standardized value for BCI measures to determine the drowsiness state for all users while driving. A possible method of detecting drowsiness is to observe participants during several sessions with high fidelity medical-grade BCI devices. However, using a medical-grade tool is less practical for a driving environment. Another concern with BCI devices is acquiring BCI signals from users with thick hair. Research has been specifically aimed at this challenge; however, most available commercial BCI devices still have data acquisition issues [19]. The decision to use the Emotive Insight was driven partially by this challenge and reduced the data collection issues attributed to BCI devices.
6.2. Driving-related Challenges
- Different levels and types of noise in the environment may impact the results of an experiment. Even though we played the roadway noise through speakers in the experiment room, this research was conducted in a room close to a classroom with a different noise type than long monotonous roadways. Also, simulated driving environments lack the continuously changing variables and unpredictability of a realistic driving scenario. Based on the circumstances of all the experiments conducted in this work, it would be unethical and potentially dangerous to include drowsy drivers in a real and naturalistic driving environment. A simulated controlled driving environment was most useful, safe, and applicable for this work based on these conditions.
6.3. Sleep-related Challenges
- The majority of participants were undergraduate or graduate students. A sample with users who have different sleep patterns than this group may yield other results. Conducting this study with varying populations of age could be an exciting future research opportunity. Participants needed to be sleep deprived before arriving at the experiment location. The researcher's role in delineating the 5-hour strict requirement to participants during the pre-experiment meeting was crucial. The Fitbit Alta device used to record sleep duration may not be entirely accurate but could act as a sleep monitoring mechanism for participants. Participants were also shown the BCI device that would be worn the day of the study, which was an added mechanism to encourage participants to wear the Fitbit and follow the 5-hour sleep requirement.
7. Conclusions
- Mitigating the drivers' drowsiness is a critical step in decreasing the number of associated crashes and fatalities. Many automobile industries have implemented technologies to alert drivers while driving in a monotonous environment, mostly unable to keep a drowsy driver engaged. In this research, a Voice-Based Arithmetic System called VBAS was developed, which uses a multi-level design with arithmetic questions with varying levels of difficulty to engage drowsy drivers. VBAS was compared to the traditional audio and visual alerts, while we used a BCI device and video recordings to understand the drowsiness directionality, and state of participants. The BCI results suggest that participant alertness was the highest following the use of the VBAS, compared to traditional audio and visual alerts. This work's future goals focus on the evaluation of driving performance and usability of VBAS compared to audio/visual signals. The main key points discussed in this paper are as follows:• Design and implementation of Voice-Based Arithmetic System used to engage drivers• Methodology of user studies conducted to assess drivers' engagement• Presentation of result of user studies to show the efficacy of proposed system in engaging drivers while driving including sleep data, blink and yawn rate data, and BCI data