Peter Oluwaseyi Oladotun, Oluwatosin Temidayo Siyanbola
Department of Civil Engineering, Ogbomoso, Nigeria
Correspondence to: Peter Oluwaseyi Oladotun, Department of Civil Engineering, Ogbomoso, Nigeria.
| Email: |  |
Copyright © 2020 The Author(s). Published by Scientific & Academic Publishing.
This work is licensed under the Creative Commons Attribution International License (CC BY).
http://creativecommons.org/licenses/by/4.0/

Abstract
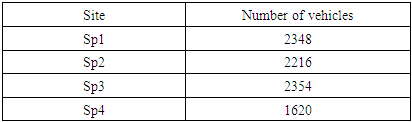
Vehicle emissions are a significant contributor to ambient pollution, especially in urban areas. In general, developing countries experience higher levels of traffic related pollution compared to developed countries due to the lack of pollution control measures. Since numerous studies document adverse health effects from vehicle emission exposure, there is a need for reducing exposure in the developing world. Despite this need, in Nigeria, air quality management is not considered a priority and there is little data on the actual impact of vehicles on air quality and health, and little is being done to control emissions. Ogbomoso, Nigeria, a rapidly developing city, presents a unique opportunity to investigate the impact of transport-related pollution because of lack of other major sources of pollution. Monitoring of ambient hourly concentrations of CO, NO, and SO2 took place at 4 areas during high-traffic hours. These concentrations served as a model of exposure for passengers and pedestrians. Traffic count was done manually, counting the vehicles passing on the road for 15 minutes in every hour from which hourly traffic was calculated. Concentration of SO2 and NO varied from 0.9577-1.0007 mg/l, and 1.0000-2.0004 mg/l respectively as against 0.075 mg/l and 0.10 mg/l of NAAQS. Highest CO concentration was 7.0010 mg/l which falls with the recommended value of 35.000mg/l. Average traffic density varied from 1620 to 2348 vehicles/hr. Clearly, air quality management should be a greater priority in Nigeria as a whole and the effect of vehicle emissions on air quality and health should be studied further if public health is to be protected.
Keywords:
Pollution, Traffic, Concentration, Health effects, Air quality
Cite this paper: Peter Oluwaseyi Oladotun, Oluwatosin Temidayo Siyanbola, Exposure of Passengers and Pedestrians to Air Pollution in Traffic Environment, International Journal of Traffic and Transportation Engineering, Vol. 9 No. 3, 2020, pp. 72-78. doi: 10.5923/j.ijtte.20200903.03.
1. Introduction
Air pollution is defined as the presence ambient environment (indoors or outdoors) of one or more gaseous or particulate contaminants in quantities, characteristics and of duration such as to be injurious to humans, plants or animals life or to property, or to interfere with the comfortable enjoyment of life and property [1]. Seemingly, motor vehicle-related air pollution is an inescapable reality for urban settlers. In Nigeria, for instance, motor vehicles is one of major source of toxic and carcinogenic air pollutants as motor vehicles contribute approximately 80% of nitrogen oxide in the atmosphere. Studies carried out by the Federal Environmental Protection Agency (FEPA) show a moderate-to-high concentration of pollutants such as carbon monoxide, sulphur dioxide, nitrogen oxides, particulate matters and hydrocarbon in the atmosphere. The majority of these come from automotive engines. Further, the two prime pollution problems in Nigeria are emissions from vehicles and particle pollution. Particle pollution is a brown haze and is composed of airborne particles of which 24% are from motor vehicles [2].The physical characteristics and chemical composition of natural gas, gasoline and diesel are not the same in different regions of the world, like benzene, making it complex for the findings in one location to be generalized to other locations [3]. Vehicular emissions and air quality standards in Nigeria due to traffic is believed to have constituted severe health problems especially in urban areas where pollution levels are in increase. Pollution due to traffic constitute up to 90 – 95% of the ambient CO levels, 80 – 90% of NOx, hydrocarbon and particulate matter in the world, posing a serious threat to human health [4].This is a clear indication that vehicle emissions are a major source of ambient air pollution and must be controlled if acceptable air quality is to be assured. In addition, there are numerous health problems associated with high concentration of these pollutants. For example NO2 is responsible for immune system impairment, exacerbation of asthma and chronic respiratory diseases, reduced lung function and cardiovascular diseases. Particulates are dangerous and are linked as facilitators in the development of lung cancer and increase rate of mortality [5]. In Nigeria much attention is given to general industrial pollution and pollution in oil industries, with little reference on the damage of pollution caused by transportation sources [6]. The situation of increased pollution from mobile transportation source is on the increase in per capital vehicle ownership, thus resulting to high congestion on Nigeria city roads and increase in the concentration of pollutants in the air, consequently, increasing health risk to human population. In most developing countries of the world vehicular growth has not been checked properly by environmental regulating authorities leading to increase levels of pollution. Traffic emissions contribute about 50-80% of NO2 and CO concentration in such countries [7].The United Nations estimated that over 600 million people in urban areas worldwide were exposed to dangerous levels of traffic-generated air pollutants [8].On the global sense, [9] arrived at the conclusion that transportation is the major culprit of air pollution accounting for over 80% of total air pollutants.
2. Methodology
The research focused on congested areas of Ogbomoso where heavy vehicular emissions are common. Ogbomoso as shown in Figure 1 is a city located in Nigeria with a population of 861,000, located at 8° 8' North and 4° 16' East. A common characteristic of the congested areas is the presence of heavy flow of transportation. The sample areas were within Caretaker, Seminary, Takie, Apake and Starlite areas. The areas are marked Sp1, Sp2, Sp3 and Sp4 as shown in Figure 1. Each of these sites samples CO, NO and SO2, were monitored. Other parameters monitored includes: ambient temperature, relative humidity, pressure, altitude, wind velocity and traffic count. The four sites have been selected for monitoring in the priority of high population density and traffic congestion.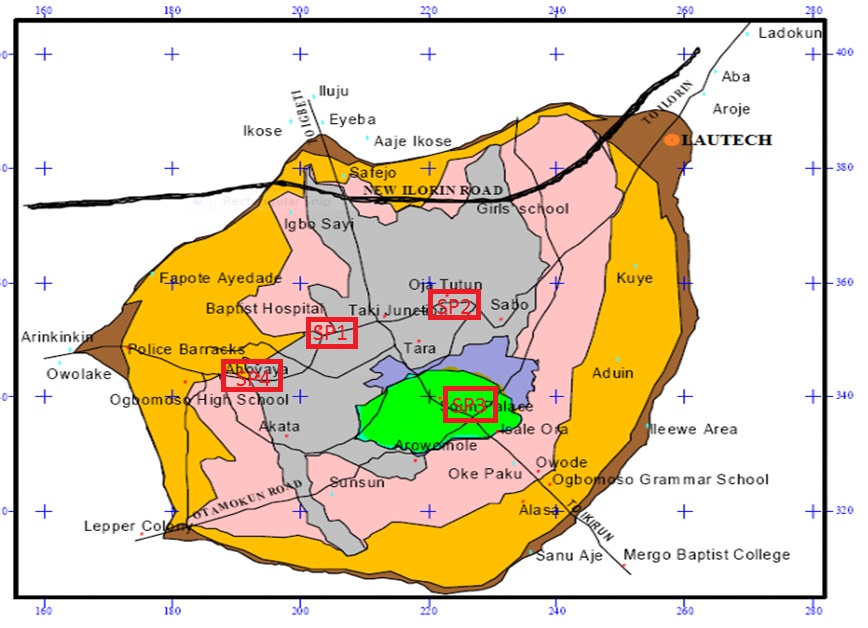 | Figure 1. Map of Ogbomoso Township showing the road network (Source: Ministry of Lands, Housing and Physical Planning, Ibadan, Oyo State. (2006)) |
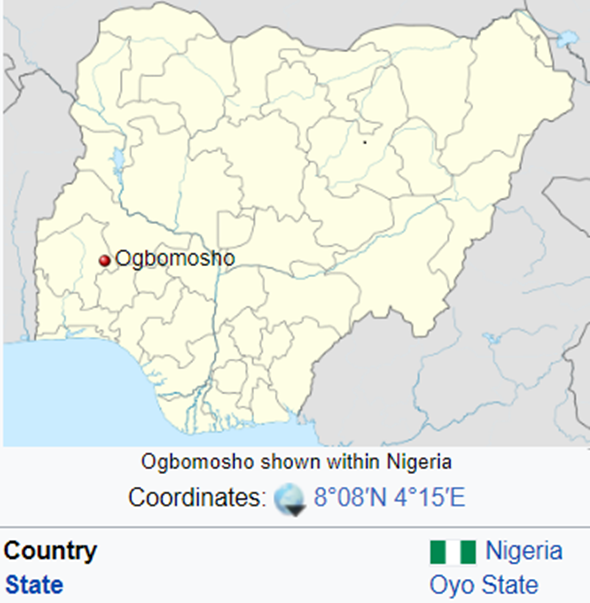 | Figure 2. Map of Nigeria indicating location of Ogbomoso (Source: Wikipedia) |
The procedure carried out in achieving the objectives of this work was related to finding the concentration of pollutant and procedure related to modelling of air pollutants. The CO, SO2, and NO where determined using standard methods. CO was monitored using a portable analyser model 2002, made in USA, in compliance with USEPA method. SO2 was analysed using APM 410 and 415 sampler (model 2001 manufactured by VBU ltd., India). NO was monitored using portable NO analyser. The duration of sampling at each site points was 1 hour.Traffic count was manually done, counting the vehicles passing on the road for 15 minutes in every hour from which hourly traffic was calculated. Basically, three main phases were employed in the modelling which are the theoretical phase, the physical observation and the modelling phase. Theoretical phase involved the process of reading and understanding, reviewing of theories, studying and surveying the SCG model, classification and detection techniques of field data.On the other hand, the modelling phase involved SCG data model coding, simulation, assumptions, and adaptation using MATLAB. The data were provided from the field results and they were formed as explained above. The scale conjugate gradient algorithm in the formula environment was used for the modelling. It has a total of 6 data for each location. The time duration of 10-min interval was set as an input while SO2, NO, CO, Rel. Hum, Temp., Pres., and Wind speed are set as outputs (making eight outputs). The process was divided into 4 partitions which are training, simulation, coding and prediction.The input data were fed to the code alongside their outputs as observed from field locations. This was done so that the computer recognized the pattern in which this input and output were related.
3. Results and Discussion
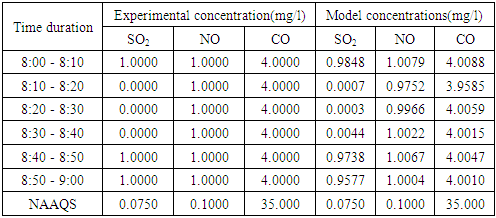
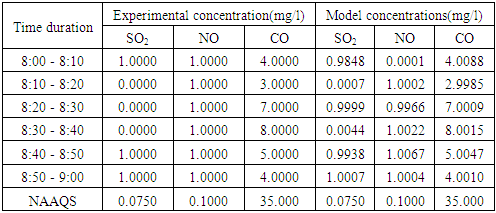
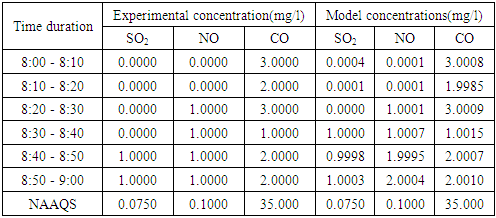
The following Tables show details of the experimental results and the predicted concentrations of the air pollutants for the sampling sites.Analysis of both Tables shows that the concentration of pollutants were beyond the standard limit allowed by NAAQS at the sampling point, except for CO, which is still within the NAAQS limit. For instance, in Table 1, the concentration of SO2 was 0.9577 mg/l, NO was 1.0004 mg/l and CO 4.0010 mg/l from the predicted model while SO2 was 1.0000 mg/l, NO was 1.0000mg/l and CO was 4.0000 mg/l from the experimental result from 8:50 to 9:00 at time zone UTC +1. Table 1. Concentration of pollutants at Sp1 dated 08/08/2010 at time zone UTC+1
 |
| |
|
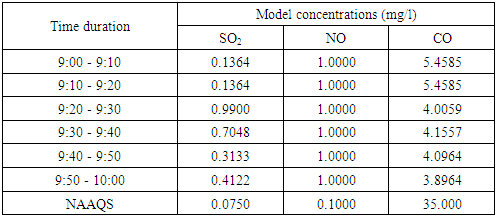
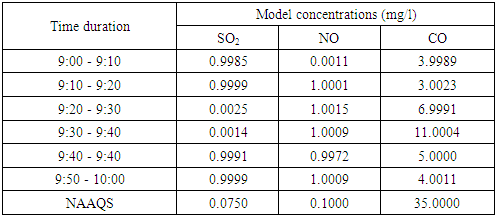
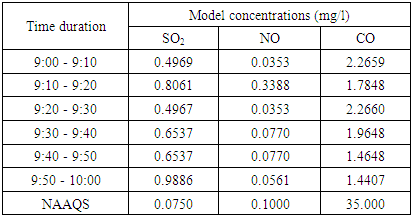
Table 2. Predicted concentration at Sp1 dated 08/08/2010 at time zone UTC+1
 |
| |
|
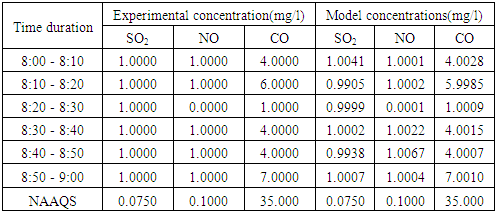
In Table 3, the concentration of SO2 was 1.0000 mg/l, NO was 1.0000 mg/l, and CO was 4.0000mg/l from the experimental result while for the model, the concentration were found to be 1.0007 mg/l for the SO2, 1.0004 mg/l for NO and 4.0010 mg/l for CO from 8:50 to 9:00 at time zone UTC +1. Table 3. Concentration of pollutants at Sp2 dated 09/08/2010 at time zone UTC+1
 |
| |
|
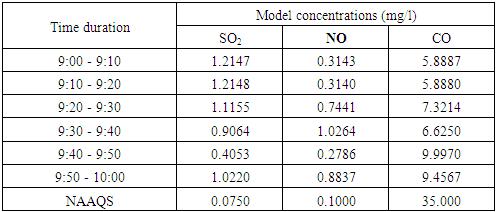
Table 4. Predicted Concentration at Sp2 dated 09/08/2010 at time zone UTC+1
 |
| |
|
Table 5 shows that from the experiment, the concentration of pollutants at the point of discharge were 1.0000 mg/l for SO2, 1.0000 mg/l for NO and 7.0000 mg/l for CO respectively, while from the model, the concentrations were found to be 1.0007 mg/l for SO2, 1.0004 mg/l for NO and 7.0010 mg/l for CO from 8:50 to 9:00 from time zone UTC +1. Table 5. Concentration of pollutants at Sp3 dated 10/08/2010 at time zone UTC+1
 |
| |
|
Table 6. Predicted Concentration at Sp3 dated 10/08/2010 at time zone UTC+1
 |
| |
|
In Table 7, the concentration of SO2 was 1.0000 mg/l, NO was 0.0000 mg/l, and CO was 2.0000 mg/l from the experimental result while from the model, the concentration were found to be 1.0003 mg/l for SO2, 2.0004 mg/l for NO and 2.0010 mg/l for CO. The concentration of SO2 was greater than the NAAQS which is 0.0750 mg/l.Table 7. Concentration of pollutants at Sp4 dated 11/08/2010 at time zone UTC+1
 |
| |
|
Table 8. Predicted Concentrations at Sp4 dated 11/08/2010 at time zone UTC+1
 |
| |
|
Table 9. No of vehicles at the sampling sites (Done at peak traffic period from 8:00am till 9:00am at time zone UTC +1)
 |
| |
|
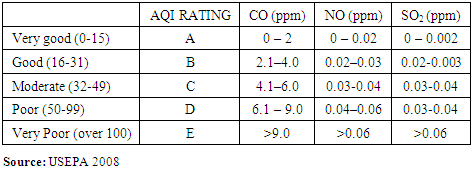
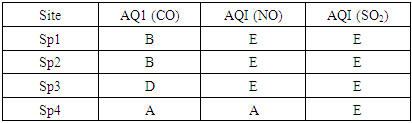
Comparisons between the simulated and experimental result shows that both results are in agreement with each other which prove that air pollutant dispersion can be predicted using the model developed. The mathematical expression developed can, as well, go a long way to control the pollution and the concentration of pollutants at certain region is known, effort can be geared towards preventing further dispersion from point of discharge to the areas yet to be polluted.The results of this research work and the ambient air measurement were compared with the USEPA ambient air ratings shown in Table 10. Obviously, the rating for ambient air quality data summarised in Table 11 indicates that the air quality standard in Ogbomoso is below the USEPA standard for ambient air quality rating.Table 10. Air quality index for priority pollutants
 |
| |
|
Table 11. Summary of AQI rating for ambient air quality
 |
| |
|
4. Conclusions
This study showed that transport-related pollution in Ogbomoso is indeed significant which can have health consequences such as brain damage, impaired perception, weaknesses, fatigue, headaches, nausea, respiratory diseases such as asthma and influenza, bronchitis, emphyxina, chronic lung disease and pulmonary fibrosis.From the results of the model, it is obvious that the aims of this work were to a great extent achieved. The model was developed and used in the simulation of data obtained from the sampled areas. Analysis of the result showed that the model can be used in predicting the amount of air pollutants emitted into the surrounding environment. Without intervention, it is likely that air quality will only deteriorate as the city continues to grow. The government should thus recognize air quality management as a priority and work to prevent further environmental degradation by adopting effective policy, such as targeting high-emitting commercial vehicles. As a whole, Nigeria should work to improve fuel quality through sulphur reduction and adopt more stringent vehicle import requirements and enforcement. Moreover, this research suggests that passengers and pedestrians are at great risk for contracting air pollution associated illness, and their health should be further studied. Hopefully, this study will generate interest and additional research on the impact of vehicle emissions on passengers and pedestrians health in Ogbomoso and other cities, and ultimately inspire a plan for air quality management.Therefore, reducing emissions in commercial vehicles will likely have a significant impact on vehicle emissions overall. Future efforts should focus on longer experimental periods, generating dependable and long-term air quality data, especially documenting seasonal variations, in order to analyze the effects of policy and predict public health impacts. Monitoring should be carried out during the dry season and, if possible, fixed monitoring stations should be set up throughout the city. Monitoring data would be beneficial to determining the long-term effects of traffic on air quality and health, as well as the effectiveness of control measures by analyzing pollution trends. Future monitoring should also be used to calculate pollutant dispersion, so that modelling can be established to predict exposed populations. Once monitoring has been established, it is important to quantify the public health impact of air pollution. Data from hospitals can be used to link admissions and deaths from air pollution to air quality. This can be useful in creating scenarios that project the health benefits of increased emissions control as well as the expected health degradation from increased motorization.
ACKNOWLEDGEMENTS
The authors wish to express our profound gratitude to the members of staff of the Department of Civil Engineering, Ladoke Akintola University of Technology, Ogbomoso, and also in particular, the project supervisor, Dr Osuolale. They rendered high level of assistance during the experimental set up of the research.
Appendix 1
The algorithm developed for predicting air pollutant dispersion is given by:net = newff(p,t,8,{},'trainscg')net.trainParam.show = 50net.trainParam.lr = 0.04net.trainParam.epochs = 500net.trainParam.goal = 1e-5net = train(net,p,t)y = sim(net,p)for i = 1: length (y) disp (y {i}), endp7=[70]p8=[80]p9=[90]p10=[100]p11=[110]p12=[120]y = sim(net,p)y = sim(net,p7)y = sim(net,p8)y = sim(net,p9)y = sim(net,p10)y = sim(net,p11)y = sim(net,p12)
Appendix 2
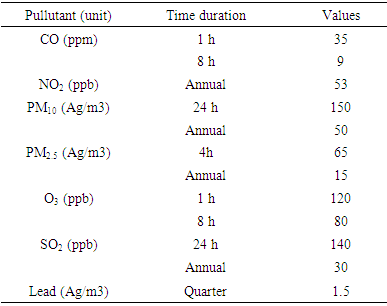
1997 USEPA National Ambient Air Quality Standards
 |
| |
|
Appendix 3
Proposed Method for ProgrammingThere were several stages involved in the proposed model which started from the data input to output. The first stage was the data processing system. Basically in data processing system, data acquisition and enhancement are steps that need to be done. In this project, all the data were collected from the field. The model required converting the data from time function into a format capable of being manipulated by the computer (i.e. interval of 10). The data conversion was done using MATLAB R2007b. Then, the SCG model was developed using MATLAB programming. After SCG model was successfully developed, the prediction of data commenced, as function of 10min interval.The proposed data conversion and simulation method is shown in Figure below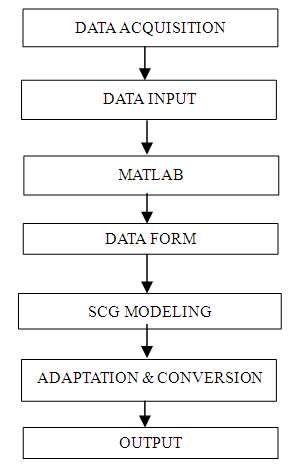
Appendix 4
Data Management and PreparationAs this project fully uses the MATLAB software, it is advisable to know its data management system. To work with m-files and data, all files are placed in a folder included in the MATLAB working path. The working path is a collection of folders where MATLAB searches files when these are called. Any file located outside this path will be invisible to MATLAB.The working path is accessible by clicking the ‘Path Browser’ button in the MATLAB command window, or typing ‘path’ in the prompt. The most practical solution for beginners is to place files in the folder ‘…/MATLAB/Work’, usually the default current directory. Data MiningThe data were provided from the field results and they were formed as explained above. The Scale conjugate gradient algorithm in the NN environment was used for the modelling. It has a total of 6 data for a location. The time duration of 10min interval was set as an input while SO2, NO, CO, Rel. Hum, Temp., Pres., Wind speed, AH are set as outputs (making eight outputs). The process is divided into 3 partition which are training, simulation, coding and prediction. 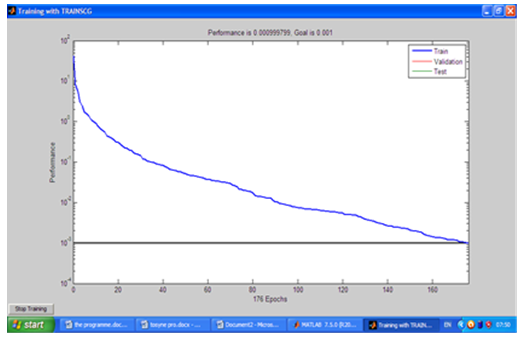 The input data were fed in for coding alongside their outputs as observed from field locations. This was done so that the computer recognizes the pattern in which this input and output were related. After some time, it notifies the trend in which it recognizes them which if it okay by the programmer is selected or re-run in iterative model until a more accurate result is obtained. In this project, the iteration was done 500 times for each location and the results were shown at an interval of 10 mins.
References
| [1] | Odigure, A. (1998). Development of Determining Model for Air Pollutants Concentration. |
| [2] | Federal Environmental Protection Agency (2008). Urban Air Pollution Evaluation by Computer Simulation. Environmental Pollution Control Handbook, FEPA, Lagos pp 62-65. |
| [3] | Verma DK, Tombe KD. Benzene in gasoline and crude oil: occupational and environmental implications. AIHA J 2002; 63: 225 – 30. |
| [4] | Saville, S. B. (1993). Automotive options and quality Management in developing Countries Industrial Environment. 16(1-2); 20, 32. |
| [5] | Schwela, D. (2000). Air pollution and health in urban areas. Reviews on Environmental Health”. 15: 13-24. |
| [6] | Faboya, O.O. (1997). Industrial pollution and waste management. pp 26-35 in Akinjide Osuntokun (ed), Dimensions of Environmental problems in Nigeria, Ibadan, Davidson press. |
| [7] | Goyal, F. (2006). Vehicular Emissions and Air Quality Standards in Nigeria. Information on Respiratory Inflammations in Nigeria (2009). Pg 6. |
| [8] | Cacciola F., Christopher S. Weaver, Michael P. Walsh (2002). Air Pollution from Motor Vehicles. World Bank Discussion Paper No. 349. |
| [9] | Seneca, J. J. & Tausig, M. K. (1994). American bias in environmental economics: Industrial pollution abatement and 'incentives versus regulations' Environmental Politics Volume 7, Issue 2, Pages 134 – 152. |

 Abstract
 Reference
 Full-Text PDF
 Full-text HTML