-
Paper Information
- Paper Submission
-
Journal Information
- About This Journal
- Editorial Board
- Current Issue
- Archive
- Author Guidelines
- Contact Us
International Journal of Traffic and Transportation Engineering
p-ISSN: 2325-0062 e-ISSN: 2325-0070
2020; 9(3): 62-71
doi:10.5923/j.ijtte.20200903.02
Received: Sep. 18, 2020; Accepted: Oct. 16, 2020; Published: Oct. 28, 2020

Drones for Traffic Flow Analysis of Urban Roundabouts
 Abstract
 Reference
 Full-Text PDF
 Full-text HTML
Meriem Brahimi1, Stylianos Karatzas2, Jeremy Theuriot1, Zoi Christoforou2
1CDVIA, 2 Rue Suchet, Maisons Alfort, France
2Civil Engineering Department, University of Patras, Rio, Patras, Greece
Correspondence to: Stylianos Karatzas, Civil Engineering Department, University of Patras, Rio, Patras, Greece.
| Email: |  |
Copyright © 2020 The Author(s). Published by Scientific & Academic Publishing.
This work is licensed under the Creative Commons Attribution International License (CC BY).
http://creativecommons.org/licenses/by/4.0/

The reliability of traffic measurement data becomes an essential prerequisite for road traffic studies, in order to respond effectively to the major challenges caused by the significant growth in vehicle volumes on the road network. Today several techniques are used to obtain these count data, but they have disadvantages such as the limited range of action, sometimes requiring the coupling of several sensors, insufficient processing time, or degradation of the equipment, which requires high maintenance costs for local authorities. Drone technology is quickly accepted as a very dynamic and reliable technique for the collection of detailed and accurate traffic data. The current paper investigates, through a real-life case study in an urban roundabout, the potential offered by drones for traffic measurements in order to overcome certain difficulties encountered by conventional sensors. The counting data from the drones provides ease of processing and a comprehensive view of the operation of the study area. The results from drone videos show relative errors mostly less than 10% and low absolute errors.
Keywords: Traffic flow, Drones, Roundabouts, Comparative analysis
Cite this paper: Meriem Brahimi, Stylianos Karatzas, Jeremy Theuriot, Zoi Christoforou, Drones for Traffic Flow Analysis of Urban Roundabouts, International Journal of Traffic and Transportation Engineering, Vol. 9 No. 3, 2020, pp. 62-71. doi: 10.5923/j.ijtte.20200903.02.
Article Outline
1. Introduction
1.1. Traffic Monitoring Techniques
- The efficient monitoring and control of continuously increasing traffic flows, occasionally concluding into congestion problems, is a critical challenge that traffic operators must face worldwide. Roundabouts provide an alternative traffic management solution considering capacity and safety issues at urban intersections, where a high volume of conflict points arise. A roundabout (also called a traffic circle, road circle, rotary, rotunda or island) is a type of circular intersection or junction in which road traffic is permitted to flow in one direction around a central island, and priority is typically given to traffic already in the junction, hence ensuring a smooth and safe flow of traffic [1].Traffic control in roundabouts has been traditionally performed by using manual counters and observers, induction loops, stationary video recorders etc.Traffic count techniques can be categorized into two types. The intrusive such as pneumatic road tubes, piezoelectric sensors and magnetic loops and non-intrusive, such as which are based on remote observations such as manual counts, passive and active infra-red, ultrasonic and passive acoustic and video image detection. The main drawbacks of these techniques include issues like limited lane coverage, sensitivity to meteorological conditions, inefficiencies due to low speed flows and high maintenance costs. Generally, the main drawbacks of the conventional methods is the limited ‘point’ data they provide, which cannot be used to estimate complex traffic flows as well as the lack of capability to capture the increasing number of hidden points i.e. objects of interest hidden either partially or completely behind other objects e.g. trees, trucks etc. The increase of cameras/sensors as a solution seems to be most of the times unrealistic due to the high cost involved. On the other hand, recent IoT based technologies for traffic management like smartphones and GPS provide big and difficult controllable data [5]. No single detection technology can be considered the most suitable for all applications: each one may have good performance or some limits, depending on various factors and a successful application of a detection system largely depends on proper matching between the established requirements and the technology selection [2] [3] [4].
1.2. Potential Applications of UAVs Technology
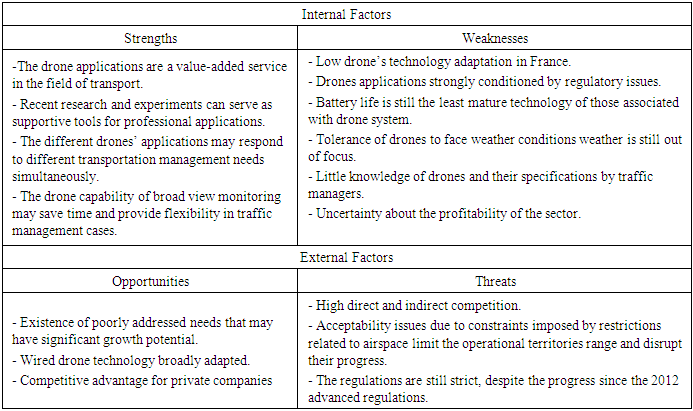
- Recently, Unmanned Aerial Vehicles (UAVs) or drones have been proposed for traffic monitoring, management, and control purposes as an alternative in order to overcome the above-mentioned limitations and shortcomings of current practices.UAVs may be used in several applications in traffic management, including weather and pavement conditions monitoring. UAVs also support emergency vehicle guidance, incident responses, measuring the usage of roadway, monitoring the utilization of parking lots, estimating origin and destination, traveller information, tracking vehicle movements at an intersection, and coordinating among a traffic signal network [6]. UAVs have several advantages over manned vehicles in terms of cost, safety, and time [7]. Based on Karan et al. [8], state Departments of Transportation (DOTs) in the United States have considered the integration of UAV technology for different applications including monitoring the environmental conditions of roadsides, tracking construction projects on highways, traffic safety and management applications, and structure inventory performance for road maintenance. Based on Barfuss, et al. [9] UAV could be used to define different construction zones based on time intervals, aiming at safer transportation throughout the construction projects. In the past few years, UAVs have been introduced in several transportation management applications, mostly being used to observe, analyze and evaluate the traffic flow as well as safety conditions. The use of UAVs could enhance effectiveness of traffic operators [10] by enriching databases for better predictions about congestion phenomena, improving range and speed of intervention at difficult approachable scenes and eventually avoiding accidents, increasing to near real time data collecting and monitoring frequency, providing the ability to cover large areas with a single drone, which is not achievable with a single inductive or pneumatic sensor. However, being a recent technology, the traffic management applications have not yet fully developed. Also, several restrictions issues and limits have to be considered in each case of real application. Internal and external factors that can influence the planned activities should be identified and analyzed when merging of drone technology and road traffic management.One of the highest influencing factors on UAVs applications is the regulatory restrictions. The rules on drones must provide the basic principles to ensure safety, security, privacy and the protection of personal data. On 22 December 2017, EU ambassadors (Permanent Representatives Committee) endorsed the deal concluded with the European Parliament on 29 November 2017 on revised common safety rules for civil aviation and a new remit for EASA. The reform includes the first-ever EU-wide rules for civil drones. It allows RPAs of all sizes to fly safely in European airspace and will bring legal certainty for this rapidly expanding industry. The purpose of the new rules is to create the right conditions so that the EU has the capacity to handle the expected 50% increase in air traffic over the next 20 years, of which a lot is expected to come from the increasing use of drones [11]. The regulatory revisions could be translated as a great opportunity of drones’ technology adaptation in traffic management.This paper presents a framework to evaluate the performance of a roundabout based on determining traffic volume via OD matrices for each leg, providing also valuable insights in the traffic control performance between manual observation, traffic monitoring masts and drones. The experimental data to analyze traffic flow conditions was obtained over an urban compact roundabout situated in the city of the of Villepinte (France). The paper is structured as follows: firstly, the existing literature is discussed concisely. The proposed framework for the roundabout flow analysis is then presented. In the next section, a case study in France is presented to investigate the applicability of the proposed framework and compare the extracted traffic flow measurements. Lastly, a conclusion discussing results, limitations and potential future work is presented.
|
2. Related Work
- Several studies have been carried out to apply drones’ technology in traffic monitoring and various types of drones are used or tested to measure traffic data. Toth et al. [12] studies the quality of traffic data obtained by operating a drone helicopter, and aerial images, without adequate vehicle position sampling due to camera limitations. Puri et al. collects data in real time to monitor traffic, assess and analyze patterns, resulting to measurements statistical error due to drone instability and the limitation of data collection only when drone is in movement [13]. Heinz et al. establishes a high -level awareness of traffic conditions in Urban areas, in which traffic behavior of tracked vehicles is examined in real time [14]. Based on Ro et al. [15], one of the potentials of drones is the enhancement of traffic monitoring. Traditional techniques and traffic monitoring systems are used only for observing simple traffic counts at specific locations, while comprehensive traffic operations are excluded in rural areas, mainly due to cost effectiveness. On the other hand, UAVs appears to be a cost-effective solution that covers rural traffic monitoring requirements. Coifman et al. investigated the application of UAV in traffic flow monitoring on roadways. They developed and implemented several applications for urban areas, by extracting and using data sets collected by UAV, including annual average daily traffic, service level, original destination flows on small networks, intersection operations, and the utilization of parking lots [16]. Zhang and Elaksher introduced research on using a UAV-based digital imaging system to collect efficient surface condition data over rural roads in United States. A technique based on a three-dimensional (3D) surface model was used to measure distress over a road distress area. The evaluation of the case study concluded on reliable and accurate results, proposing a UAV-based digital imaging system of high acceptance rate [17].Kanistras et al. [18] adopt the same approach by synthesizing bibliography of on-board unmanned aerial vehicle applications for traffic management. Zheng et al. develop a UAV system specifically for monitoring driving behaviors to prevent accidents. Based on a diagram, the authors propose a methodology for real-time tracking of vehicles using processing image, and vehicle risk modeling using analysis statistical. However, the main objective of this work is the evaluation of the behavior of drivers and the development of a risk analysis model [19].Errors may occur in detection and tracking of vehicles by drones due to various reasons such as partial occlusions, shadows, nearby objects or false detections. Studies conducted on the method of tracking objects in videos from drones also believe that the errors made during processing are due to the inability of detection of objects whose size varies considerably during their passage or which move too fast [20]. Another study notes that the perspective projection during the formation of the image on the camera sensor results in a loss of information relating to the depth in the image because an image is a 2-dimensional representation of a scene in 3 dimensions, therefore the same object, observed from a camera point of view, can have a very different appearance in the image. Processing software algorithms must therefore be robust in the face of these many situations [21]. On the other hand, some limitations regarding current drone technology have been observed. These include the limited operating time of mini drones. Time of operation of these drones depends on internal and external factors. Internal factors include size, payload, battery type, etc. while external factors include weather, wind and weather conditions directives from the regulatory authorities, ordering the discontinuation of a drone flight for security reasons related to the occupation of airspace [22].
3. The Framework
- The proposed framework consists of 5 steps, all intrinsically dependent and also defined based on each specific study scope and objectives.
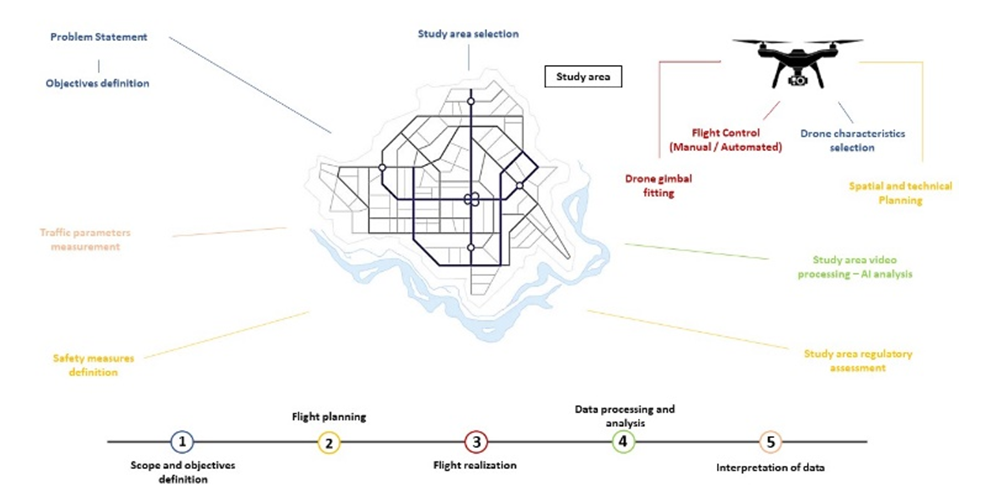 | Figure 1. Framework scheme |
4. Case Study
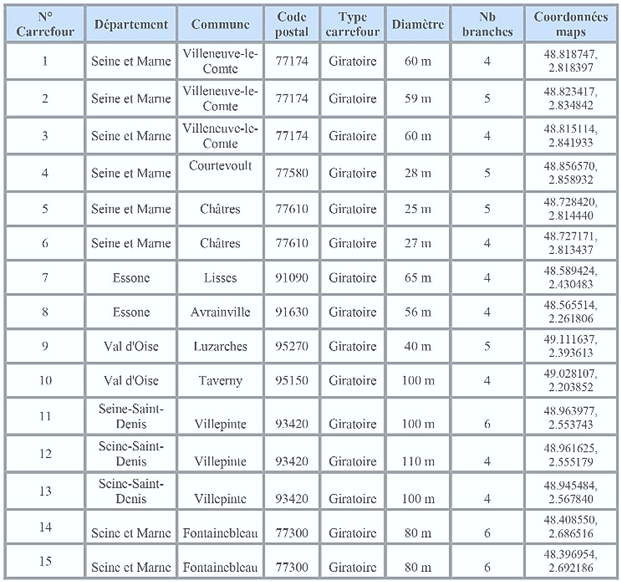
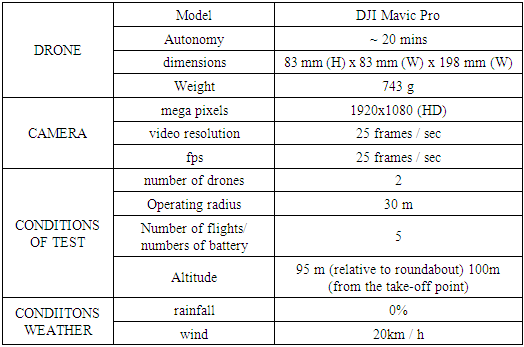
- The main aim of this paper is, by using off the self-equipment, to demonstrate the potential applications of UAVs for traffic analysis and management, particularly in the scenario of urban roundabout flow analysis. In this section, a detailed case study is presented in order to validate the practicality of the UAV-based traffic data collection, processing and analytical framework. The data collected via UAV flights is used for analyzing traffic volume and capacity by generating origin-destination (OD) matrices. During the field test, two different image resolution transmission schemes are performed for comparison and differences identification. The following present a description of the whole experiment and the analytical process based on the proposed framework steps.Scope and objectives definition: The scope of this study is to investigate the applicability of the proposed framework and compare the extracted traffic flow measurements by drones with those acquired by the conventional monitoring masts. During the first step a roundabout that is difficult to be handled using camera sensors or other types of sensors is identified, while also verifying that the drone can perform the overflight operation remaining in the vision area of the operator. The necessary conditions for the smooth running of the experiment are identified:§ The roundabout diameter should be between 70 m and 150 m in order to represent a relatively complex situation to measure flows by using traditional sensors.§ The experiment duration sis set to be a two hours’ time slot.§ To time period is decided for optimal weather and visual conditions, while at the same time reflecting heavy traffic conditions (peak hours).The roundabouts of the different departments of the Île-de-France region are identified as depicted in Table 2.
|
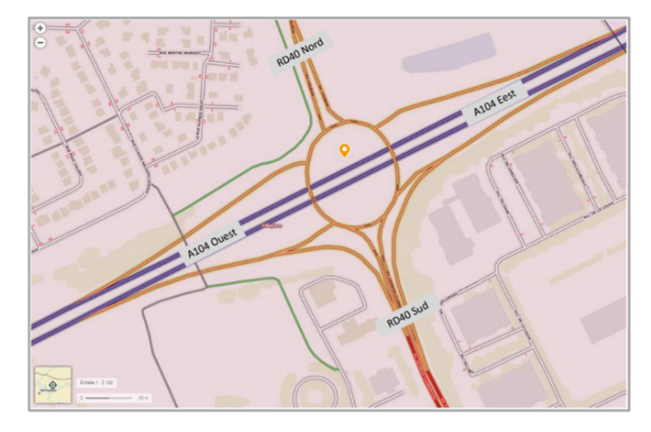 | Figure 2. C1 roundabout - Villepinte (Géoportail) |
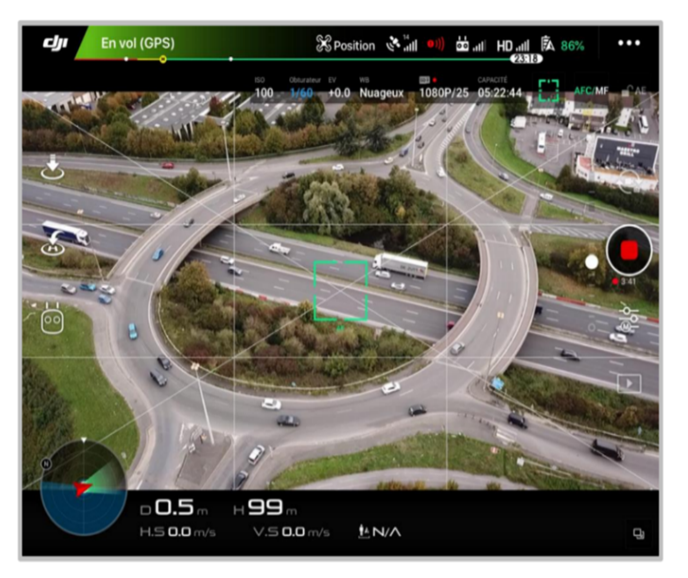 | Figure 3. Study area image by drone |
|
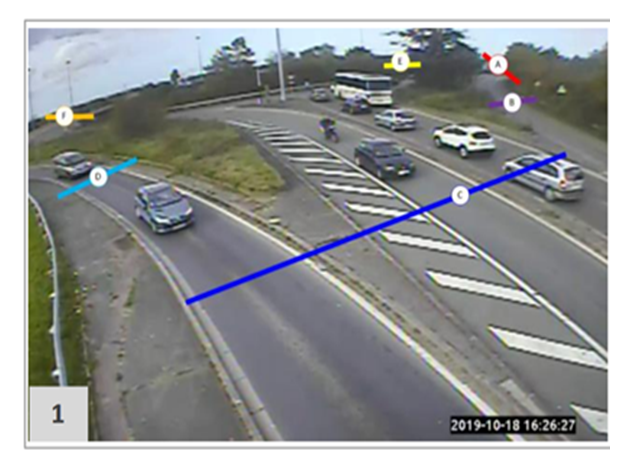 | Figure 4. Images from cameras on counting masts: i) 1-RD40 South |
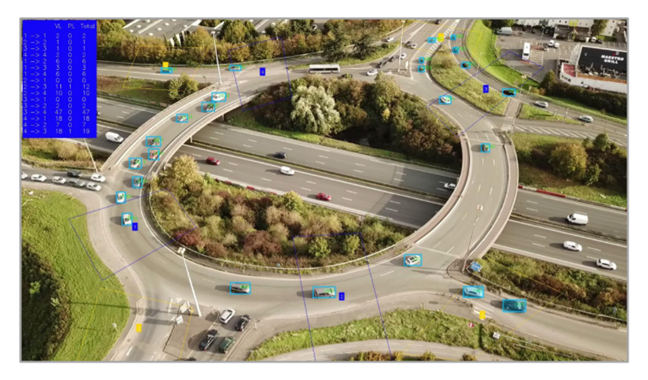 | Figure 5. Image processed by Wintics software |
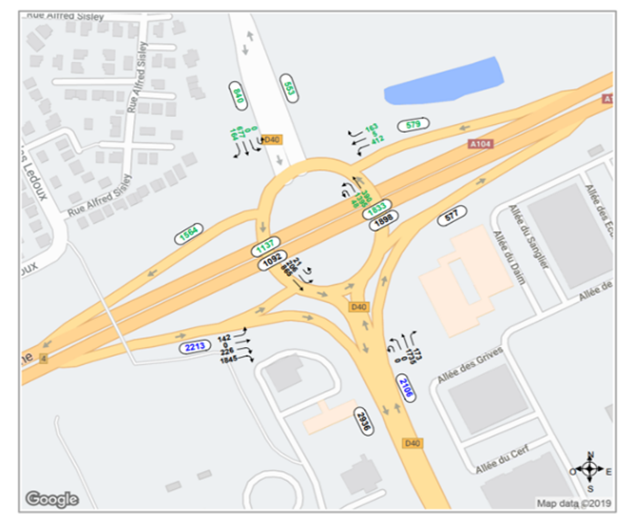 | Figure 6. PCU measurements between 4:40 p.m. and 5:48 p.m.- metering masts equipped with cameras |
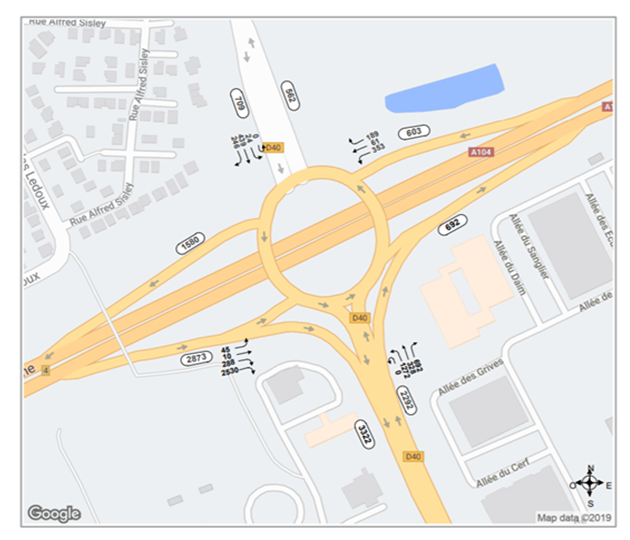 | Figure 7. PCU measurements between 4:40 p.m. and 5:48 p.m.- drones |
|
 | (1) |
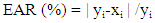 | (2) |
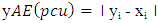
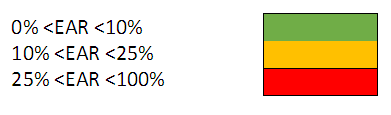 | Figure 8. EAR representation |
|
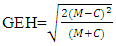 | (3) |
|
5. Discussion of Results
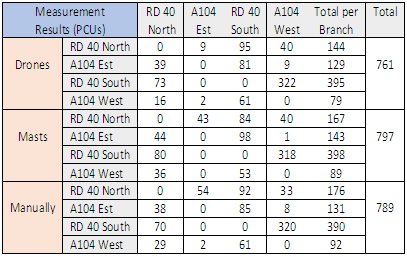
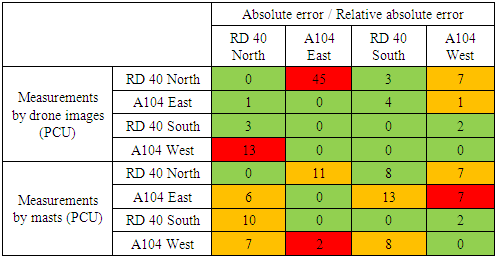
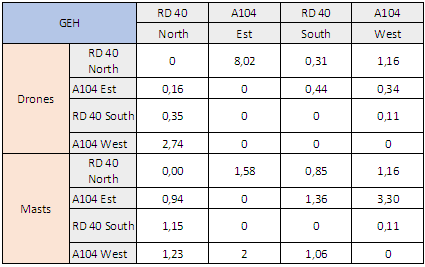
- The traffic data at the roundabout which was acquired by the drone allow estimation of various traffic parameters. In this study, we estimated the flows. The estimated values and the manually counted values were then used to assess measurement error. Overall, the traffic parameters estimated from the data acquired by the drone do not show major errors, and although the processing of the videos was carried out with success there are still some limitations. In order to identify the differences but also the common points between measurement by drone and measurement by counting masts, a list of indicators has been established which serves as basis for comparison presented in Table 7.
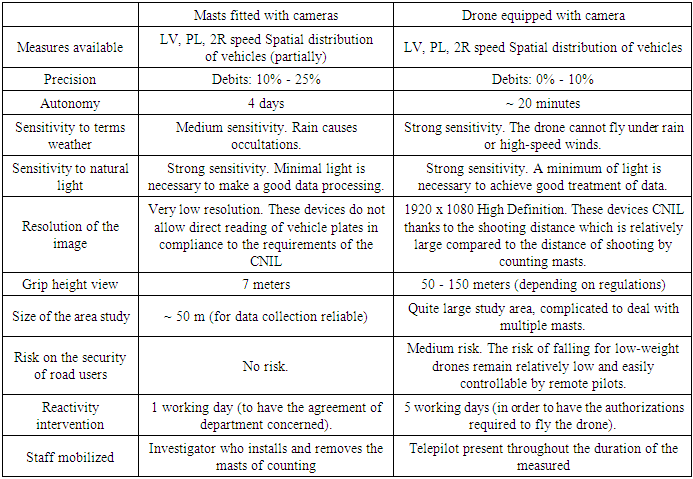 | Table 7. Comparative analysis |
6. Conclusions
- The experimentation test set up as part of this study took place above a roundabout with a diameter of 100 m and six branches at the level of the town of Villepinte in the department of Seine-Saint-Denis. The videos from this measurement were processed using image processing software, the recorded data were compared with the results of the measurements carried out by counting masts fitted with cameras and with the results of manual measurements which represented our benchmark for comparison.At first glance, the results from counting masts fitted with cameras show non-aligned flows because of the large size of the roundabout which forces it to decompose into two crossroads with four branches independent of each other. Consequently, the incoming and outgoing flows on either side of the intersection according to each video have inequalities, which increases the uncertainty on the number of vehicles present on the ring which is estimated on the basis of hypotheses put forward.The technical comparison between the two counting tools made it possible to identify their commonalities and their differences, which enlightened us on the observable limits in the drone use case and guided us towards the consideration of a hybrid method.The limits of the drone system identified can be classified into two categories, the limitations related to drone technology and those related to processing technology. The first one category is mainly represented by the autonomy of mini drones limited to one twenty minutes, this is conditioned by internal factors, size, payload, battery type, and external, weather conditions, wind conditions and the regulations on the occupation of airspace which may be binding and lead to flight interruptions. Limits related to video processing concern vehicle detection and tracking errors which occur following partial occlusions, false detections or even because of variable size of certain vehicles in the image and the angle of view which does not allow view all vehicles in the same way. As such, the algorithms of these tools must be sufficiently advanced and robust in dealing with these complex situations.To conclude, we can say that drone technology is quickly accepted as a very dynamic technology, especially for collecting detailed data and precise traffic information. The maneuverability and flexibility of the system further increase the value of this technology. Advances in technology and regulations will therefore translate through more efficient and safer use, especially for traffic applications road.However, we are observing areas for further study following this study which will allow the acquisition of more in-depth analyzes of this use case of drones. In one first, research can be done to study other counting methods vehicles on large sections of road such as the Origin Destination, indeed such a device could replace the use of cameras for reading license plates. Secondly, studies around other related needs data collection could be carried out to further broaden the scope of possible applications for civil drones. Finally, a study on the use of technology wired would bring significant advancement in the field of research on drones.
Appendices
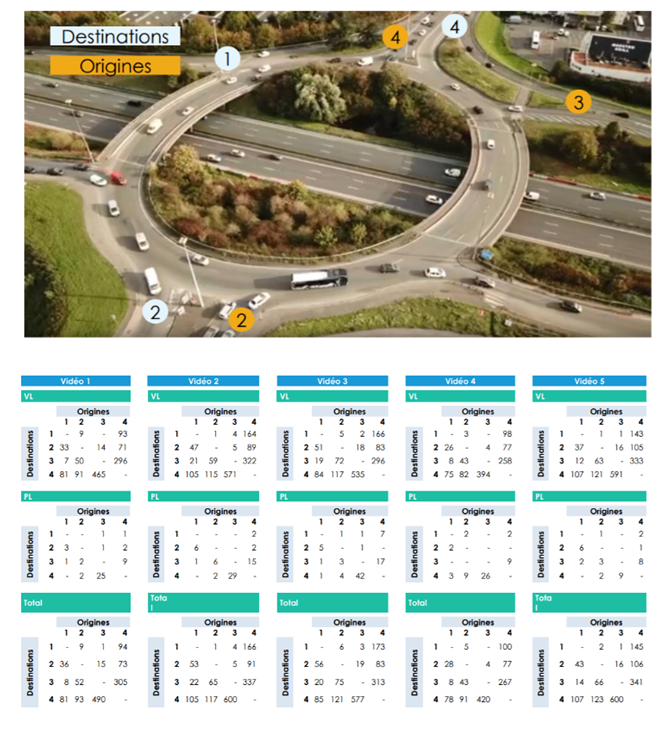 | Appendix 1. Raw results from drone video processing |