-
Paper Information
- Paper Submission
-
Journal Information
- About This Journal
- Editorial Board
- Current Issue
- Archive
- Author Guidelines
- Contact Us
International Journal of Traffic and Transportation Engineering
p-ISSN: 2325-0062 e-ISSN: 2325-0070
2020; 9(1): 16-23
doi:10.5923/j.ijtte.20200901.03

Crash Analysis and Modeling of National Wide Road Traffic Networks in Angola-Africa
 Abstract
 Reference
 Full-Text PDF
 Full-text HTML
Lucas Alcides Paulo Baptista1, Lucas P. Kananay2, Linjun Lu1
1Transportation Research Center, Department of Transportation, Shipping & Logistics, Shanghai Jiao Tong University, Shanghai, China
2Geographer, FAA General, Luanda, Angola
Correspondence to: Linjun Lu, Transportation Research Center, Department of Transportation, Shipping & Logistics, Shanghai Jiao Tong University, Shanghai, China.
| Email: |  |
Copyright © 2020 The Author(s). Published by Scientific & Academic Publishing.
This work is licensed under the Creative Commons Attribution International License (CC BY).
http://creativecommons.org/licenses/by/4.0/

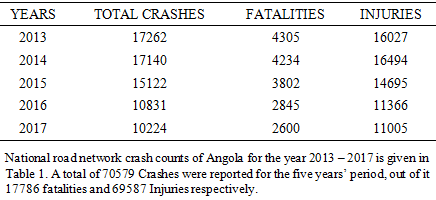
The purpose of this study is to analyze and model the road crashes in Angola at national road wide network and to compare fatalities and injuries in road traffic crashes (RTCs), RTCs have been serious matter around the world and for Africa is a major cause of morbidity and mortality. Moreover, burden on road accidents in Angola makes the authorities taking serious precautions as every year thousands of people face fatality and various injuries, taking consideration of data obtained from a historic road accident of the period of 2013-2017 by the Angolan Traffic Police, a total of 70579 Crashes were reported which led to 17786 fatalities and 69587 Injuries, a Poisson regression model is used to analyze the contributing factors, and Analysis shows that the distribution of road accidental deaths and injuries in Angola Varies according to various types of crash Patterns. The results of this study can be used by National Authority and Ministry of Transportation as an input for formulation insight on road safety recommending general to take appropriate countermeasures for enhancement of traffic safety on national road network.
Keywords: Road Traffic Crashes, Fatality, Injuries, Crash modeling, Poisson regression model, Angola
Cite this paper: Lucas Alcides Paulo Baptista, Lucas P. Kananay, Linjun Lu, Crash Analysis and Modeling of National Wide Road Traffic Networks in Angola-Africa, International Journal of Traffic and Transportation Engineering, Vol. 9 No. 1, 2020, pp. 16-23. doi: 10.5923/j.ijtte.20200901.03.
Article Outline
1. Introduction
- Across the globe the dramatic increase of road traffic crashes (RTCs) have been seen as a serious and worrying phenomenon, leading to innumerous fatalities and injuries, Global Status Report on Road Safety stated that the road traffic deaths have reached 1.35 million people around the world and millions more are injured or disabled every year, with the highest rates in low-income countries and for Africa is a major cause of morbidity and mortality [1]. From the point of view of/for Koptis and Cropper [2] the RTCs have been decreasing in high-income countries while they have been increasing in the low and middle-income (LMIC) countries. Likewise Bishai et al. [3] stated that many Low Income Countries are prompt to high road fatalities and injury compared to wealth countries when some road traffic factors increases, therefore to understand the regional context of the community for the development of Africa in detail, studies carried out by the World Health Organization (WHO) and other bodies rated that mortality from road accidents will surpass various kind of diseases such as: malaria, tuberculosis, and HIV/AIDS and predicts that by 2030 RTC injury will become the fifth leading cause of death worldwide if countries do not consider as a serious matter to be solved [4]. Many developed countries have already been dealing with the reduction of high road crash by implementing many methodologies that researchers have discover throughout the years and there have been a significant reduction when modeling road safety [5], low and middle income countries have a serious/severe crisis not only in economy but as well in RTCs rates that is due to many factors contributing to it, the most frequent are over speeding, non-compliance with traffic rules, as well as driving under the influence of alcohol, but others such as poor road public lighting, poor state of the roads, for this reason there have been witnessing a high number of accidents that could easily be avoided, according to the WHO Global Status Report on Road Safety mortality rate adjusted for each country in the (SADC) Southern Africa Development community can be measured, whose highest rates underlines: Malawi 35.0%, Congo 33.2%, Tanzania 32.9%, Mozambique 31.6%; Madagascar 28.4%, Zimbabwe 28.2%, Lesotho 28.2% and for Angola the source presents the rate 26.9 per 100,000 inhabitants, corresponds to 5,769 dead (+ 1,464) the number of fatalities resulting from road accidents it is a burden to almost everyone [6], this is submitted to the Socio-economic and cultural characteristics of each country, despite the number of crashes in the past 3 years keep reducing but still a lot to work so that they could reach to the level of developed countries. Jacobs and Cutting [7] in their study “Further Research on Accident Rates in Developing Countries” found that African and Asian countries suffer high road traffic crashes (RTC) that is because of the same factors mentioned above that contributes to these road crashes. The purpose of the recent study is to carried out and identify the factors that contributes to high RTCs in Angola respectively, we analyze the data of evolution of the 5 years’ period shows oscillation of accidents, fatality and injuries, but with positive incidences of (reductions) in the years, 2016 and 2017, as can be seen in (Table 1):
|
2. Literature Review
- This chapter consists of literature review of various studies on crash frequency analysis and Identification of factors that contribute in the occurrence RTCs. It was found from the past researches that road crashes generally are caused of different domains most specially this 3 factors 1) Human factors, 2) Road factors and 3) Vehicular factors. The ways in which these factors affect the Road Traffic is dynamic nature and changes with different scenarios faced in the course of transportation, several studies have sought to understand this phenomenon, and the behavior of drivers has been identified as the main cause of accidents as Shinar [8] stated that 60 % of maximum percentage of accidents is related to driver or human errors, in another words human factor are considered to cause comparatively more RTCs compared to others factors. They may generally arise due to poor training in driving schools (practical and theoretical component), poorly acquired driving licenses, low schooling of many motorists and little accuracy in exams (carelessness driving), fatigue and long hour driving (negligence). Others are also related to this crashes are the lack of preparation for night driving, non-compliance with the rules of the Road Code, excessive consumption of alcoholic beverages (drunk-drive) and other drugs that reduce capacity and dexterity. Over speeding is consider one of the main factor which stands for the reckless and careless high speed driving habit of a driver. Therefore, to better understanding the factors responsible for road crashes is mandatory for reducing overall crash rate various studies suggest that over-speeding increases the likelihood of RTF [9,10]. Many efforts have been made internationally in terms of reasonable statistical prediction models of automobile crashes and modeling road safety, the fundamental objective of these prediction models is to evaluate the anticipated safety performance on the road traffic. They even help to determine the candidate sites for maintenance and improvement activities which in turns is evaluated using engineering principles for remedial measures through the results found. The rapid increase in population and vehicular traffic has brought about an increase in the accidents too [2]. In another words an increase in population regularly increases the number of cars in the roadway, past studies related to crashes shows that population is a significant factor to fatalities to an excessive mass of traffic Kopits and Cropper [2] analyzed a data from 88 different countries within the years (1963–1999), stating the relationship between traffic mortality with other two indicators, the motorization rate (V/P) and the fatality risk (F/V, i.e. fatalities per vehicle), Singh [11] showed that population of India is on high scale of to traffic crashes due to the high amount of motorization and the relationship between vehicle ownership rate and fatalities per population. Moreover, to capture the effect of increasing Population with limited resources. Another great/significant factor that researches prove that influences the road fatalities is GDP, Gross Domestic Product mainly measures the monetary value of goods and services produced in a country. Growth in economy tend to results to RTCs fatality rate, although better economy can drive sustainable development in a country, this indicator would have provide better facilities like, good/excellent infrastructures, roads, signalizations, lights, and so many new technologies that would have helped to give enough information and to direct drivers to the right destination, developing countries intensifies there are research efforts on having roads and vehicles safer, this has allowed RTC fatalities and injuries to decrease [12], but LMIC countries most especially African countries struggle to have accurate data, due to this lack of information in several key areas, it may not help to identify the most prominent problems and deep/in-deph study to implement actions to reduce the road traffic crashes, although GDP is the most widely used indicator for road traffic accidents as Kopits and Cropper [13] shows in his research about how motorization rates have grown with income over time for a sample of countries, it can sometimes provide misleading signals as to whether a country is on a sustainable development trajectory. Moreover, the sustained growth of many countries can lead better and reliable when there is better road safety, for Sub-Saharan Africa, gross national does not reflect the depreciation and depletion in road crashes, Bishai et al [3] analyzed a data from 41 countries over the period of 5 years/countries over five years (1992–1996) crashes, through his studies he stated that LMIC are subjected to an increase of injuries and fatalities when GDP per capita increases and for high income countries (HIC) it decreases the road fatalities but for injuries it increases as he used some indicators related such as: numbers of vehicles, oil consumption, population, and Roadway.As mention previously increasing in vehicle are generally understood to be one of the major factors leading to high rates of road traffic accidents, Kopits and Cropper [2] stated that traffic fatality risk and fatalities is the product of vehicles per person(V/P), it always increases with economic growth, no doubts with the increasing amount of motor vehicle, accidents also tend to increase in road traffic due to the concerned of poor technical conditions of vehicles, including brakes, lighting, bad-condition tires, poor vehicle maintenance and poor service of workshops. O’Donnell and Connor [14] made an effort to explore to applied ordered probit model and ordered logit model while using the police reported crash data of 1991 for New South Wales, Australia. The conclusion reveals that older vehicles are relatively more exposed to fatality. In 2005, Khorashadi et al. [15] considered using a four years crash data while developing multinomial logit model for California and they concluded that cars with model year of 1981 or older are more likely to involve in RTFs, for proper enhancement of road traffic safety, both frequency and severity analysis of RTCs are equally important. Numerous efforts have been made to understand the association between explanatory factors; driver and vehicular characteristics, most used statistical approach to investigate the road fatalities associated with commercial vehicles, driver’s driving behaviors and fatigue, seat belt usage, alcohol usage and vehicle mechanical faults were used as explanatory variables in their research. Authors concluded that not using seat belt, vehicle mechanical faults and alcohol usage are the main cause of high number of road traffic crashes. some researchers used different ways to prevent road crashes among them logistic regression used by [16], bivariate models [17], multinomial and nested logit structures [18,15] and discrete ordered probit model [14] are all directly associated with population and vehicle number.Oil consumption is mentioned by many researchers that are significant in road traffic crashes, Antoniou et al., [19] used different methods to understand various economic situation (such as number of vehicles and fuel consumption), his results was not available for exposure, but it was clear that fuel consumption could affect the traffic in one way or another, oil consumption per capita, contribute in many times to traffic deaths and in another hand tends to increases with economic growth [3]. Oil consumption it seems to be a good indicator for researchers to investigate about traffic crash, due to the impact that it has on vehicles and to the economy of a country [20]. Earlier studies also mention of how important its oil consumption is to the population [2].When we consider a crash data we are often certain/confident that are count data models, and through many researcher’s studies we have found many ways to solve crash frequency depending on the crash count data, using different statistical modeling researcher mention Poisson regression model as one of the main tools to solve crash count model, and many others they mention it is a starting point for most statistical models [21-23]. Moreover, the count-data models which have been developed for the crashes frequency that overcome possible over-dispersion and many others factors include; Negative binomial model [24,25], Poisson lognormal model [26,27] gamma model [28] generalized Poisson model [29] and many others models.
3. Data Preparation
- This study is carried out to retrieved a confidential data from the National Road and Traffic Directorate (Direcção Nacional de Viação e Trânsito - DNVT) annual report which are responsible to record the road traffic crashes for the Angola Road wide network, registered motor-vehicles, number of RTCs and consequent annual RTC fatality and injuries based on reported data of last five years (2013-2017), by taking the Average number of crashes in the 2 years’ period, we are to predict the contributing causes and to compare fatalities and injuries in road traffic crashes.
3.1. Road Traffic Data
- The number of road traffic fatalities, injuries and 15 contributing causes variables were summarized from the data as shown in Figure 1 and Figure 2.
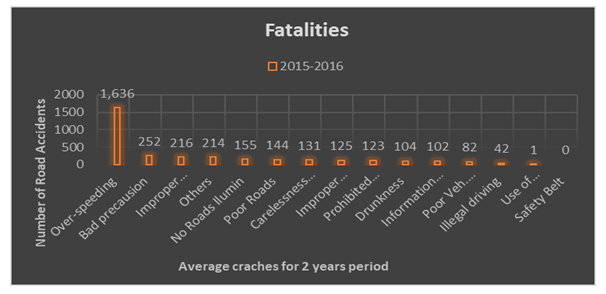 | Figure 1. Frequency causes distribution Trends in Fatalities for RTCs |
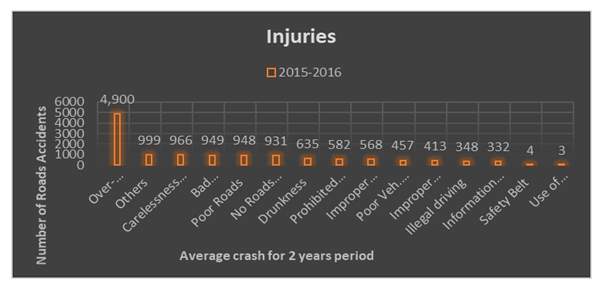 | Figure 2. Frequency causes distribution Trends in Injuries for RTCs |
3.2. Variations and Comparison in Fatalities and Injuries Traffic Flow in Weekdays
- It is known that accident rates increase in Mondays that is the first working day of a week [32]. But/However, for our case its quite different, Figure 3 and 4 shows Fatalities and Injuries During weekday for the year 2015 and 2016, we can trend some differences within the days of the week for both fatalities and injuries, the distribution shows gradually increase in weekdays and on weekend the amount of crashes increases abnormally.
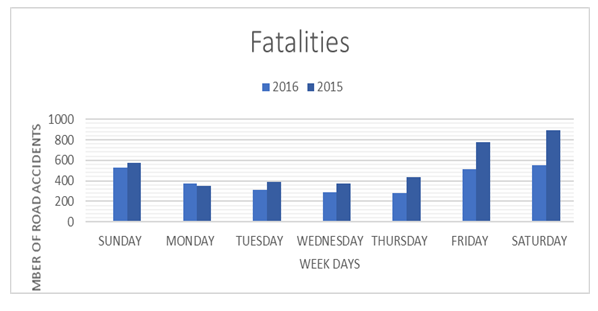 | Figure 3. Distribution of Fatalities Traffic Flow in Weekdays |
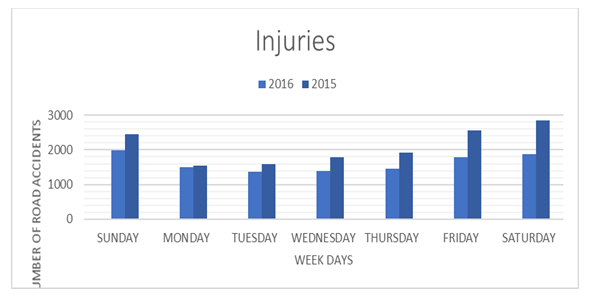 | Figure 4. Distribution of Injuries Traffic Flow in Weekdays |
3.3. Variations and Comparison in Fatalities and Injuries Traffic Flow on Hourly Basis
- The hourly day distribution of the day on which crash occurred are classified into five categories; morning peak (06:00am-12:00pm), afternoon peak (12:00pm-06:00pm) and evening peak (06:00pm-08:00pm) and off peak hours that is (08:00pm-00:00am and to 06:00am) its shown below for both fatality and injury.
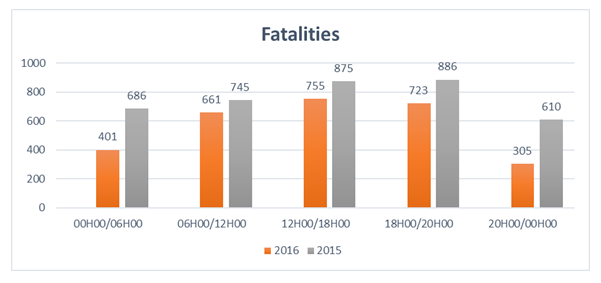 | Figure 5. Distribution of Fatalities Traffic Flow on Hourly Basis |
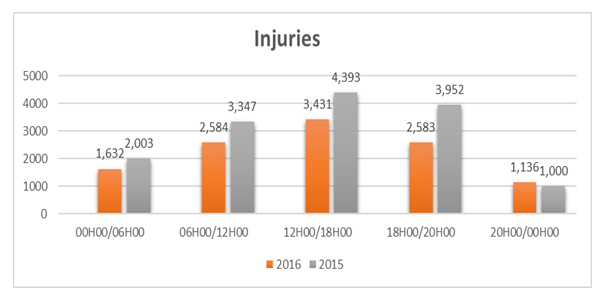 | Figure 6. Distribution of Injuries Traffic Flow on Hourly Basis |
4. Methodology
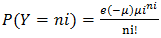
- Road traffic accident analysis mainly include Regression Methods, therefore, to identify the key factors contributing to crash counts in 5 years ‘period we propose a Poisson regression in this respective study, hence it has been proved as a useful and basic powerful tool to analyze non-negative integers count data [38]. Moreover, in this regression its assumed that Y comes from a Poisson regression distribution which associates probability with the year’s given data:To understand Poisson regression for crash frequency analysis [26,39] is expressed as Eq. (1), we need to consider a set of data of a country road network and let us consider n, the number of road crashes as random variable for claiming count during any period “i”.
 | (1) |
 | (2) |
 represents the probability of n crashes occurring in the period i and
  is the expected crash frequency of country roadway
  with mean and variance.
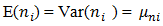 | (3) |
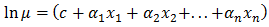
 is a explanatory variables function which is expressed by using a log-linear function.
 | (4) |
 stands for vector term of unknown regression coefficients and can be evaluated by standard maximum likelihood methods [39].
  represents factors affecting crashes (explanatory variables) in period i. To relieve the non- negativity constraint of accident prediction, an exponential rate function e
  is assumed here. In order to check the reliability and degree of confidence in results produced by this methodology, it is considered necessary to validate the model. Hence, in this study, the model validation will be done through sensitivity analysis. The following two conditions shall be satisfied if the model is considered reliable:Condition 1: if the mean of count data is equal to variance then Poisson regression is valid and it will produce accurate results.Condition 2: The influence of over- and under-dispersion in the model can affect the model results and they can be adversely affected by low sample-means and then crashes probability cannot handle through Poisson regression.
4.1. Results and Discussions
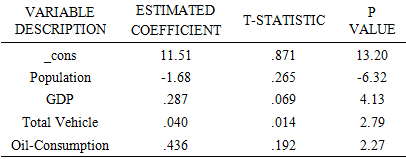
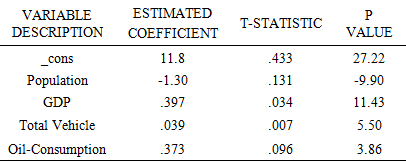
- Road accident frequency model/The estimation results showed that there was a significant difference in the factors that determined Road accident frequencies in both fatalities and injuries, therefore, Poisson regression is nominated as appropriate model and has good technique for modeling crash frequencies, our model estimation states that crash prediction model results are consistent with previous studies. Past studies helped us to understand that the traditional linear regression is not the best approach for analyzing a crash frequency model [40]. Therefore, Poisson regression is more suitable technique for modeling crash frequencies. With the help of statistical model, we are to analyze the factors to the road accident in Angola by estimating a Poisson regression model. only those variables that are significant at 95% level of confidence were retained. Out of 10 variables in the dataset, 4 variables have been found statistically significant (at 95% level of confidence) The details of these models are provided in Table 2 and Table 3.
|
|
5. Conclusions
- This research addresses the issue of high fatalities and injuries rate in Angola due to deficiencies of high traffic crash rate. It started with a deep background of the country road network itself and the factors that influences the RTCs. Moreover, an extensive literature review of road crash factors and road fatality and injury associated with road traffic crash frequency both at national and international level. The review of past international research efforts helped to identify the procedures adopted in different countries for establishing the relationship between road traffic crash frequency and various factors in road crash. For estimation of appropriate statistical model, past 5-years data (2013-2017) from Angola National Road Wide Network were reported by National Road and Traffic Directorate (DNVT), recorded a total of 70579 road accidents in five years, with 17786 dead and 69587 injured. A comprehensive excel data sheet was developed for collation of all crash factors counts attributes for analysis. Similarly, road crash data (accidents data) obtained from DNVT Angola National Police, were collated and recorded for predefined road traffic crash according to type pattern. Numbers of crash frequency models were tried and Poisson regression model was selected based on different statistical tests. Model results revealed that Population, GDP, Total Vehicle, Oil-Consumption are the factor that are significantly associated with road crash frequency. The count-data models which have been developed for the crashes frequency is/are the Poisson regression model which is stated that the variance and mean must be approximately equal. This count data has given positive and significant reason why RTCs are too high, and enough reason about phenomena of population due to the highest crash counts although increased population could increase road crashes but the model results shows the opposite, therefore, due to the limited availability of data and lack of information on the crash pattern we could only make a comparison on the 2 years (2015-2016) period and Analysis show the distribution of RTCs fatality and injuries varies according to different crash pattern and over speeding was found to be the first source of crashes in Angola in both fatalities and injuries. Moreover, the period of (2016-2017) showed positives declines on RTCs these declines were most probably the result of many safety interventions including the enforcement of speed limits, legislation on traffic safety awareness campaigns, police enforcement, improvements in traffic, and media and public education. it still necessary to act on each of them in order to eliminate them or, at the very least, to reduce them, focusing on aspects that prove to be more driver of road accidents. Depending on the results of opinion polls, other technical studies and statistical data of the National Police, legislative or sanctioning, education, prevention, supervision and engineering measures should be given to the results of the opinion, improvements on roads infrastructure, proper illumination and signalization can benefit the drivers and reduce the number of accidents. Changing the risk behaviors (speeding, driving in a state of drunkenness, mobile phone use, driving without a seat belt, dangerous maneuvers), keep the machine in good technical condition and rectify the wrong aspects of the physical environment can also mitigate the numbers of fatalities and injuries.
ACKNOWLEDGEMENTS
- The authors would like to thank Lucas P. Kananay for the contributions on this project, Special thanks are given to DNVT for providing the data for this study.