-
Paper Information
- Paper Submission
-
Journal Information
- About This Journal
- Editorial Board
- Current Issue
- Archive
- Author Guidelines
- Contact Us
International Journal of Traffic and Transportation Engineering
p-ISSN: 2325-0062 e-ISSN: 2325-0070
2020; 9(1): 1-7
doi:10.5923/j.ijtte.20200901.01

Assessment of Health Economic Benefit of Bicycling; A Case Study on Pilot Bicycle Link Summit-CMC in Addis Ababa, Ethiopia
 Abstract
 Reference
 Full-Text PDF
 Full-text HTML
Kibret Gebremedhin Hagos1, Ehitayhu Mesele Hagos2
1Civil Engineering, Wolkite University, Wolkite, Ethiopia
2Department Transportation Science, Hasselt University, Diepenbeek, Belgium
Correspondence to: Kibret Gebremedhin Hagos, Civil Engineering, Wolkite University, Wolkite, Ethiopia.
| Email: |  |
Copyright © 2020 The Author(s). Published by Scientific & Academic Publishing.
This work is licensed under the Creative Commons Attribution International License (CC BY).
http://creativecommons.org/licenses/by/4.0/

Cycling is not popular in Addis Ababa, Ethiopia. In 2015, three bicycle lanes started service in the city for the first time. Although the compatibility of sites for bicycling was studied, the health and environmental impact were not analysed. The objective of this study was to evaluate health economic benefits due to increased physical activity from bicycling from interventions to increase the number of cyclists. Existing situation and two scenarios with different levels of bicycling were considered for analysis. Sensitivity analysis was also conducted considering a 20% variation in demand and cost. The health and economic assessment tool (HEAT V.2.3) was used to estimate the health economic benefit of increased physical activity from cycling. Inputs for HEAT tool were made based on reliable secondary sources and engineering judgment. Results indicate that health economic benefits from bicycling represent 4-20% of investment to encourage bicycling. There was an increase in health benefits related to an increase in the number of cyclists. Wider network intervention was also more sensitive to intervention costs and expected demand. Planners and policymakers are advised to design low-cost interventions and increase the number of cyclists.
Keywords: Health economic benefit, Bicycling, Number of cyclists
Cite this paper: Kibret Gebremedhin Hagos, Ehitayhu Mesele Hagos, Assessment of Health Economic Benefit of Bicycling; A Case Study on Pilot Bicycle Link Summit-CMC in Addis Ababa, Ethiopia, International Journal of Traffic and Transportation Engineering, Vol. 9 No. 1, 2020, pp. 1-7. doi: 10.5923/j.ijtte.20200901.01.
Article Outline
1. Introduction
- Walking and bicycling are vital to make communities sustainable and liveable [1]. They provide zero-emission and health benefits such as ‘fight obesity and reduce non-communicable disease, such as heart disease and diabetes’ [2]. Cycling is free from engine noise [3]. Cities have also improved local economic activities (customers and spending) by increasing business accessibility by bicycling [4]. The pollution, energy consumption and noise reduction effect are particularly true if active modes can replace short trips by car [5]. On the other hand, possible undesirable effects from the use of walking bicycling include road traffic accidents and ‘exposure to surrounding air pollution’ [6]. Though the net impact of active modes is positive at social level [6], benefits could be maximized and users could be encouraged by supporting the move towards sustainable modes with measures that improve traffic safety and cleaner air [7], [8].Bicycling is not popular in Addis Ababa, Ethiopia. A household survey of 2014 indicated a negligible (0.07%) share of cyclists in the city [9]. Though the vast majority of the interviewed residents have the interest to ride a bicycle, only 45% of survey respondents stated their willingness to buy a bicycle and permit bicycling to their family [10]. Skill gap and safety concern are among the reasons for having no interest to ride a bicycle [10], [11]. In 2015, a study was conducted to evaluate the compatibility of different bicycle routes in Addis Ababa [10]. The study was part of the ongoing pilot project on bicycle lane and rental service to encourage cycling [12]. As a part of the project, three bicycle lanes were constructed at Summit, Ayat and Imperial areas of Addis Ababa [12]. The projects costed a total budget of 27million ETB ($935,500). Out of which 7.1 million ETB was used to purchase 210 two and three-wheeled bikes and the rest for building segregated bicycle lanes, parking and store-houses for bikes [12], [Web 3].Following the completion of the pilot projects, most of the bikes and the dedicated bike lanes have stopped giving service and there are few cyclists [12], [Web 3]. Users complain about the price and inconvenience of rental service. Whereas, rental service providers complain about the shortage of spare parts, the difficulty of managing the service and related theft [12], [Web 3]. Lack of maintenance and monitoring and lack of control misuse of bicycle infrastructure is an additional challenge. Field observation indicates bike lanes are misused for parking, walking, illegal trade, blocked by waste and construction materials that force the cyclist to use the vehicle lane and increase crash risk. For the reason that health and environmental impact was not evaluated in the pilot projects, there is little effort to increase the modal share of bicycling. These may create a gap in planning and future expansion of bicycle projects. Accordingly, the objective of this study was to analyse the health economic impact of bicycling projects in Addis Ababa using HEAT online tool. Existing situations and two scenarios with a different number of cyclists are considered for analysis. The study is expected to inform planners and policymakers on the relationship between the number of bicyclists and health benefits for investment decisions.The paper is structured as follows: the next section discusses the review of relevant literature to promote bicycling; the third section presents the method used in the study. The fourth section lists results and discussion. Finally, the last section concludes the paper.
2. Good Practices to Promote Bicycling
- Lessons learned from cities that have successfully increased their number of cyclists could be used as a benchmark to promote bicycling. Effective interventions that improved level of bicycling in Bogota (Colombia) and Seville (Spain) could be applied to other cities [3]. Colombia city was able to increase the modal share of cyclists from 0.58% in 1996 to 9.10% in 2017 [13]. Bogota has passed through a long (>20years) process to effectively increase the number of cyclists [13]. Improving the safety of cyclists, periodic maintenance of bicycling network, effective city-level bicycle sharing system and measures to reduce bicycle theft are four major categories of actions used to encourage cycling in Bogota [3], [13]. Bogota built its first bicycle infrastructure in 1995-97 for recreational purposes [13]. However, built bicycle infrastructure had few users in the first few years [13]. In 2012-15 Bogota also spent on maintenance of existing bicycle infrastructure besides building new on-street/off-street bike lanes to improve network connectivity [13]. Providing a bicycle parking at convenient locations was also used to promote last-mile connectivity to other modes (for example public transport) [13]. Educational campaigns to change the attitude towards non-motorized transport (NMT) and strengthening the system and other measures were used in 1995-97 [13]. The role of advocacy groups and public support were also essential to promote bicycling culture in Bogota city [13]. Concern for traffic accidents may discourage cycling interested road users from riding a bicycle [4]. Reducing the number of cyclists involved in accidents is another measure taken to encourage cycling in Bogota [13]. Cyclists are vulnerability to road traffic accidents and exposure to air pollution [5]. Though the net impact of active modes is positive at a social level, benefits could be maximized and bicyclists could be encouraged by supporting the move towards sustainable transport with measures that improve traffic safety and cleaner air [7], [8]. Campaigns targeting bicyclists to use visibility aids and creating awareness to cyclists about where things go wrong (For example blind spots of long vehicles such as a bus) encourage safe cycling [13].Bicycle theft is another major concern for cyclists. Bogota has used a mobile app to identify frequent bicycle theft locations and allocate the police effort based on this information [13].
3. Methodology
- The study area is located in Eastern part of Addis Ababa, which is the capital city of Ethiopia (Figure 1). The city was home to roughly 3.2 million population in 2017 [14]. Walking in combination with the use of public transport are the dominant (85%) modes of transport in the capital city, Addis Ababa [15]. The city has recently launched a non-motorized transport strategy that includes promoting bicycling as a sustainable alternative mode of transport [15].
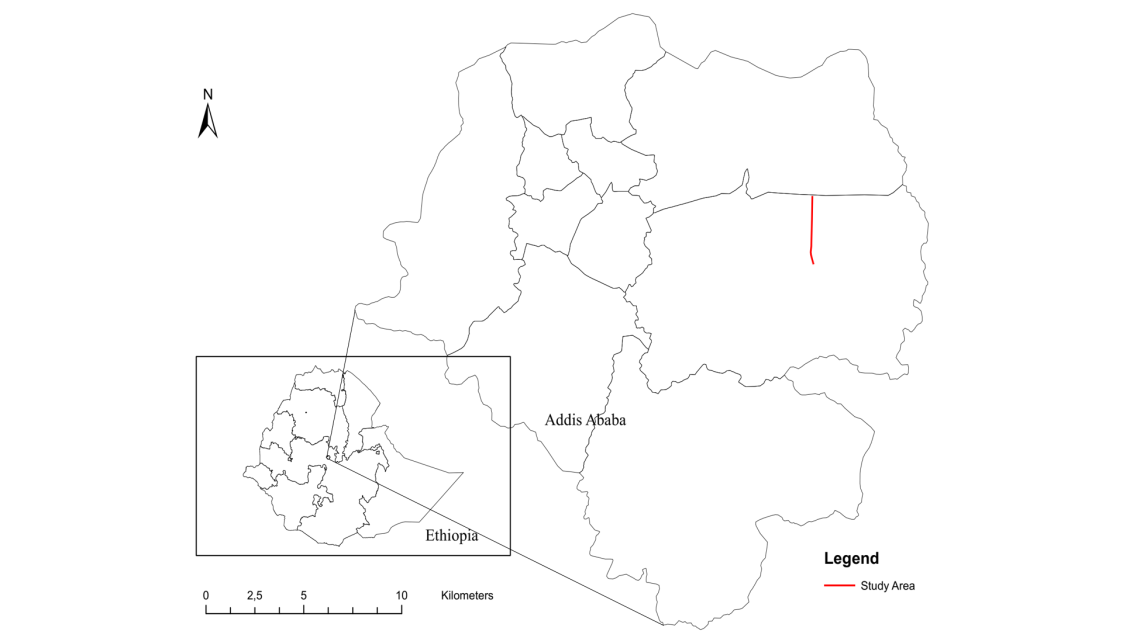 | Figure 1. Location of Study Area |
3.1. Study Bicycle Link
- The study area is a 2.1km bicycle link is located in Eastern Addis Ababa (Summit to CMC). A 1.5m wide segregated bike lane is provided on both sides of the arterial street (Figure 2).
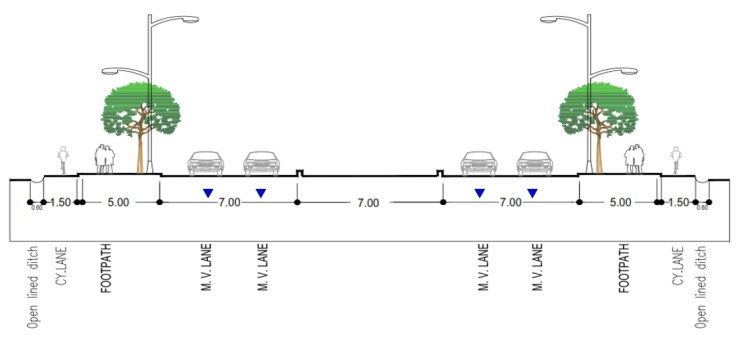 | Figure 2. Section view of CMC-Summit bicycle lanes [10] |
3.2. Analysis Scenarios
- The Base case represents the existing level of bicycle use without any intervention (do nothing) and serves as a reference. A household transportation survey of the study area indicates a negligible 0.05% share of Bicyclist in Bole sub-city, where the study area is located [9]. A field survey conducted on 31/10/2017 indicated no bicyclist in the study area. Hence estimate is made based on the 2014 household survey, which expects 2 bicyclists/day. The first scenario (Scenario I) involves applying 9 interventions that are identified from the literature (Figure 5). The interventions require an additional investment of $48,768.05. Interventions are expected to bring a modal shift of 10% from public transport and increase the modal share of the bicyclist to 6.26%. Consequently, 251 cyclists are expected within the area of influence of 1.92km2 (Figure 3).
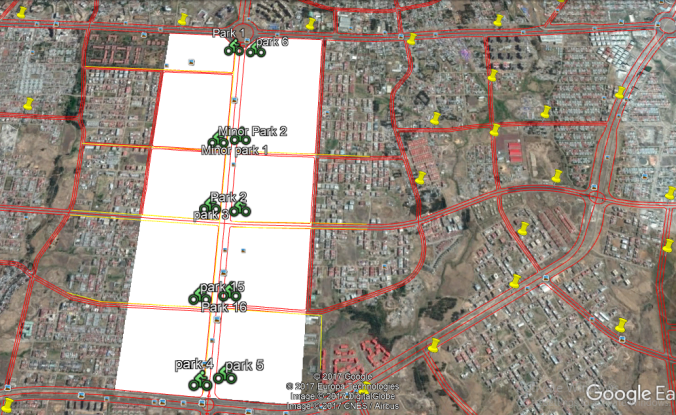 | Figure 3. Proposed area of impact for existing bicycle lanes in Scenario I |
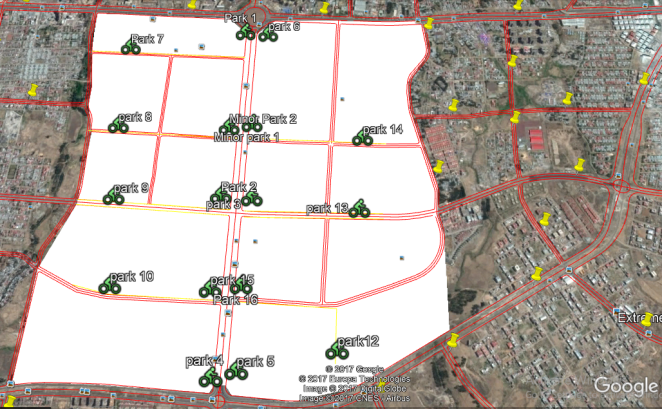 | Figure 4. Proposed area of impact for existing bicycle lanes in Scenario II |
3.3. Build up Period
- Following the completion of infrastructure, time is needed to influence road users’ behaviour and achieve a full scale of walking and cycling [5]. Accordingly, a build-up period of 1 year is used in this paper.
3.4. Age Group
- The HEAT considers only adults (> 20-year-old) because ‘the evidence base for the chronic health effects of physical activity on young people is not as large as that for adults’ [5]. In this study, the age group 20-64 is considered to estimate the health effect. The proportion of population in this age in the study area is 63.3% [9].
3.5. Value of Statistical Life
- Life is certainly priceless and the concept economic valuation of human life raises ethical question [16], [17]. Whereas, most transport appraisals use value of statistical life (VSL) and health experts choose years of life lost or health care costs [5]. VSL is defined as the cost that can be justified to prevent mortality [16].Human Capital Lost approach and Willingness-to-pay approaches are most commonly used methods for estimating VSL. Willingness-to-pay approach is ‘generally accepted as the most valid method for assessment of the value of prevention of road risk’ [16]. Because conducting a willingness to pay survey for individual countries is not practical, an alternative rule of thumb approach is used using regression equation that relates VSL with level of income [16]. This is logical assumption because willingness to pay is also influenced by ability to pay. The health and economic assessment tool (HEAT) also uses a regression equation, based on willingness to pay method and values from comprehensive report by the OECD [5]. The model estimates country specific VSL for the year 2011 considering income (GDP), growth, exchange rates (PPP) and inflation. Though there is a doubt if the equation is transferable (to Ethiopia condition), it is assumed to give fair assumption for reducing mortality risks in the environmental, health and transport contexts as suggested by HEAT model. Accordingly VSL for 2016 (year close to beginning of analysis period) is estimated to be 437,726.3845ETB ($ 20,188).
3.6. Analysis Period
- Economic appraisal is performed over analysis period. Time is needed for health impact of active modes to fully develop [5]. Analysis period of 5 years in studying the feasibility of non-motorized transport in Addis Ababa [11]. The analysis period was assumed reasonable as long term analysis would lead to unreliable outcomes [11]. In this study, analysis period of 5 years (2018-2023) which is the default value of HEAT is used.
3.7. Discount Rate
- Economists apply a discount rate based on the assumption that ‘benefits occurring in the future are generally are less valuable than those occurring in the present’ [5]. Hence discount rates are needed to compare cost and benefits from different times and express in terms of a common unit called the net present value. A discount rate of 11-12% is commonly used by the Ethiopian Roads Authority (ERA). A discount rate of 12% during the study on the feasibility of non-motorized transport in Addis Ababa [11]. Accordingly, a discount rate of 12% is used in this study.
3.8. Cost
- An engineering estimate of infrastructure was based on unit rates at the time of the study. Different online sources and experiences were also used to estimate costs for bicycle parking, bicycle cost and intervention related to campaigns.After an analysis period (5 years), existing infrastructure is considered to require full recycling of the surface layer with a new one. Based on the engineering estimate, replacing requires a total cost of 18.83% of the cost of a new bike lane per kilometre. Accordingly, a salvage value of 80% was applied for new infrastructure to be built in Scenario II.
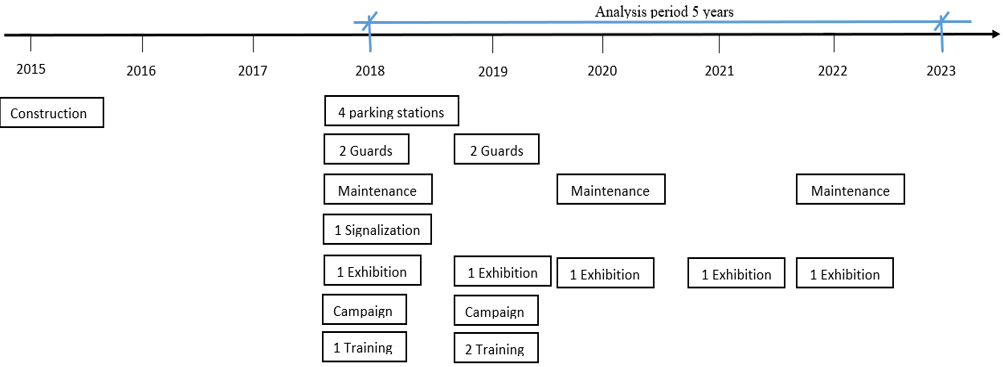 | Figure 5. Interventions matrix for Scenario I |
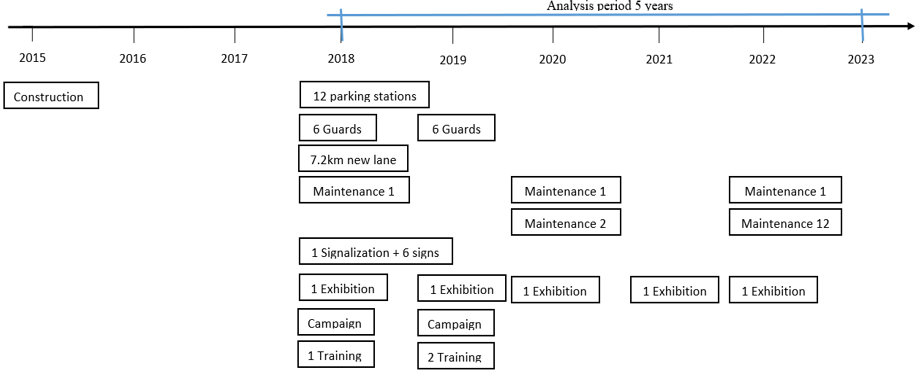 | Figure 6. Interventions matrix for Scenario II |
3.9. Health Economic Impact Assessment Tool
- In this study, the latest HEAT for walking & cycling [Web 2] is applied to evaluate the health impact of interventions to encourage bicycling in the study area (Addis Ababa, Summit-CMC). The health and economic assessment tool (HEAT) is a methodology and web-based tool developed to estimate the health effect of increased physical activity from walking and cycling. The HEAT tool predicts ‘the maximum and the mean annual benefit in terms of reduced mortality as a result of walking or cycling’ [5]. The tool also expresses the health benefits in terms of a monetary unit that can be used in the evaluation of transport projects. The objective is to make an investment in active mode infrastructure more attractive for decision-makers and encourage cooperation between the transport and health sectors [7]. HEAT primarily estimates the protective benefits (reduction in mortality) of an individual based on a certain level of walking or cycling from inputs [5]. The latest version of HEAT can also predict possible risks due to exposure to higher dose pollution and accident and effects on carbon emission. The individual health impact is then magnified to a society level based on the volume of cycling, build-up period, analysis period and mortality rate. The economic equivalent of life saved is finally estimated based on the value of statistical life (VSL) [5].On the other hand, the tool is incomplete from the economic evaluation point of view. The tool does not include positive outcomes such as recreation, reduced travel time, less congestion, less pollution (except carbon emission) and energy-saving. These limitations are also acknowledged and are planned to be inculcated in future HEAT versions [5].
3.10. Sensitivity Analysis
- Though HEAT gives an estimate, best estimates are made with more realistic data. In this study, several assumptions and professional judgments are made to estimate the demand for bicycling and related costs of interventions. Sensitivity analysis is, therefore, necessary to include the uncertainty in estimated values and the future. Separate sensitivity analysis is conducted for cost and demand. Sensitivity analysis with respect to cost includes increasing or decreasing interventions cost by 20% from our initial estimate and evaluate what happens to outcomes of scenarios. Similarly, Sensitivity analysis with respect to demand includes increasing or decreasing the number of cyclists expected in Scenario I and 2 by 20% from our initial estimate and evaluate what happens to outcomes of scenarios. Worst-Case analysis is also performed by decreasing demand by 20% and increasing cost by 20% at the same time. The threshold (20%) is commonly used in the sensitivity study of road projects in Ethiopia.
4. Results and Discussion
4.1. Health Economic Impact Assessment Tool
- The HEAT for cycling [Web 2] is used to evaluate the health benefits of increased physical activity under the base case and two scenarios that apply different levels of interventions to increase the number of cyclists. Outputs of HEAT indicate that a person riding a bicycle 30 minutes a day and 222days a year (4.9 trips/week), would reduce the risk of mortality by 13%. Considering life expectancy in Ethiopia of 62 years [Web 1], this is equivalent to getting an additional 22 days saved per cyclist. Expanding this to the number of cyclists, Scenario II and Scenario I had 0.52 and 0.24 death prevented per year respectively. Scenario II involves expanding bicycling network enabling more people to use dedicated bicycle lanes and get a health benefit from it. This supports the idea that the number of cyclists is vital for health and environmental benefits to be significant at a community level [3].
4.2. Benefit-Cost Ratio
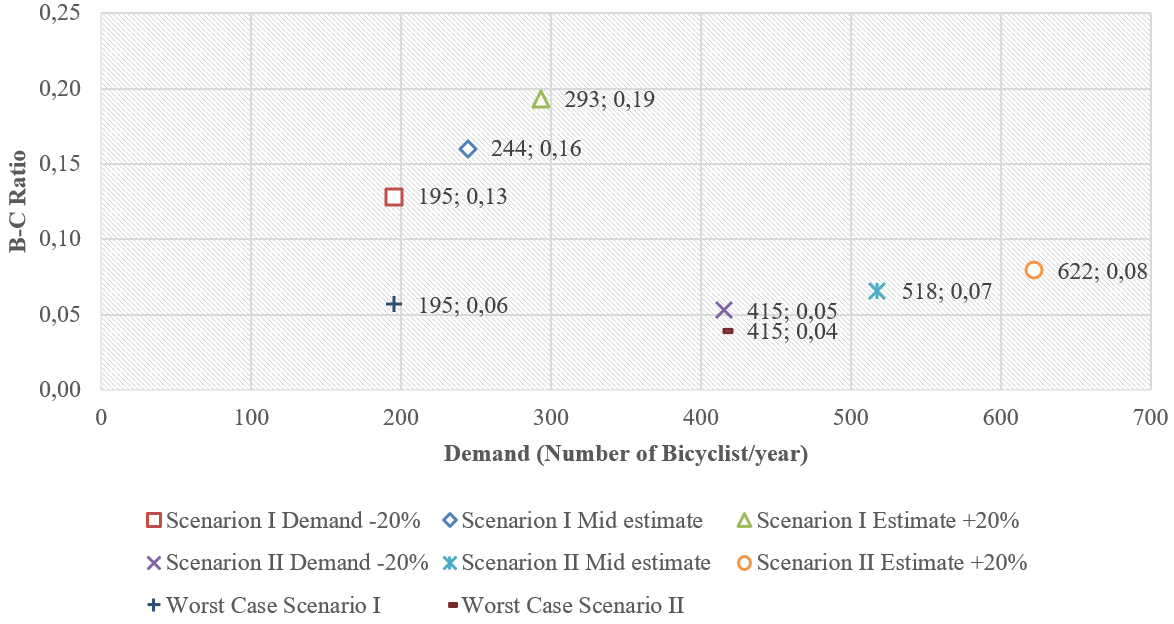
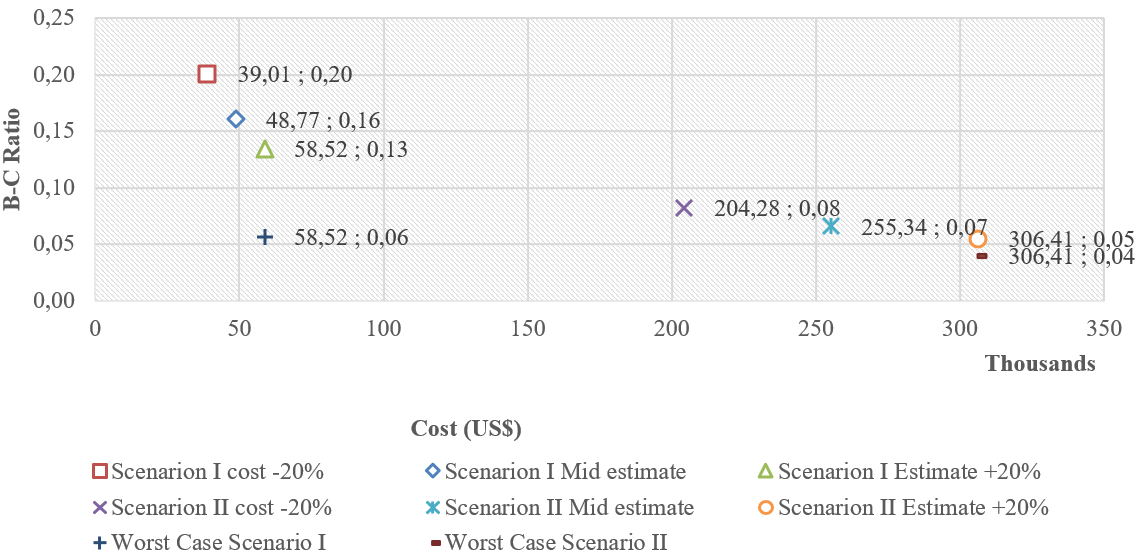
- There is a positive relationship between the benefit-cost ratio (B-C) and number for cyclists (Figure 7) and a negative relationship between B-C and the cost of interventions to encourage bicycling (Figure 8). Scenario I had an initial B-C estimate of 0.16 and Scenario II, 0.07 (Figure 7).
 | Figure 7. Sensitivity of B-C ratio to number of bicyclists |
 | Figure 8. Sensitivity of B-C ratio to intervention Cost |
5. Conclusions
- The results of the study show an increase in health benefits due to the increased number of cyclists. Hence, the health benefits of active modes should also be included to support investment decisions.Wider network interventions are also more sensitive to intervention costs and expected demand than small scale bicycle projects. Therefore, planners and policymakers have to consider not only the expansion of infrastructure but also low-cost interventions to promote safe bicycling.
ACKNOWLEDGEMENTS
- The authors would like to express our deepest gratitude to our advisor, Prof. Dr. Luc Int Panis. Our special thanks goes to Mr. Yohannes Legesse and Mr. Gizaw Eshetu for supporting our study by providing valuable secondary data. We would like also to extend our thanks to Mr. Yibrah Gebremedhin who assisted in the field survey.