Ebtissem Sassi1, 2, 3, Abdellatif Benabdelhafid3, Sami Hammami4
1Department of Transport and Logistics Management, University Institute of Technology of Le Havre, Normandy University, Le Havre, France
2Normandy Innovation Management Enterprise Consumption Laboratory, Le Havre University, Normandy University, Le Havre, France
3Le Havre Applied Mathematics Laboratory, Le Havre University, Normandy University, Le Havre, France
4Research Unit in Development Economics, Faculty of Economics and Management of Sfax, University of Sfax, Sfax, Tunisia
Correspondence to: Ebtissem Sassi, Department of Transport and Logistics Management, University Institute of Technology of Le Havre, Normandy University, Le Havre, France.
| Email: |  |
Copyright © 2019 The Author(s). Published by Scientific & Academic Publishing.
This work is licensed under the Creative Commons Attribution International License (CC BY).
http://creativecommons.org/licenses/by/4.0/

Abstract
In the framework of territory planning, decision-makers are often confronting the analysis of a long report containing at the same time quantitative and qualitative information. In this context, this paper will be useful in the development of a decision support system leading to an optimal organization of a hinterland based on sustainable development. Our modest contribution aims at suggesting a methodological approach of decision support of a hinterland planning project in multi-criteria and multi actor’s frame in the most favorable conditions to the environment, to the economic efficiency and the social fairness. The suggested methodological approach allows, on the one hand, the reinforcement sharing of knowledge on the territory and analyzing multisource criteria on the other hand. Such a decision support tool for a planning project does not exist anymore in the literature. This work may help in filling this gap. The preoccupations of this work are showing the best decision to make among many identified ones and this is against the objectives and the criteria fixed by the actors intervening in the process of decision making. This methodological approach can be used as a decision support tool available to the decisional authority when making the necessary decisions.
Keywords:
Complexity, Criteria, Logistics, Territory planning, Constraints, Optimization of transport and logistics, PROMETHEE, Multi-criteria analysis, Mathematical optimization model
Cite this paper: Ebtissem Sassi, Abdellatif Benabdelhafid, Sami Hammami, A Methodological Approach of a Hinterland Planning Project Decision Support, International Journal of Traffic and Transportation Engineering, Vol. 8 No. 3, 2019, pp. 59-71. doi: 10.5923/j.ijtte.20190803.02.
1. Introduction
This territory planning decision support problem was discussed in the work of [1] as a multi-criteria problem. This paper will be oriented towards the suggestion of a decisional model.The objective of this paper is the suggestion and the experimentation of a decision support system to solve the problem of the territory planning based on the choice of a good compromise satisfying a group of criteria.The objective matches the operational approach of synthesis upgrading by partial aggregation methods.In this paper, we will deal with a GIS1, namely, MAPINFO for the extraction of geo-referenced data which will be later analyzed through the use of a multi-criteria support method AMCD, namely, the PROMETHEE method. This paper deals with the following questions:- What are the principal constraints of a hinterland project?- What are the specific criteria of a hinterland performance?- How can we cut out the criteria into representative components (indicators)?To answer these questions, we will adopt the following procedure. In the first section:- We identify our methodological approach.- We identify the constraints encountered during the territory planning by integrating logistics optimization constraints.- We name the criteria and indicators of sustainable development in the framework of our problem.In the second section, we elaborate a model of mathematic optimization for certain links of the logistic chain. In the third section, we will follow the following steps: - We describe in details the PROMETHEE method which was held to carry out the comparisons- We justify our geographic tool choice MAPINFO.Finally, we have validated the adopted methodological approach to a case study.In the territory planning studies, we must respect the different types of constraints, mainly:- Geographic constraints.- Functional constraints.- Logistic constraints [2].Also, we must optimize a group of criteria:- Environmental criteria.- Social criteria- Economic criteria.
2. Constraints
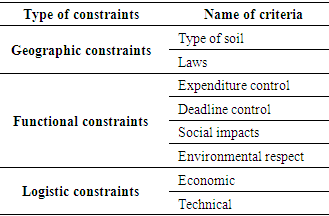
We have shown in the paper [1] the interest of the multi-disciplinary approach of a territory planning project. Also, the identification and analysis of the constraints linked to a project are important. They lead to the elimination of unacceptable solutions.We below name the constraints of a territory planning project. The constraints list stems from a synthesis work of different knowledge basis reflecting [1-2,12,14]. We group all these constraints into three major classes, each of which gathers various internal constraints. Table 1 below illustrates the hinterland planning project constraints.Table 1. Hinterland Planning Project Constraints
 |
| |
|
These constraints impose various technical specifications that must be satisfying during the planning of the hinterland. They affect the selected choice, impose achievement difficulties, and could cause judicial remedies generally linked to conflicts of use and occupation in the framework of works.
2.1. Geographic Constraints
The principal geographic constraints are linked to spatial parameters [9].The «type of soil» is a constraint to consider during territory planning project because the implantation of logistics buildings and transport infrastructure is not possible on all the soil types.The principal constraints of « laws » are related to national regulatory requirements leading to laws, decrees or local laws. This general regulatory framework aims at précising the territory management modalities oriented towards beneficial environmental ends.
2.2. Functional Constraints
They are generally constraints imposed by the specification sheet. These constraints set against various technical specifications which must be satisfying during the territory planning.In this framework, we distinguish four types of constraints.- Constraints related to «expenditure control» relative to the different financial posts must respect - Budgetary evaluation mentioned in the specifications sheet. - Constraints related to «deadline control» of the project planning implementation mentioned in the specifications sheet.- «Social» constraints related to the potential conflicts of the territory occupation and use. These conflicts can be linked to the discomfort caused by freight transport or territory planning works on local activities. - «Environmental respect» constraints related to environmental impacts caused by planning operations and transport. The best environmental practice is related to the desired minimization of the impacts on vegetation and residents.
2.3. Logistic Constraints
The importance of the integration of logistic chain actors within the territorial decisional process is crucial. Hence, we have integrated logistic constraints which must be taken into consideration during decision making in the hinterland planning project.Among the objectives to fix in the framework of the hinterland territory planning project is ensuring the exchange of physical flows while respecting some logistic constraints. When these constraints considered, the deadline for freight marketing is reduced and the transport service quality is improved. Therefore, logistic providers succeed in satisfying the customer’s needs and reducing costs, even all the logistic chain partners.In this framework, we distinguish two types of constraints:- «Economics» constraints aim at minimizing the logistic chain costs. They integrate the costs related to freight transport from the port towards consumption pole going through logistic buildings and vice versa.- The "technical" constraints related to the structure of logistics buildings (storage capacity, storage conditions, etc.).
3. Criteria
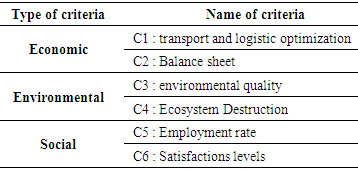
Criteria are quantitative and qualitative expressions of the objectives or the constraints allowing the evaluation of the alternatives [3]. According to [4], a family of criteria is coherent if it meets two characteristics:- Completeness: all criteria must be taken into consideration.- No redundancy: duplication must be avoided in order not to give importance to a criterion due to its redundancy [5].In order to conform to the concept of sustainable development, we must be based on three criteria where each criterion subdivided into sub-criteria.Hence, we name some criteria to be considered during territory planning.- The consideration of environmental criteria: It aims at allowing the actors intervening to take favorable decisions to the ecosystem. These criteria are presented through the emission of various pollutants and noise pollution.- The consideration of social criteria is represented through the social impacts of the hinterland planning project.- The consideration of economic criteria represented through logistic optimization criteria as well as financial criteria.The table 2 below illustrates the construction of a family of criteria meeting the sustainability context.Table 2. Criteria list
 |
| |
|
4. Indicators
Indicators generally correspond to cardinal information contrary to the criteria which correspond to ordinal information.Our study [2] leads to the obtaining of performance indicators of the hinterland. Based on this study and taking inspiration from achieved works in the framework of territory planning, we will mention below a list of indicators classified according to criteria already mentioned in the previous section.
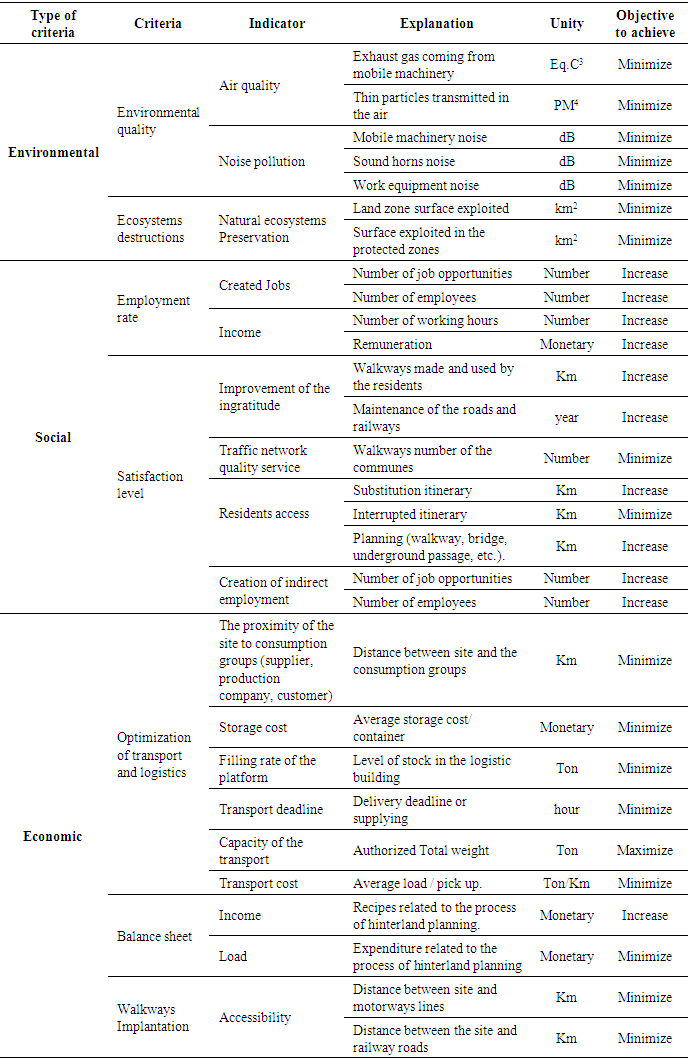
4.1. Environmental Indicators
Figure 1 shows the principal environmental indicators.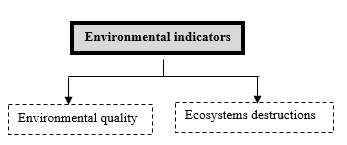 | Figure 1. Environmental indicators |
4.1.1. Environmental Quality
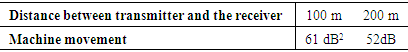
Various indicators allow the appreciation of the negative effects caused by a hinterland planning project. Among the environmental impacts, we have retained the emission of pollutants and noise pollution which affect the quality of the environment.- Air quality:It is determined according to the concentration rate of the atmospheric pollutants. Impacts on the quality of air come from two sources:- Exhaust gas coming from mobile machinery: We will focus on this framework to the emissions issued after works rather than those related to the site because according to (Engis), “Emissions related to the site are not considered as a significant factor of the air quality deterioration”.- Thin particles (dust, smoke): They can cause negative effects on the health of riparian (respiratory problems), generate traffic accident risks (decreased visibility) and have an impact on plants (reduction of the photosynthetic activity, therefore, the decrease of their growth rate).- Noise pollution:Noise pollution is the main inconvenience affecting the riparian near the logistic buildings. Noise sources are different. They react mainly from: - Mobile machinery noise.- Sound horns noise.- Work equipment noise (during works): for this type of noise, impact noise is restricted during the period of works. A study carried out by (Engis) where the medium level of the sound generated in the site environment is calculated in the table 3 below. Table 3. Level of Noise Generated In the Site Environment (Engis)
 |
| |
|
4.1.2. Ecosystems Destruction
This indicator relies on heritage protection by laws.
4.2. Social Indicators
Figure 2 shows the main social indicators.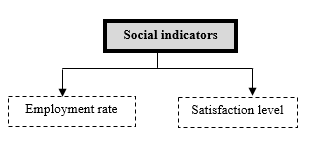 | Figure 2. Social indicators |
4.2.1. Employment Rate
The human resources needed in the construction and exploitation of the logistic buildings can be divided into two types, manpower, and logistic chain actors.Direct social impacts are assessed through jobs created and incomes.
4.2.2. Level of Satisfaction
It is evaluated by the level of indirect social impacts on the residents and the supply chain actors.Indirect impacts represent: - Extension and maintenance of the roads and railways within the framework of the hinterland planning project. - Traffic network quality service.- Interruption of the already exploited roads. Generally, this problem is resolved through the implantation of substitution and planning roads (walkway, bridge, underground passage, etc.)- Creation, of indirect jobs: they represent the activities created by the logistic chain upstream and downstream.
4.3. Economic Indicators
The figure 3 illustrates the principal economic indicators: 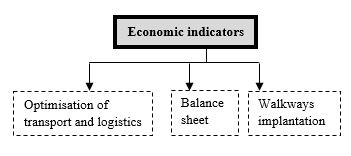 | Figure 3. Economic indicators |
4.3.1. Optimization of Transport and Logistics
The logistic chain is made of the following links: supplier, Production Company, logistic provider (warehouse and transporter) and customer. In this paper, we consider that the links (supplier, production company and customer) as consumption groups.Links «consumption groups» are evaluated according to their proximity to the logistic platform. Movements of the means of transport of freight in the hinterland lead to a heavy impact on the network which is already loaded on certain walkways. Hence, the proximity of consumption groups (Production Company, supplier or final customer) to the logistic building is an important criterion.Links «logistic provider» are evaluated through technical indicators (of functioning) and indicators related to the transport service.
4.3.2. Balance Sheet
This criterion gathers the different financial indicators related to a planning project of the hinterland: income, loads (installation and maintenance, etc.). The last two ones are not considered as sub-criteria but they are financial posts. The «balance sheet» of the planning indicates the load and the income from the phase of investment to the achievement of the planning works. It does not allow the anticipation of the evaluation of the return (benefits) on the investments appearing later on.
4.3.3. Walkways Implantation
It is evaluated by the distance between consumer groups and roads or railways lines.We mention in the table 4 below, for information only, some indicators must be considered in the process of territory planning.Table 4. Indicators
 |
| |
|
5. Mathematical Optimization Model
In this section, we suggest explaining the adopted decision support approach. It is a sequence of optimization of different links making a logistic chain.We consider the logistic chain made up of suppliers, Production companies, customers and logistics providers (which ensure the function of transportation and warehousing). In this section, we deal with the conception problem of the logistic chain as an allocation problem aiming at the optimization of flows exchange between the harbor, «logistic building5» and «consumer groups6». However, links conception «logistic provider» is considered as a problem of localization-allocation since it is the selection of the best site to implant the logistic building and to optimize the exchange of the flow. Figure 4 shows the adopted distribution network.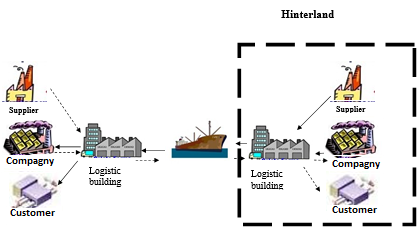 | Figure 4. Adopted distribution network |
We name for each link, the different hypotheses and the components of the mathematical model. We opt for linear programming to formulate the optimization models.
5.1. Link Optimization «Logistic Provider»
5.1.1. «Transportation» link
Transportation is an essential link in the harbor distribution; indeed, transport costs represent a major part of the selling and buying price. To simplify this modeling, we adopt a direct delivery network where the company delivers directly the product to the customer without going through a warehouse of storage and distribution.We limit our study to road transportation knowing that the reality of transport is multimodal. Our problem consists essentially in minimizing the cost of transportation in the hinterland between the harbor and the logistic building, at the level of:- Upstream logistic: from supplier to the production.- Downstream logistic: From production company to the customers.
5.1.1.1. Indices
G: Set of consumption groups g, g∈ {1...G}T: Set of means of transport t, t∈ {1…T}D: Set of transport deadlines d, t∈ {1…D}
5.1.1.2. Parameters
 : Quantity of transported freight in a deadline d.
 : Unitary cost of freight transport between the harbor and the logistic building with a means of transport t.
 : Unitary cost of freight transport between the logistic building and the consumption group with a means of transport t’.
 : Total authorized weight in charge of the means of transport used between the harbor and the logistic building.
  : Total authorized weight in charge of means of transport t’ used between the logistics building and the consumer pole.
  : Freight percentage related to the consumption group transported by a means of transport t.
 : Freight quantity related to a consumption group aiming at being transported in a period d.
 : Delivery deadline or freight supplying expressed by consumption group g.
5.1.1.3. Decision Variables
 : Transported freight quantity between the harbor and the logistic building in a period d and by the means of transport t.
  : T Transported freight quantity between the logistic building and the consumption group g during a period d and by the means of transport t’.
5.1.1.4. Transportation Objective Function
The function (1) aims at minimizing the transportation costs between the harbor and the logistic building as well as the transportation costs between the logistic building and the pole of consumption.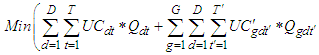 | (1) |
5.1.1.5. Constraints
Constraints related to transportation loads:The constraints (2) and (3) suggest that the transported quantity must not exceed the total authorized weight in charge of means of transport.We must signal that a means of transport t can transport freight related to the different groups of consumers. For this reason, we multiply the transportation capacity by the transported freight percentage related to a studied consumption group.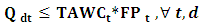 | (2) |
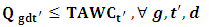 | (3) |
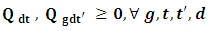 | (4) |
The constraint (4) indicates that the quantities are positive or null.
5.1.2. «Logistic Building» Link
This link gathers the functioning operations of «logistic building». Function (6) aims at minimizing the cost of storage which gathers the group of costs related to the functioning operations of the logistics building.
5.1.2.1. Parameters
 : Storage cost in the logistics building in the period d.
 : Freight percentage stored related to a consumption group g.
 : Quantity of freight transported between the harbor and the logistic building in the period d and by the means of transport t.
 : quantity of freight transported between the logistic building and the consumption group g during the period d and by the means of transport t’.
5.1.2.2. Decision Variables
 : Storage rate in the logistic building in a period d.
5.1.2.3. The Objective Function of the Functioning
The function (6) aims at minimizing the cost of storage in the logistic building.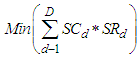 | (6) |
5.1.2.4. Constraints
Constraints related to the rate of storage:The constraint (7) determined the rate of storage in a deadline d. It is calculated by the level of freight stored in the logistic building rightly (d-1) by adding the input quantity and minimizing the output quantity.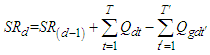 | (7) |
The constraint (8) precise if the storage rate is positive or null. | (8) |
Constraints related to the logistic building size:The constraint (9) indicates that the storage rate must not exceed the capacity of the storage of the logistic building CSLB. The logistic building gathers the freight-related to many consumer groups. For this reason, we multiply the percentage of stored freight related to each group by the storage capacity of the logistics building.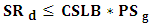 | (9) |
5.2. Link Optimization « Consumption Groups »
This link gathers the functioning operations of the “consumption groups”. This function (10) aims at minimizing the costs of supplying or delivery of the freight-related to a group of consumers.
5.2.1. Parameters
 : Supplying cost or of the delivery of freight-related to a group of consumption g of the period d (transportation cost and the freight value).
5.2.2. Decision Variables
 : Freight quantity related to a group of consumption aiming at being transported in a period d.
5.2.3. The Objective Function of Functioning
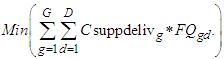 | (10) |
6. Multi Criterion Analytical Approach Issue Choice
In this paper, we suggest a hybrid model by combining GIS and MCA to optimize simultaneously the territory planning decisions and the logistic chain.In the multi-criteria decision support domain, we generally try to find an «optimal solution », so it is probably that this solution may exist in the theory but it can’t be achieved on the territory as a possible solution. For this reason, it is necessary to note that we are looking for «the best compromise » by taking into consideration all the selection criteria. According to [6] «The compromise solution does not bring optimization to each criterion».We must note that the best compromise is changeable according to the preferences of the implied actors (The importance of criteria given by actors).
6.1. Decision Support Multi-Criteria Methods
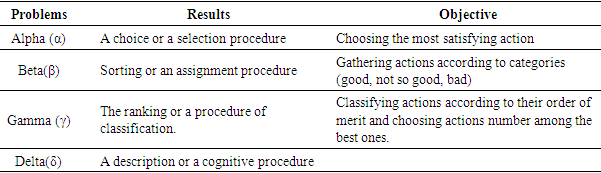
According to [12-13], the notion of multi-criteria is related to the concept of decision support; and many criteria (inputs) influence the decision made by a decision-maker who is an actor among others in the process of a decision while considering the point of views of the other implied actors. Our choice of this type of method comes from the possibility of treating multiple objective problems while considering diverse criteria and often heterogeneous. We should also mention that the multi-criteria methods are numerous. We note that in this framework, decision support multi-criteria basis references are numerous: American school and European school. We don’t intend to develop these different schools of which we only propose the definitions of these two schools.These two schools are quite different:- American school: It uses the additive utility function. It is based on the combination of utility values in a global note for the action. The action global note is the note weighted sum of each criterion multiplied by its weight. - European school: It is based on ranking methods between potential actions. The most used methods are ELCTRE and PROMETHEE. Actions' final ranking is represented in a raking graph.Multi-criteria analysis methods are distinguished according to the problem to be treated [7]. We present in the table 5 below the different types of problems basing on the work of Roy.Table 5. Problems Classification
 |
| |
|
6.2. Multi-Criteria Analysis Process
All these methods are based on four steps, of which the three first ones are common for all the methods [8].- Name a list of potential actions.- Name a list of criteria to take into consideration.- Fix a performance table.- Aggregate performances (establish a global preferences model on a group of potential actions).
6.2.1. The Selection of Potential Actions
The selection of actions is based on two analysis scales:- Territory: at the territory scale, the method is made of a double input: quantitative and qualitative to determining the possibilities of platform implantation.- The logistic platform: According to the previously carried out experiences, the implantation of logistic platform plays a role in practice determine: The link between the harbor and the enterprises, storage locations, parking spaces for means of transport, handling conditions are the key points determining the performance of a logistic platform.This step must allow the selection of a study perimeter and illustrate the information about the topic.
6.2.2. Criteria Construction Process
According to [9], the criteria allowing the distinction between scenarios (actions). The criteria are often in conflict with each other [10]. For example, the economic criteria «less costly action» can be in contradiction with respecting laws. For this reason, in this context, the optimality (the choice of the best solution) is possible since a solution can be optimized according to certain criteria without being so according to others [10].
6.2.3. Evaluations Matrix
Evaluations matrix is a double input table:- Columns: represent the selection criteria.- Rows: represent the potential actions. It gives actions to the group of evaluation according to their criteria. The implied actors give importance to the selection criteria. The weight is two types.- Ordinal weight: It represents the importance order of a criterion relative to other criteria (very important, important and less important).- Cardinal weight: it gives more precision to the importance of criteria. It takes the form of a number or a percentage.Actors concerned with sustainable development agreed on the fact that impacts have not the same weight. However, an agreement around their weight is complicated to get. Different actors and stakes holders are of the same resource. They must result in a compromise concerning the strategy of territory management.
6.2.4. Aggregation
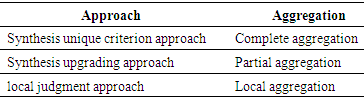
Actions will be classified according to their utility value. The latter is an aggregation process data giving a value of preference to each action. Therefore, determining the rank. Table 6 below illustrates the operational approaches and aggregations.Table 6. Operational approaches and aggregations
 |
| |
|
Performance aggregation methods depend on the type of approach:- Synthesis unique criterion operational approach: It is based on the optimization by returning on one criterion. - Synthesis upgrading operational approach: First, it is based on a side-by-side comparison of actions. Then, the development of synthesis through the exploitation of the ranking method.- Local judgment approach: It means putting into play a limited number of actions with no rule. Indeed, the interaction between the decision-maker and the study man is organized due to a protocol.
6.3. PROMETHEE
The choice of a decision support multi-criteria method depends on the nature of the problem [11].Our choice is based on two methods «PROMETHEE» through the problem « alpha » which allows the selection of the most satisfying action. This choice is justified by the upgrading synthesis approach accepting incomparability (partial aggregation). This choice comes due to the exclusion of the unique criterion approach which treats the mono-criterion analysis problem and the local judgemental approach which does not lead to finding the best actions. We must note that the digital application is based on the establishment of indicators from evaluations, a rank without appealing to weights of the criteria. Indeed, the choice of weights of the criteria returns to the decision-maker while considering the opinion of the actors. For this decision problem, and due to the absence of weights of the criteria, we have relied on the method of PROMETHEE which allows the replacement of upgrading by a large preference notion. The advantage behind the partial aggregation methods is the possibility of using heterogeneous criteria, in other words without the obligation of converting them into a common unity.It gathers for each solution (resource) evaluations for each criterion of scales of preference. These criteria must be increasing (value to maximize) or decreasing (value to minimize).
7. Model Experimentation
This study aims at the conception of a decision support tool for the territory planning and more precisely the problem of site localization for the establishment of a logistic platform site to serve a harbor.The objective of this paper is to experiment with the decisional model and to present a case study with a discussion of the obtained results.
7.1. Model Development Tools
The achievement of this tool required different tools and analysis and development software. - MapInfo: Is a tool of type Geographic information system. It allowed, in our study, to visualize and modify the different geographic data basis used according to the need. Also, it allowed as to localize correctly the study zone as well as environmental zones. It let us collect essential data such as the hinterland, traffic, vast lands, urbanism, etc. - PROMETHEE: It is a multi-criteria analysis approach of the problem presenting actions number (or decisions) evaluated according to many criteria. It is associated with the descriptive approach, allowing the visualization of conflicts and synergies between criteria. This tool lets the analysis, study and suggests actions in terms of obtained results regarding criteria.
7.2. Case Study and Experimental Results
In this study, the treated problem in localization which consists of finding the most satisfactory ground to some criteria.
7.2.1. Study Parameter Delimitation
The study zone of our case study is situated around Rades harbor in the north of Tunisia; indeed, although that Tunisia owns many harbors, we opted for Rades harbor and its surrounding area. The GIS, as shown in the figure 5 below, allows having an overall view of the studied zone.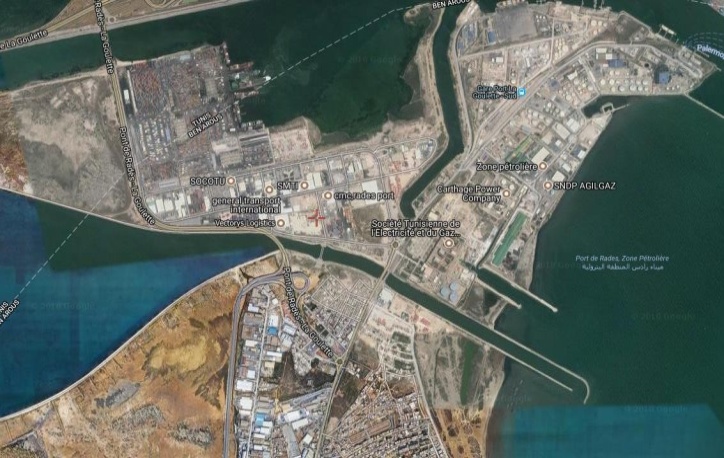 | Figure 5. Detailed presentation of Rades harbor |
Upon, we can see Rades harbor and its surroundings. We noticed as well important road traffic around the harbor, as well as a vast stretch of water used in the transportation of freight. So; it is crucial to building a platform correctly able to serve this port. Figure 6 shows a global view of rades harbor.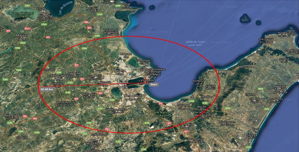 | Figure 6. A Global view of Rades harbor |
Here, we can see globally the surroundings of Rades harbor. The red circle represents the hinterland, its radius is approximately about 50 km. In this radius, we will determine the potential zones in the construction of the platform.
7.2.2. Criteria Definitions
Once the study perimeter is designed, it is important to establish criteria. This step consists of the definition of the factors taken into consideration during the multidisciplinary decision. This family of criteria must meet the coherence condition: Criteria must be exhaustive and non-repetitive. The selected criteria are:• The surface of the selected zone: It is a criterion to be maximized. The more it is raised, the more favorable the implantation platform is.• Proximity to a roadway: This criterion is to be minimized because we must optimize the fluidity of transportation around the dock.• Distance regarding the harbor: It is an important criterion to be minimized because it is a way to go by a vehicle between the harbor and the platform. It is important to precise that the distance is measured by the road distance traveled on a principal way.Figure 7 shows the application of the suggested approach.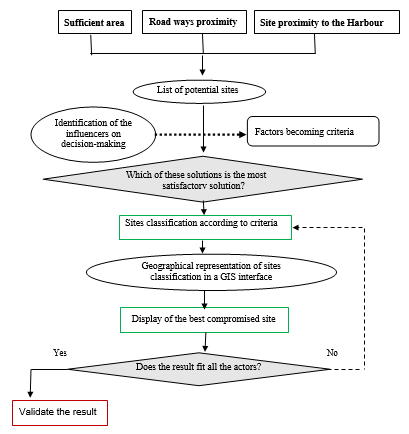 | Figure 7. Application of the suggested approach |
7.2.3. MCA Implementation
Once the geographic data are collected and the criteria are established, we must move to the phase of coupling with a multi-criteria analysis. For that, as previously mentioned, we use the method PROMETHEE. This method owns a ranking system named PROMETHEE Ranking, and a tool allowing the application of a scenario.First, we must insert the collected data, mainly zones, and criteria. Figure 8 is a screen print. 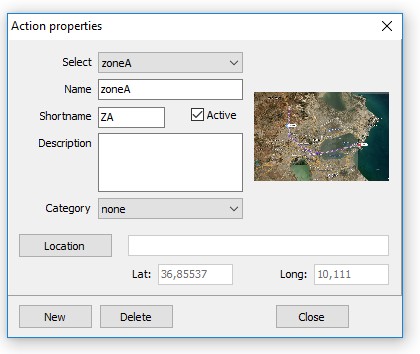 | Figure 8. Insertion of zones |
In the figure 9, we can see the way the selected zones are inserted in the software, we insert the name, the image, and geographic details. Then, we insert the predefined criteria.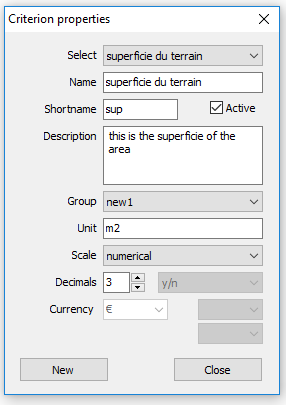 | Figure 9. Criteria selection |
Here, we can notice the insertion of criteria. We insert the name, abbreviation, description, unity, etc. All these data help in the classification of results.Then, we must enter the acquired data due to GIS, namely, details, distance (distance compared to harbor and roadways) as mentioned in the figure below).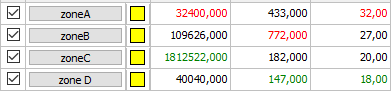 | Figure 10. Zones data |
In the figure 10, in the first column, we can see the values of the zones' surface. It is expressed in (m2). The second column represents the distance compared to roadways expressed in meter (m). The last column represents the distance compared to the harbor, expressed in (Km). As we can see, certain numbers are in red, others are in green, the software starts by classifying zones and criteria from the biggest to the smallest.There are as well other indications to add when we insert criteria, there are data specifications. These specifications allow the software to establish a ranking and analyze the information we have inserted. Figure 11 is a screen print.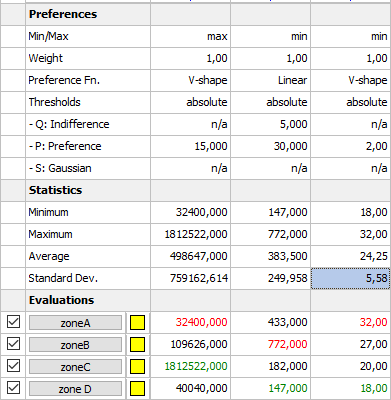 | Figure 11. Data specifications |
The interface is divided into three big tables. The latter is already explained, the first represents the specifications (the criteria is to be maximized or minimized, the latter weight, evolution over time, etc.). The second indicates the result. The last phase represents the last step of criteria insertion. In the next section, we will dissect, analyse and draw conclusions relative to our problem.
7.2.4. Analysis and Results
In this part, we will pass to the analysis and interpretation of results. The PROMETHEE software owns an analysis tool of ranking in the function of input data. We will dissect some of these tools and try to draw some conclusions. In the figure 12, the tools below, show that the rating making the PROMETHEE tool, with the help of criteria named Phi. From this method, we can see that zones C and D are equal with 0.5556 whereas zone B and zone A are increasingly below respectively with -0.333, and -0.7778.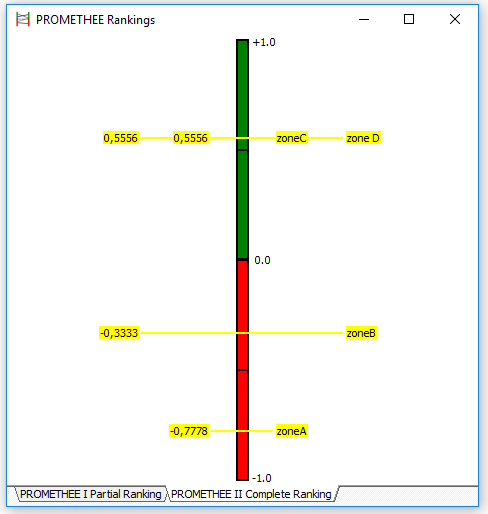 | Figure 12. Zones rating |
According to the raking method, we can infer that it is advantageous to choose zone C and zone D rather than zones B and A for the implantation of our platform. Figure 13 is a screen print.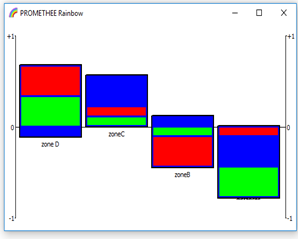 | Figure 13. Rainbow PROMETHEE |
This tool is called «Rainbow PROMETHEE». It is a multicolor diagram representing the 4 zones in the form of 4 rectangles. These zones are ranked according to the method of ranking seen previously. The advantage of this tool allows us to have an evaluation precision of the criteria. In other words, it compares criteria against others. The red color represents the proximity of the roadway. The bigger the red surface is, the nearer the zone to the main roadway is. The green color symbolizes the distance opposite the harbor. The bigger the green surface is, the nearer the zone to the harbor is, namely, Rades harbor. Finally, the blue zone represents the surface. The more it is important, the bigger the reception platform is. We can as well note that that there is a benchmark made of a horizontal axis plus two vertical ones. Hence, the higher the zone surface is, the better regarding others is. For example, zone D has a red rectangle and a green one reaching upwards more than the ones of zone C. That is to say, for zone D, distance regarding roadways compared to the harbor are smaller than the ones of zone C. We can as well note this in the figure below.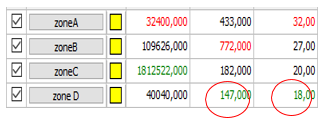 | Figure 14. Zones Data |
In figure 14, analysis tools allow the comparison of results in function of criteria weight. They let us measure the impact weight change criteria on the final ranking of the zones.In the figure 15 below, we can see the initial ranking while all the criteria are having the same weight. Zones D and C are ahead followed by zones B and A. 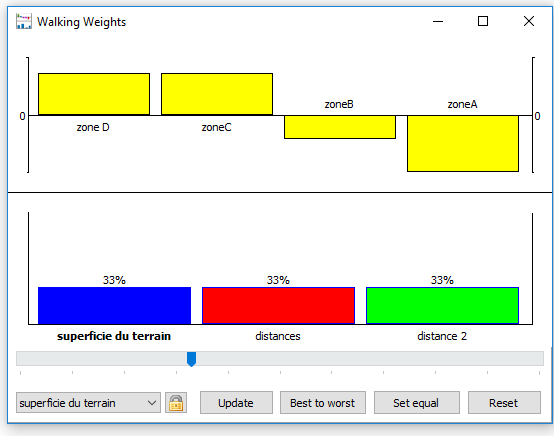 | Figure 15. Initial ranking |
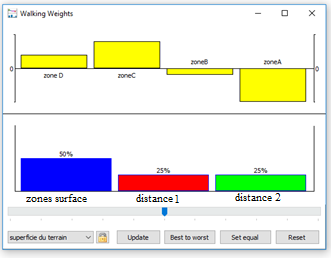 | Figure 16. Ranking by adding weight to the surface |
Then, in the figure 16 above we can make some changes by increasing the percentage (weight) apportioned to each criterion. We will first increase the one corresponding to the surface.When we add weight to the surface criterion, zone C becomes the preferable one compared to zone D. However, when we choose another criterion such as distance to the harbor, we obtain another result. Figure 17 shows the results when adding weight to the distance against the harbor.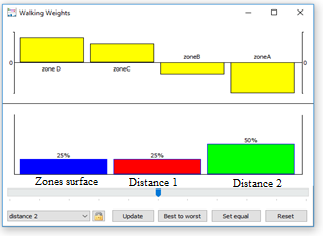 | Figure 17. Results when adding weight to the distance against the harbor |
As we can see, zone D becomes favorable against other zones. The result analysis does not depend only on the value assigned to criteria but as well as to the weight of the later ones.To conclude, we can claim that zone D is the optimal zone for the implantation of our platform since it is ranked first.
8. Conclusions
In this paper, we have first presented the constraints and relative criteria in territory planning. These criteria are were characterized due to: - Indicators describing their situation.- Parameter giving a measured indication.Mathematical optimization models developed in the previous section lead to the enrichment of the methodological approach suggested for a hinterland planning and the suggested logistic chain. These models help in the process of decision making at the levels:- Strategic: relative to the localization of logistic building. - Tactic: relative to the optimization of physical flow exchanges in the hinterland. We have chosen the formulation of a mathematical model for each link instead of an integrated model because the first model is:- Much less complex.- It meets the progressive character of the logistic chain. Obviously, we can note, as perspective, the possibility of the resolution of these mathematical models through a linear programming software. This paper allows us to focus on the criteria of logistics optimization in the framework of territory planning, particularly, the hinterland. The main challenge in this work is to preserve the territorial resource, limit the effects due to the misuse of this resource and bring a quality service concerning the exchanged of freight flow in the hinterland.We have also demonstrated that the integration of the logistic constraints, it seems inevitable in the framework of sustainable development because it allows the optimization of physical flows between links and it helps in the resolution of the localization problem. Like any other work, this study has some limits. We have restricted our bibliographic research to a selection of some recent works due to the complexity in the development of a multidisciplinary review of literature since the territory planning problem has been treated through various approaches: Mathematic, economic, informatics and geographic approaches.
ACKNOWLEDGEMENTS
I wish to thank the Transport and Logistics Management Department (GLT) of the University Institute of Technology (IUT) of Le Havre for providing me the opportunity to work in their nice atmosphere.
Notes
1. Geographic Information Systems2. Decibel3. Carbon Equivalent4. Particulate matter5. Logistics platform or warehouse6. Supplier, production company and customer
References
| [1] | Sassi, E., Hammani, N., Benabdelhafid, A., & Hammami, S. (2016). Evaluation Methodology Development of a framework for sustainable transport capacities evaluation. The 5th IEEE International Conference on Advanced Logistics and Transport (ICALT), Kraków, Poland, 68-71. |
| [2] | Sassi, E., Benabdelhafid, A., & Hammami, S. (2017). A typology of dashboard for a territorial industrial ecosystem, the 6th IEEE International Conference on Advanced Logistics and Transport (ICALT), Bali, Indonosie, 47-52. |
| [3] | Simon, J.-C. (1989). Introduction in "from pixels to features". V-X North, Holland Amster-dam. |
| [4] | Roy, B. (1985). Méthodologie multicritère d’aide à la décision. Economica, Paris. |
| [5] | Maystre. (1999). Aide la négociation multicritére Pratiques et conseils. Collection Gérer l’environnement Presses Polytechniques et universitaires romandes. |
| [6] | OCDE/JRC. (2005). Handbook on Constructing Composite Indicators: Methodology and User Guide. OECD Statistics Working Paper, Paris. |
| [7] | Roy, B. (1985). Méthodologie multicritère d’aide à la décision. Economica, Paris. |
| [8] | Roy, B. (1975). Combinatorial Programming: Methods and Applications. Reidel Publishing Company, Dordrecht, Holland, NATO Advanced Study Institutes Series. Series C: Mathematical and Physical Sciences, Vol. 19, 459-497. |
| [9] | Sarsam,S., Daham,A., Mahdi, A., Implementation of Close Range Photogrammetry to Evaluate Distresses at Asphalt Pavement Surface, International Journal of Transportation Engineering and Traffic System. |
| [10] | Schärlig, A. (1985). Décider sur plusieurs critères: panorama de l'aide à la décision multicritère. Presses Polytechniques et Universitaires Romandes, Lausanne. |
| [11] | Joerin, F. (1998). Decider sur le territoire: proposition d'une approche par utilisation de SIG et de méthodes d'analyse multicritere. thèse no 1755, DGR-EPFL, Lausanne. |
| [12] | SASSI, E., Benabdelhafid, A.,Hammami, S., Evaluation of transport system capacity: Strategies and framework, 10 International seminar on Logistics and Supply Chain Management (LOGISTIQUA), Rabat, Maroc, 2017. |
| [13] | Jahanshahi, D., Minaei, M., Kharazmi, O., A., Minaei, F., Evaluation and Relocating Bicycle Sharing Stations in Mashhad City using Multi-Criteria Analysis. International Journal of Transportation Engineering, Vol.6, No.3. |
| [14] | Yerramilli, S., A Hybrid Approach of Integrating HEC-RAS and GIS Towards the Identification and Assessment of Flood Risk Vulnerability in the City of Jackson, American Journal of Geographic Information System, 2012, 1(1): 7-16. |

 Abstract
 Reference
 Full-Text PDF
 Full-text HTML