-
Paper Information
- Paper Submission
-
Journal Information
- About This Journal
- Editorial Board
- Current Issue
- Archive
- Author Guidelines
- Contact Us
International Journal of Traffic and Transportation Engineering
p-ISSN: 2325-0062 e-ISSN: 2325-0070
2019; 8(3): 49-58
doi:10.5923/j.ijtte.20190803.01

Data-driven Tool for Planning Metro Feeder Bus Routes
 Abstract
 Reference
 Full-Text PDF
 Full-text HTML
Dahai Han, Jie Yu
Department of Civil and Environmental Engineering, University of Wisconsin at Milwaukee, Milwaukee, United States
Correspondence to: Jie Yu, Department of Civil and Environmental Engineering, University of Wisconsin at Milwaukee, Milwaukee, United States.
| Email: |  |
Copyright © 2019 The Author(s). Published by Scientific & Academic Publishing.
This work is licensed under the Creative Commons Attribution International License (CC BY).
http://creativecommons.org/licenses/by/4.0/

Transporting passengers from a metro station to surrounding residences with feeder buses can effectively address the “last mile” problem. This paper presents a systematic data-driven tool for metro feeder bus route planning and illustrates its applications in Chongqing, China. The proposed system features its flexibility accounting for various critical issues during feeder bus planning phases, including demand modeling with mobile phone data, passenger accessibility management via open GIS platforms, optimization of stops and routes using tractable mathematical models, and online visualization of results through a Software as a Service (SaaS) framework. Real-world case study results demonstrated the effectiveness of the proposed tool.
Keywords: Feeder bus, Route planning, Data driven, Open GIS, Software as a Service (SaaS)
Cite this paper: Dahai Han, Jie Yu, Data-driven Tool for Planning Metro Feeder Bus Routes, International Journal of Traffic and Transportation Engineering, Vol. 8 No. 3, 2019, pp. 49-58. doi: 10.5923/j.ijtte.20190803.01.
Article Outline
1. Introduction
- Feeder bus is a transit service to transport passengers in a service area to a major transit network transferring at a transit station [1]. It has become one of most often used methods in solving the “last mile” problem due to its high reliability and flexibility, especially for areas served by a metro station with recurrent commuting traffic patterns. Despite the wide adoption of feeder bus systems, it remains to be challenging to design or adapt a feeder bus system to the changing ridership and road network conditions, which require reliable capture of existing and potential passenger demand and seamlessly optimize and adjust route designs to provide better service accessibility.In capturing passenger demand, review of literature indicates most of existing studies employed regional surveys [2-6] in modeling commuting demand. Group and Miller [7] discussed different survey methods and classified them into four categories, so called panel survey, multi-day survey, activity-based survey and computer-based survey method. Comparing with assumption-based demand [1,8-10], survey provides a reliable demand inputs but is time-consuming and cost-inefficient. In recent years, data-driven methods offer great potential for obtaining demand pattern in a representative and unconscious manner. Some studies [11-13] use smart card data to estimate potential travel origins and destinations, with the restriction that the data depends on existing routes and stops and shows only the current passenger demand. To capture potential demand especially for planning a new feeder bus network, mobile phone-based modeling is preferred and proved to be an effective tool. Caceres et al. [14] demonstrated the feasibility of extracting an origin-destination (OD) matrix from a mobile phone network. Ma et al. [15] applied mobile phone-based OD matrix estimation techniques in a large scale and derived trip matrices for operational use. Bayir et al. [16] introduced a novel path construction method and provided a complete framework to discover mobility path of mobile user from mobile phone location data. Alexander et al. [17] validated the inferred OD trips against trip distribution reported in surveys and showed its applicability.In designing feeder bus routes to serve the estimated demand, road environment including road network and travel speed is a primary consideration which restricts the choice of stop locations and affects the calculation of walking distance and bus travel time. Pioneering studies adopted ideal road network assumption to simplify the problem, among which well-connected grid road network was commonly presumed, and the feeder routes were designed to be perpendicular to the rail line [8,9,18-21]. Feeder bus speed was firstly taken as a constant over the network [18], then extensions were made to allow different speeds on various routes [19] or in multiple zones [9]. To deal with irregular road network, Chien and Yang [22] analyzed various cases of dead ends and formulated corresponding access time to feeder bus, Pan et al.[6] considered gated communities on irregularly shaped road network assuming the travel time between stops were given. With the help of Geographic Information Systems (GIS), researchers are allowed to use realistic road environment information to measure passenger accessibility and estimate the walking time or distance and bus travel time more accurately [4,10,23,24]. To make the planning and designing process more applicable, many software applications have been developed to help user making proper decision. Remix [25] is a widely accepted planning software designed for regular public transit which is responsive and interactive during designing phase, but it lacks a dedicated tool to gather and process individual passenger demand information. In terms of planning flexible transit with accurate demand like school bus, a web-based software developed by Orbit Software [26] is capable of integrating students demand modeling and bus route determination functions. However, there lacks capability to seamlessly integrate the realistic demand data into an optimization model for a feeder bus system planning and design.Despite the vast body of related literature, most of previous studies are segmented and a systematic approach is needed to integrate different phases for feeder bus route planning. In addition, in recent years data-driven models integrated with light and transferrable software framework have shown their advantages over traditional analytical or mathematical approaches in providing quick-response and user-friendly decision support. To this regard, this study presents our recently developed tool which includes four main modules to integrate a set of novel and effective tools for metro feeder bus system planning and design. The proposed tool offers functions to cope with the following critical issues:• Process the mobile phone communication record data to extract the passenger location information and estimate the potential demand for the feeder bus system;• Provide an open GIS tool for passenger accessibility management and measurement;• Optimize the bus stop locations and route planning through a tractable mathematical model using the integrated data;• Enable system users to perform the process readily on a Software as a Service (SaaS) platform and help them understand the results with well-designed visualization tool.
2. System Framework
- Figure. 1 presents the framework of the proposed data-driven tool, which mainly consists of the following four principle components:• Demand Modeling Module: to output an OD (Origin and Destination) matrix through a series of defined data mining procedures that could import, clean, integrate, and transform a mobile phone dataset in a normalized one; • Accessibility Management Module: to track and calculate the accessibility of candidate bus stops by managing the set of identified demand points;• Optimization Module: to generate the optimized bus routes and stops using two matrices from Accessibility Management Module and user specified parameters;• Output Module: to present a demand assignment table and a routing plan based on the outputs in the optimization module, and display them on a map, which can facilitate user to comprehend the final plan.
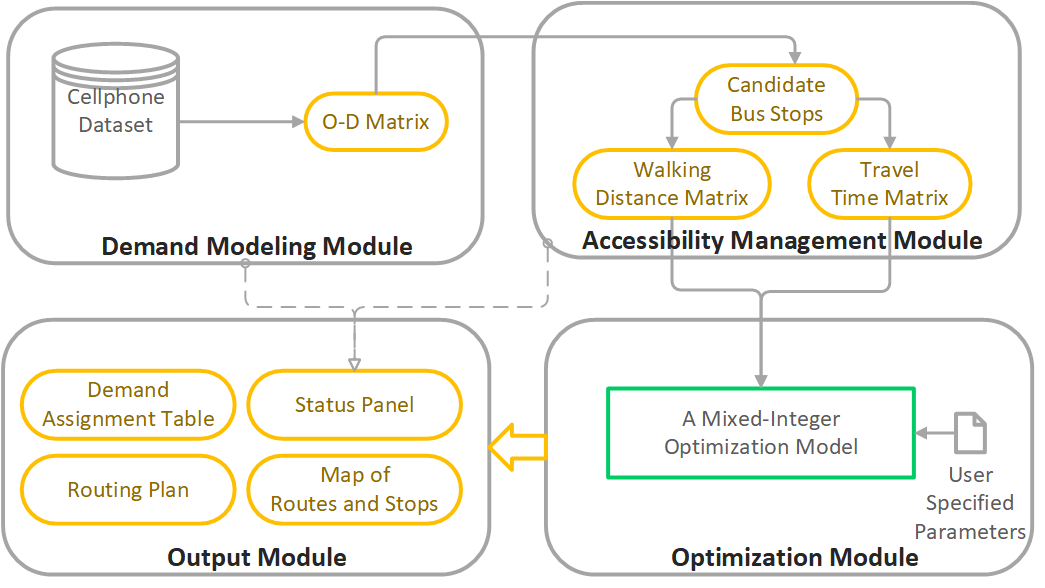 | Figure 1. System framework |
3. System Description
- This section will detail the structure of some key system modules, which include Demand Modeling Module, Accessibility Management Module, Optimization Module, and Output Module.
3.1. Demand Modeling Module
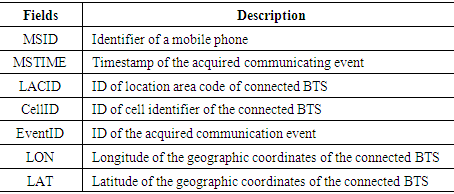
- This module derives aggregated potential demands for feeder bus service from mobile phone data. Served by the mobile network operator, mobile phone will connect to the nearest base transceiver station (BTS) when the user initiates a communicating event (e.g. a voice-call or text). Thus, a communication record between the phone and the BTS is generated, containing information such as the identifier of the mobile phone, the area code and identifier of the connected BTS, the identifier of the event and corresponding timestamp. Note that the geographic locations of the BTS are not stored in the records directly, and a matching process between communication records and BTS geo-location table is required to add positioning information to each record. Useful fields in the updated communication record data and brief descriptions of them are shown in Table 1.
|
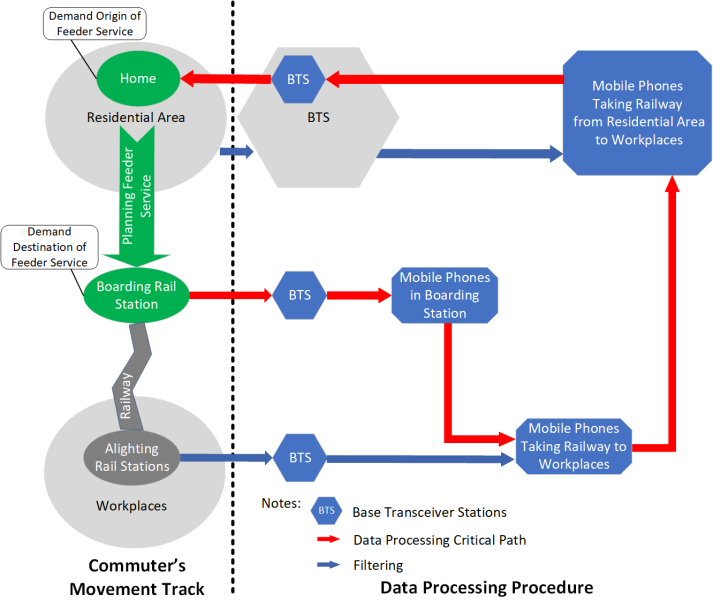 | Figure 2. The demand estimation procedures |
3.2. Accessibility Management Module
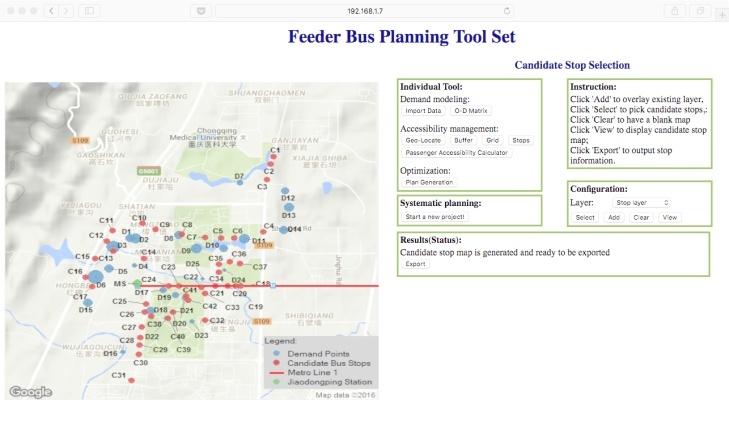
- This module employs two interactive tools to generate candidate feeder bus stops and the walking distance and travel time matrices based on up-to-date realistic map to measure passenger accessibility. Nowadays, modern map-engine providers, such as Google Map, Open Street Map and Baidu Map, offer not only the realistic topological structure of street network, but also the real-time traffic information on it. Relying on which, they are also able to estimate travel distance and travel time in different traffic modes and have offered access to them via defined open GIS platform, known as Application Program Interface (API). Google Map API is used in this module.In our first tool of Accessibility Management Module, the Candidate Stops Locator, we place the potential demands on map using the geographic coordinates. Buffering from these demand points is applied to limit the area for stops considering the walking distance could not be too large. Then a grid layer is overlaid to this area and the intersection points are potential stops. Considering local features, we adjust the stops to road side and eliminate some impractical points to achieve the candidate feeder bus stops, as shown on the left-hand side in Figure. 3. In the succeeding Passenger Accessibility Calculator, we employ the candidate stops as destination, and the demand points as origins to derive the walking distance matrix based on realistic map through Google Map API. Similarly, we can achieve the travel time matrix which contains the estimated travel time by car in the commuting hours between each candidate feeder bus to another and to the served railway station. It is remarkable that we allow planners define the candidate stops in other methods and import them into the Passenger Accessibility Calculator to obtain the walking distance and travel time matrices.
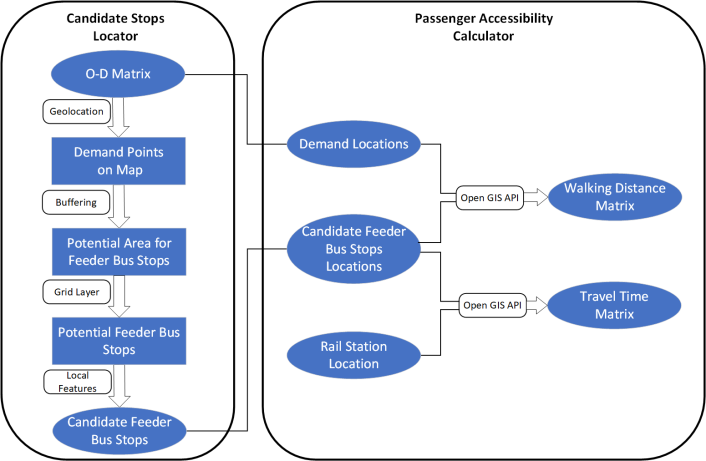 | Figure 3. Passenger accessibility analysis in Accessibility Management Module |
3.3. Optimization Module
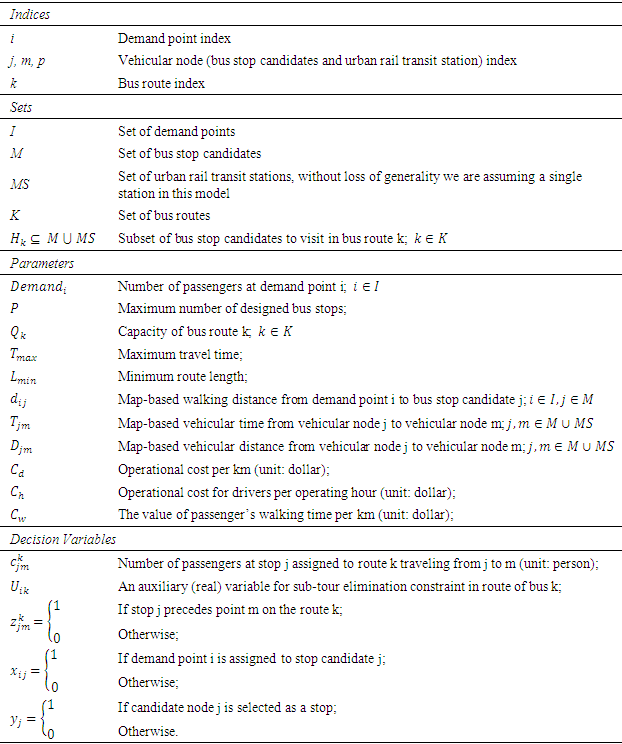
- This module features a mixed integer program to find an optimal solution. Comparing to the traditional methods in feeder bus service planning, the proposed model in the optimization module is improved to adapt the demand and OD pairs retrieved from the Demand Modeling Module as well as the travel time and distance information obtained in the Accessibility Management Module.With the notation in Table 2, the proposed problem can be formulated into a mixed integer program (MIP). In this formulation, the objective function is given by Formula (1), which includes two terms: the first term is dealing with routing and the second one is related to location selection of bus stops and assigning passengers to those targeted stops. The first term minimizes the total operational cost for designed feeder bus system and the second term minimizes the total equivalent value of the walking distances from demand points to selected stops.
|
 | (1) |
 | (2) |
 | (3) |
 | (4) |
 | (5) |
 | (6) |
 | (7) |
 | (8) |
 | (9) |
 | (10) |
 | (11) |
 | (12) |
 | (13) |
 | (14) |
 | (15) |
 | (16) |
3.4. Output Module
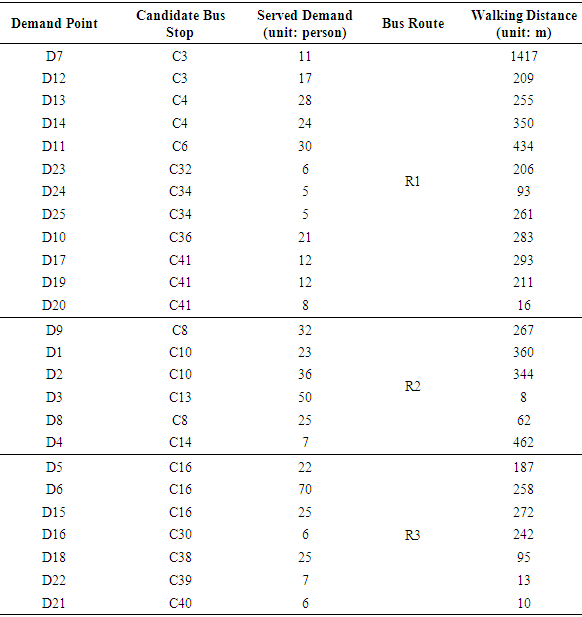
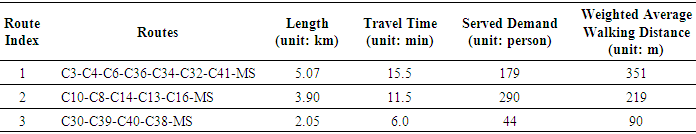
- The output module is designed to display the status and results of aforementioned tools through map-based or table-based interface and operate interactively to obtain the status and results in the output module. The proposed system features its flexibility and ease of use as a SaaS platform, where decision makers as users could log into the system through a web browser wherever Internet is accessible, and operate interactively to obtain the status and results in Output Module, including:• Table-based summary of the demand assignment, including the selected bus stop of each demand point, the number of served passengers of each selected stop, the walking distance from demand point to corresponding stop, and the stops in each specific route.• Table-based summary of routing plan, including the stop sequence of each route, route length and travel time, the demand served by each route, and the weighted average walking distance in each route.• Map-based output indicates the spatial relation between data-driven demand and optimized supply, and the direction of each route could be justified by the connected stops through different type of lines on map.In addition to the above primary functions, the output module also features its capability to examine the output of an individual tool, which provides possibility to a single usage of one particular function.Figure. 4 presents an example of a map-based output interface of the Passenger Accessibility Calculator. The geolocation of origins and destinations can be displayed interactively when user perform clicks on the map, and a status panel is designed to show the generated accessibility information.
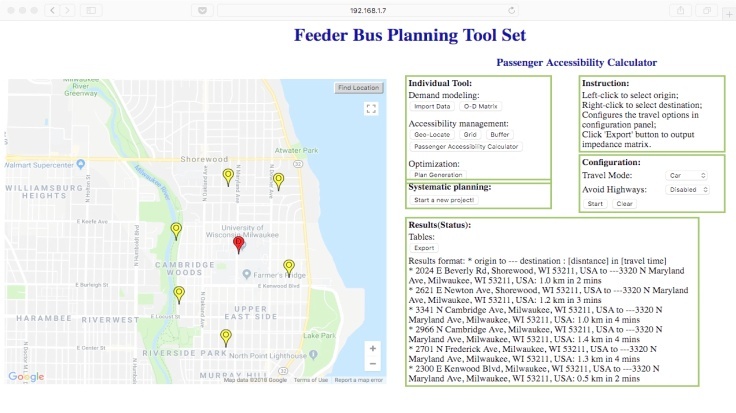 | Figure 4. Snapshot of the output interface (Passenger Accessibility Calculator) |
4. System Application
- To illustrate the applicability of the proposed data-driven feeder bus network design system, this study selected Jiandingpo Station of Metro Line 1 in Chongqing, China as a case study. As the departure station of Line 1, Jiandingpo Station is located at the west part of Chongqing. Its geographical location is given by Figure. 5.
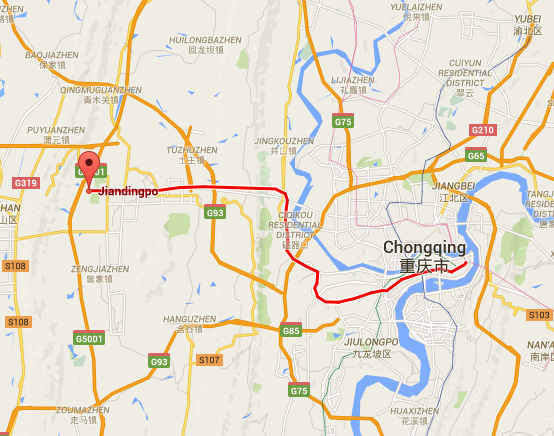 | Figure 5. Geo-location of Jiandingpo Station (Map source: Google Maps) |
4.1. Demand Modeling
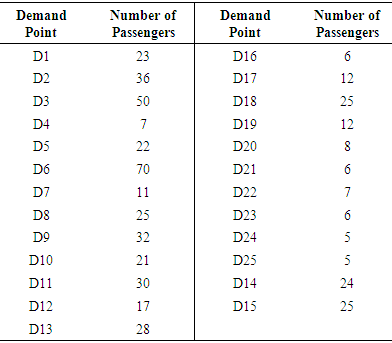
- The mobile phone dataset used in this case study to extract the spatial distribution of demand in relation to Jiandingpo station is collected from China Mobile and China Unicom (the two biggest communication operators in China) during March 4, 2015 and March 5, 2015. By applying the demand modeling module, 25 demand points containing 513 passengers who catch Line 1 at Jiandingpo Station in morning peak hour are identified and the number of passengers corresponding to each demand point is recorded in Table 3.
4.2. Accessibility Analysis
- The demand points in Table 3 can be located on the map, and analyzed with grid, buffer and local features layers in Candidate Stops Locator within Accessibility Management Module, thereby 42 candidate bus stops were selected in this step, as shown in Figure. 6 along with the demand points.
|
 | Figure 6. Spatial distribution of potential demand and candidate bus stops (Map source: Google Maps) |
4.3. Optimization and System Output
- Using the demand modeled by mobile phone dataset, distance and time matrix generated from Accessibility Management Module, the proposed optimization model was solved to optimality in CPLEX 12.6.3. Table 4 summarizes the assignment results of passengers from demand points to selected candidate bus stops and users’ specified parameters used in Optimization Module are given as follows:• No. Bus routes: 3;• Route capacity: 300 persons;• Maximum allowed No. Stops: 16; • Maximum allowed travel time for each route: 20 min;• Minimum route length: 2 km;• Operational cost for feeder buses: $3 per km;• Operational cost for drivers: $5 per hour;• The value of passenger’s walking time: $1 per hour.
|
|
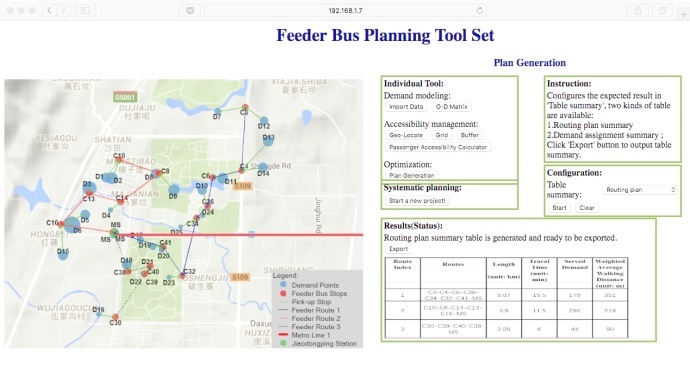 | Figure 7. Case study result (Map source: Google Maps) |
5. Conclusions
- This paper presents a data-driven tool to help decision-makers plan and design feeder bus system serving a metro station. The proposed system features its effectiveness in terms of various critical issues associates with demand detection and network planning, including mobile phone data processing, Open GIS integration, accessibility analysis, stop selection and route generation. The proposed system has integrated various supporting and functional modules to contend with real-world planning needs. A Demand Modeling Module embedded with a series of carefully-designed data mining procedures allows user to efficiently detect not only the existing passengers but also the potential customers. The Accessibility Management Module adopts an open GIS based platform to help locate the candidate bus stops with derived demand and real-word restrictions, and to generate walking distance and travel time matrices based on the candidate stops and demand points. The results derived from previous modules would be used as inputs in Optimization Module to obtain the optimal stop location and routing plan. Finally, an Output Module is designed to present the system optimal planning results through maps and tables as well as display the outputs from each individual tool for single usage.The feasibility and applicability of the proposed system is illustrated with a real-world example, Jiandingpo Station of Chongqing Metro Line. Results show that the proposed system can yield valid and detailed stop specifications and transit routing plans for feeder bus system. Future studies will be extended to consider passenger demand that don’t use mobile phones or smart cards.