-
Paper Information
- Previous Paper
- Paper Submission
-
Journal Information
- About This Journal
- Editorial Board
- Current Issue
- Archive
- Author Guidelines
- Contact Us
International Journal of Traffic and Transportation Engineering
p-ISSN: 2325-0062 e-ISSN: 2325-0070
2019; 8(2): 39-47
doi:10.5923/j.ijtte.20190802.03

Analysis of Competition and Portfolio Structure: A Case Study of Arabian Sea Container Ports
 Abstract
 Reference
 Full-Text PDF
 Full-text HTML
Faluk Shair Mustafa1, Rafi Ullah Khan1, Adhban Omar Ahmed Farea2
1State Key Laboratory of Transportation, Shipping and Logistics, NAOCE, Shanghai Jiao Tong University, Shanghai, China
2Department of Civil Engineering, University of Lahore, Pakistan
Correspondence to: Faluk Shair Mustafa, State Key Laboratory of Transportation, Shipping and Logistics, NAOCE, Shanghai Jiao Tong University, Shanghai, China.
| Email: |  |
Copyright © 2019 The Author(s). Published by Scientific & Academic Publishing.
This work is licensed under the Creative Commons Attribution International License (CC BY).
http://creativecommons.org/licenses/by/4.0/

China being the largest exporter of goods is striving to find shorter routes. Belt and road initiative (BRI) is the prime example of China’s endeavors to adopt sustainable passage for its exports to Europe, Eurasia and the Middle East. The BRI prefers Hormuz strait as an alternative to Malacca strait for economic efficiency. Therefore, current study generates valuable insights for the understanding of key points in business patterns of the Arabian Sea ports including United Arab Emirates (UAE), Iran, Oman and Pakistan. For this purpose, current study collects and analyzes imports and exports data from ten ports for the period of ten years 2008 to 2017. This study employs Herfindahl-Hirschman Index (HHI) and Boston consulting group matrix (BCG) approach to analyze and compare different ports. The results indicate that Oligopoly in the market is decreasing with the time. In addition, the findings of BCG matrix reveal that ports of UAE are more stable than ports in Oman, Iran and Pakistan. This study has profound values for the port authorities, liner companies and the concerned governments.
Keywords: Port competition, Portfolio analysis, Belt and Road Initiative, Arabian Sea, CPEC
Cite this paper: Faluk Shair Mustafa, Rafi Ullah Khan, Adhban Omar Ahmed Farea, Analysis of Competition and Portfolio Structure: A Case Study of Arabian Sea Container Ports, International Journal of Traffic and Transportation Engineering, Vol. 8 No. 2, 2019, pp. 39-47. doi: 10.5923/j.ijtte.20190802.03.
Article Outline
1. Introduction
- Ports are the mainstay of transnational trade with 90 percent of world trade being facilitated by maritime transportation [1]. This is stimulated by the thrust in global economy. This remarkable ascend in the globalized economy needs full adeptness from all the actors involved. Specifically the seaports that receive a huge support from the public in their functionality [2]. Seaports faces an enormous pressure for its efficiency in terms of international level services provision, as a country’s trade could be indicated by its port’s performances [3]. Hence, for the global comparative efficiencies, specific microeconomic programs have been formulated by the concerned countries [4].Containerization is one of the features introduced to expedite the robust increment in globalized transport trade and occupies eighty percent seaborne trade share [4], [5]. The containerization not only officiated the hub and spoke network of liner companies, but also primed the strategic appraisal of ports with sundry shipping grids [6]. Along the containerization drive summing up to the adeptness of ports, vertical integration of value-added services for supply chains were also intuited. This confirms that the port performance has intricate diversification with the time amalgamating both the hardware i.e. the infrastructure and the software which stands for the level of services provided, directing the demand of a proficient operations system [7]. To ensure the effective operations, planning and performance of ports; privatization along containerization was formulated. This trend compelled the port authorities, liner companies, governments and authors to conduct studies evaluating and assessing the ports in terms of performance, competition and facilities. Showcasing the areas of weaknesses and eulogizing the advances required in order to align the ports as per international competitive port business standards.A variety of studies have been published in transport geography related journals focusing on both container port geographical systems and liner shipping networks. Specifically, lime lighting the port competition, concentration and de-concentration ratios, and the overall port portfolio analysis. All these are considered prominent and essential factors ensuring the port efficiency and survival. However, an extensive review of previous studies related to container port efficiency shows that the majority of studies are focused on European countries, while there are limited studies that emphasis on Asian countries [8]. Some of the studies have been focused on the Southeast Asian countries, but that comprehends the countries with ports only along the strait of Malacca (Malaysia, Singapore, Indonesia), being the world’s second busiest strait for maritime traffic handling [9]. In this regard [10] asserts that if the hinterlands of two ports overlap, there could be competition between the two. With the recent economic up hail in the middle east and south Asian countries, the strait of Hormuz has been attributed as one of the busiest, handling a huge portion of world maritime traffic. It is thus important to study the Middle Eastern and South Asian area, as the container terminals in this region are located at a critical geographic position in the international maritime trade route between the East and the West. Yet, only few studies have focused so far on the efficiency of container terminals in the Middle Eastern region [11], [12]. These terminals are central, in which goods transferred between Europe and the far East/Australia are exchanged and transhipped playing an important role in the region’s economic development [12]. One of the reasons for the limited region-specific middle eastern ports analysis to date has been the scarcity of data arising from the political issues, security situation, and lack of transparency in government sectors.China Pakistan Economic Corridor (CPEC) is a highly significant project as it cuttingly reduces the distance between China and Europe. As European countries receive around 18.5% of China’s total exports [13]. Apart from a few environmental constraints because of the high mountainous topography of this route, it is considered the most viable alternative of the Malacca strait for Chinese Exports and its oil import pipelines, showing more stability & feasibility in terms of strong China-Pak relationship and lower transport cost, travel time and greenhouse gas emissions [13], [14]. Hence, the economic, environmental and geopolitical feasibility of this route cannot be ignored and its various features and trade routes need to be explored through further studies.Contestability or competition among ports or liner companies indicates the way in which these companies act and interact to save their business. It refers to the amount of business each port has in a market, which is subject to the level of services and ease of business it provides [15]. A port which fails in doing so or provides a lower quality of services will lose its business and that portion of business will be gained by another player in that market. This competition among ports can be evaluated or assessed through different methods or models. Among these methods, concentration ratios, gene coefficients and HHI are the most prominent [16], [17].HHI is an effective and efficient technique that determines the level of competition among different players in a market. This index provides a good representation of the concentration ratios in a port system environment. If the market is occupied by one player, the ratio will have a maximum value of one representing a complete monopoly of that port. However, with an increase in competition in the market, this value will get lower and a purely competitive market is indicated by zero or a value close to zero. Attributed to its effectiveness and feasibility, HHI have been extensively used in the literature to evaluate competition in various port markets across the world [15], [18]–[20].Similarly, Boston consulting group (BCG) matrix is an effective tool which not only determines the competitive statue of the ports in a port system, but also imparts valuable information for the analysis and design of port policy making procedures [21].BCG matrix is used to analyse the competition among ports based on the average market share and growth rates of the selected ports for their entire traffic or a selected portion in a specific region or market [22]. It serves as an effective tool to depict the growth rate and market share on vertical and horizontal axes, employing the four quadrants for a comprehensive representation of the port’s performance and competition. Ascribed to its salient features, it has been extensively adopted in the literature to showcase the port contestability and performance [20], [22], [23].Scant attention has been paid to examine the ports along one of the busiest strait Hormuz, with ports being in Iran, Oman, United Arab Emirates and the strategic ports of Pakistan at the external shores of Hormuz. China being the economic and export leader in the world, has huge containerized and bulk cargo, with its trade with central Asian and far east countries diverted on this route will introduce new horizons to Pakistani ports. Also, the regional ports; considered under this study will demonstrate a tough competitive rivalry in the market.Therefore, this study has been based on the analysis of competition, performance and stature of the major ports in strait of Hormuz. Moreover, the port selection for this study was based on the benchmarks that the port under consideration has to be in the strait of Hormuz or its close proximity with potential ability to hinder the business of ports inside the strait, must be a protuberant containerized port of that country, and shall parade a data source of ten years from the year 2008 to 2017.
2. Literature Review
- Port competition analysis is a prominent field of study conveying remarkable results to the port authorities, related liner companies and governments. One of the pioneer studies in this field was conducted on U.S container ports, analyzing the trend of competition among them reflected through the use of concentration ratios [24]. After that, many researchers evaluated the competition in port market on the footprints of Hayuth and used the physiognomies of various regions individually. In connection to that, the other most noteworthy studies are those conducted on the port market competition assessment of European and Hong Kong ports [16], [25]. In succession to that, the competition analysis in the Korean ports was accomplished through the use of throughput data from 1966 till 2000 incorporating Rimmer, Hyle and Herfindahl-Harshman (HHI) models [26]. Similarly, a study based on HHI model analyzed the competition between the ports in Yangtze River delta from 2000 till 2010 [27]. While the competition between the coastal ports of china was analyzed through a comparatively large data set spanning from 1982 till 2012, employing the concentration ratio [28]. The results of these studies showcase that the HHI values have dwindled over the time and competition among ports have augmented. Hence, it enlightens the importance of those studies which have analyzed the volume of traffic at the ports under consideration. The competition between ports have been assessed utilizing various techniques like concentration ratio, BCG matrix and data envelopment analysis.Instilling these concepts in evaluation, it could be seen that studies incorporating more than one of the above-mentioned techniques provide more comprehensive results. The research on Yangtze river delta shows ferocious competition between the ports with one port taking on other occasionally [29]. For instance, Shanghai port is less competitive to Ningbo port on some indicators but outweighs Ningbo port on some other measures. The analysis of ports in southeast Florida showcased a fierce competition as these ports are in an area of same importance and had the same level of facilities provision [30]. On that scale, looking at the competition between the Shanghai and Ningbo-Zhoushan port, study suggests that ports can have a competition not only between the ports of vicinity in the same country but also among the nearby ports of other countries. However research suggests that the ports of the same country shall focus cooperation rather than competition [31]. An important strategic port location along with efficient hinterland connectivity, auspicious political and government dogmas and effectual liner companies have substantial assistance to the success of a particular port or port system [32]. A series of studies conducted from 1963 to 2008, revealed that the port tactical location, environs connectivity and port competition are the most protuberant aspects involved in port growth [33]. Moreover, the strategic importance of ports is further increased by the business of the oceans or straits in which they are situated. The strait of Hormuz is being recognized as the busiest in terms of traffic volume as it serves as a source of connectivity between the East and West, imparting the ports in vicinity a prestigious strategic preference [12]. In order to evaluate the geographic and strategic importance of ports, the BCG matrix has been recognized as the most appropriate and successful tool [34]. Similarly, the strait of Malacca has been recognized as the world’s second busiest, which is in the south East Asian region. BCG matrix have been used to evaluate the competition among the ports based on their strategic location and the vigorous shift in their business in the Asian ports [35]. Apart from that various other authors used the BCG to analyze tactical prominence of ports in various regions [36].Furthermore, the top 20 container ports in south East Asian region, specifically of the (ASEAN-5) countries were evaluated through the use of dynamic portfolio analysis to assess the strategic competitive position of these ports. Moreover, to determine which ports have been performing well recognizing the value of their strategic importance and which ports remained behind in performance, along the recommendations for future developments in the identified weak areas [37].Recognizing the importance of strategic trade routes and ports, China has introduced a new geo-economic policy of Belt and Road Initiative, among which the most prominent is the CPEC, which will provide easy access to Chinese products in to the European, Far East and Central Asian markets. There is a scarcity in the literature for such studies which covers the ports involved in CPEC and the adjacent most important & busiest strait of Hormuz.
3. Data Collection
- To ensure the credibility of this study, the data had to be from widely recognized sources. Hence, the imports, exports, and the overall container throughput trade data of these ports was taken from the world bank annual reports. Since the data for this had to be classified into imports and exports, hence this detailed data was taken from the economic surveys and reports released by the Finance ministries of each country annually. The ten years’ data obtained from these sources was further classified into three section. The first section was based on the time frame from 2008 to 2010, the second time frame ranged from 2011 to 2013, while the last time frame was from 2014 to 2017.
4. Empirical Analysis
4.1. HH Index
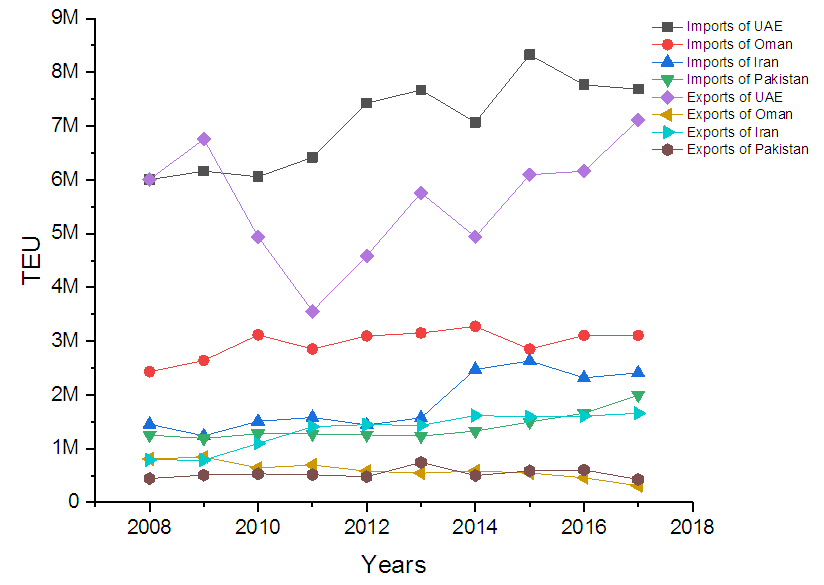
- There are various ways of checking and calculating the market competitiveness and market concentration, but HH Index is considered to be the most common and recognized one. The Herfindahl-Hirschman Index (HHI) is a normally used instrument for checking and measuring of market concentration that relates to exhibit the market competitiveness. The formula to calculate or its mathematical equation comprise of squaring the market share of all the firms that are competing in a range in market, and then adding up the numbers, and after that divide it by the overall square of the sum to get a ratio. It can vary from 0 to 1 in the ratio form or zero to 10 thousand as a whole.
 | (1) |
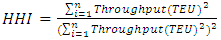
 | Figure 1. Imports and Exports TEUs (2008-2017) |
 | Figure 2. Herfindahl Hirschman Index of Arabian sea container ports (2008-2017) |
4.2. BCG Matrix
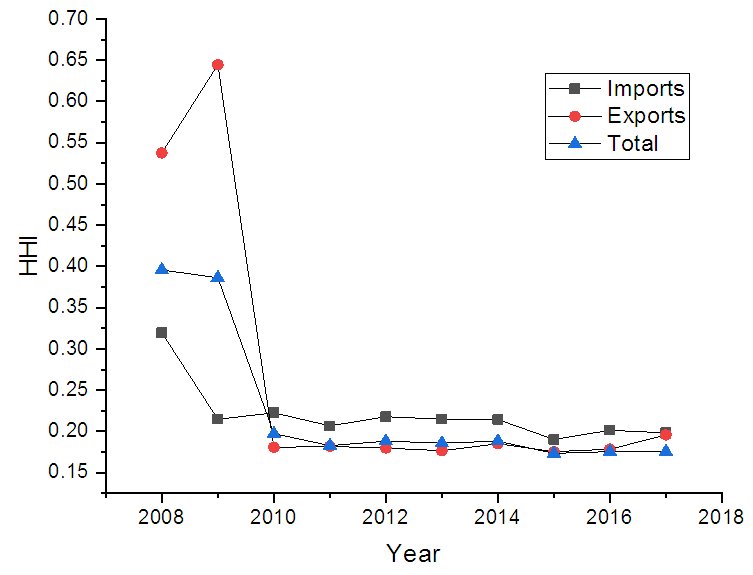
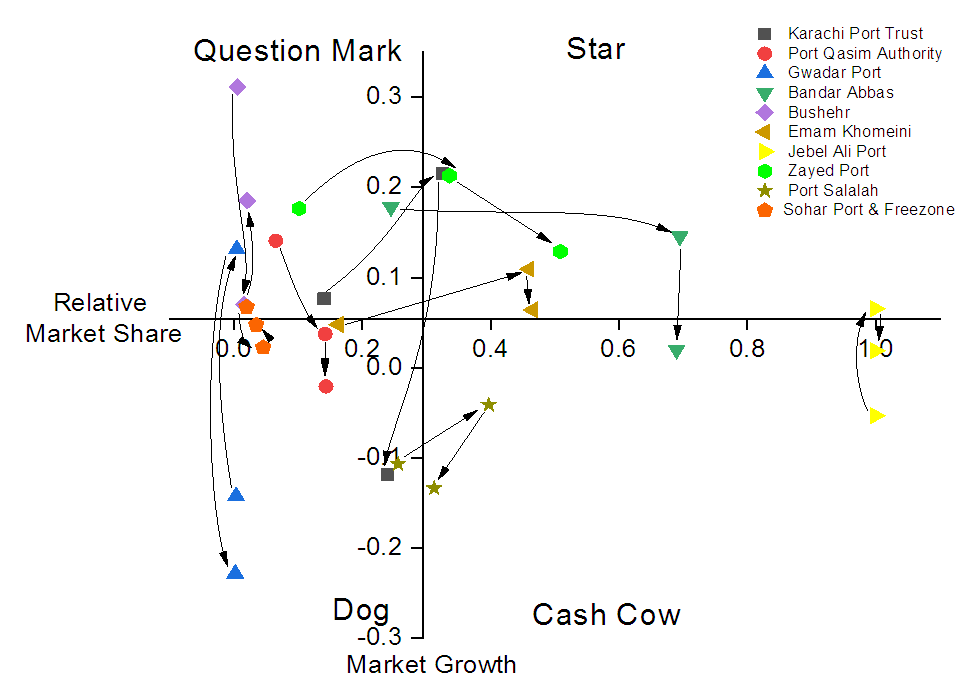
- BCG (Boston Consulting Group) is a broad concept and generally classified as static and dynamic BCG. The static BCG is meant to analyze the performance and planning of various organizations by evaluating the relationship between the respective average growth rate and the corresponding average relative market shares. This approach does not consider the future prospect, which is an important feature, hence the concept of dynamic BCG matrix has been introduced that analyze the performance as per time factor, specifically in ports domain it is used to evaluate the changes in port competition and performance with the passage of time. The data is populated into horizontal and vertical matrices, which are then used to determine the corresponding relative market shares and the average growth rates respectively. The relative market share and average growth rate of ports are being evaluated by the use of a graphical BCG scale which comprises of quadrants namely as Star, Question Mark, Cash Cow and Dog. During analysis those ports which appear in the Question Mark are considered to have higher growth rates but relatively lower market shares. Hence these ports could be attributed as in between their initial stages and primary levels of growth in their life span. Those ports which appears in Star are regarded as having higher growth rates along major relative market shares. Hence these ports could be termed as more successful having grasp over a major portion of trade in the market. Similarly, those ports which appear to be in Cash Cow are considered as having higher relative market shares, with hold over a major portion of the market but shows a comparative low growth rate. Such ports are in a position viewed as between the later peak level and the beginning of their fall. While those ports which appear to be in the Dog are considered as the ports with minimal performance and least achievements in trade market having low growth rates and at the same time has very low to minimal relative market shares. From the perspective of their performance these ports are considered to have a dwindling future, and shall be analyzed on the basis of any potential growth prospect for future.The dynamic BCG matrix was used to analyze the performance of all the ports considered for this study, as per the three groups to which they have been divided on the bases of time. Firstly, the analysis has been made for the imports business of the ports.Looking at the Figure 3, it can be seen that only Port Salalah was in Star from 2008 till 2010 showing a remarkable performance, but it fell to Cash Cow in the second time frame from 2011-2013, and showed a little progress in third time frame from 2014-2017, but still remained in the Cash Cow. Jebel Ali Port was observed in the Cash Cow during the first-time frame, but it showed significant growth with the passage of time and moved to Star in the second time frame. In the next time frame it showed a little decline in its business endeavors but still managed to be in Star. The import performance of Pakistani ports exhibited a mixed trend as Karachi Port trust had a remarkable performance with a good start and ending in the star with a good performance. However, Gwadar port and port Qasim Authority had a minimal performance in imports. While Zayed port of UAE and Sohar port & free zone of Oman were not that significant in imports.
 | Figure 3. BCG analysis for Import trade |
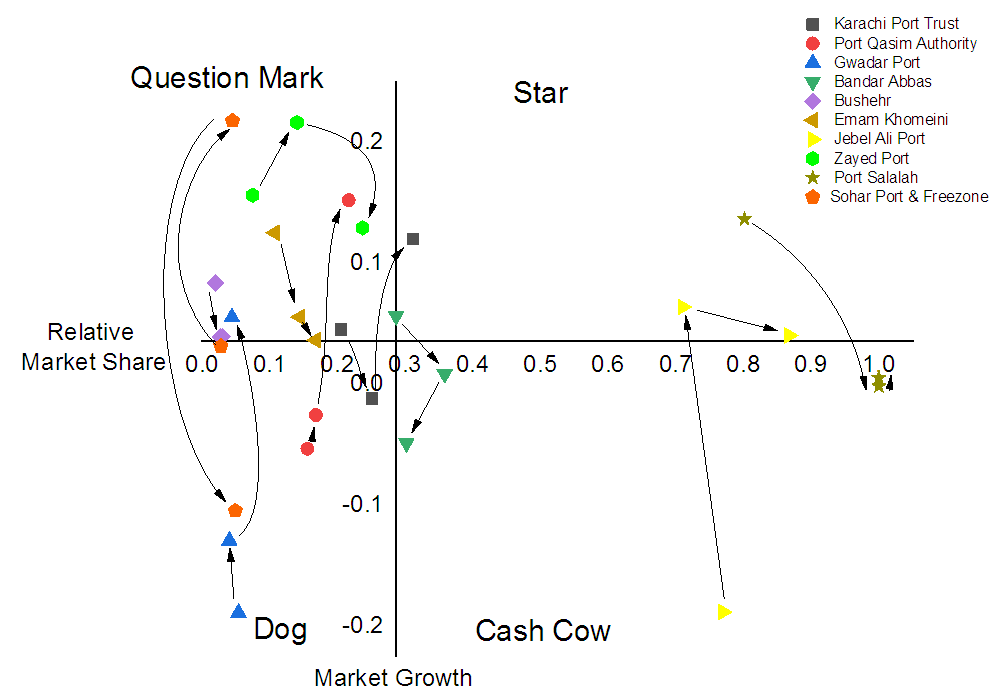
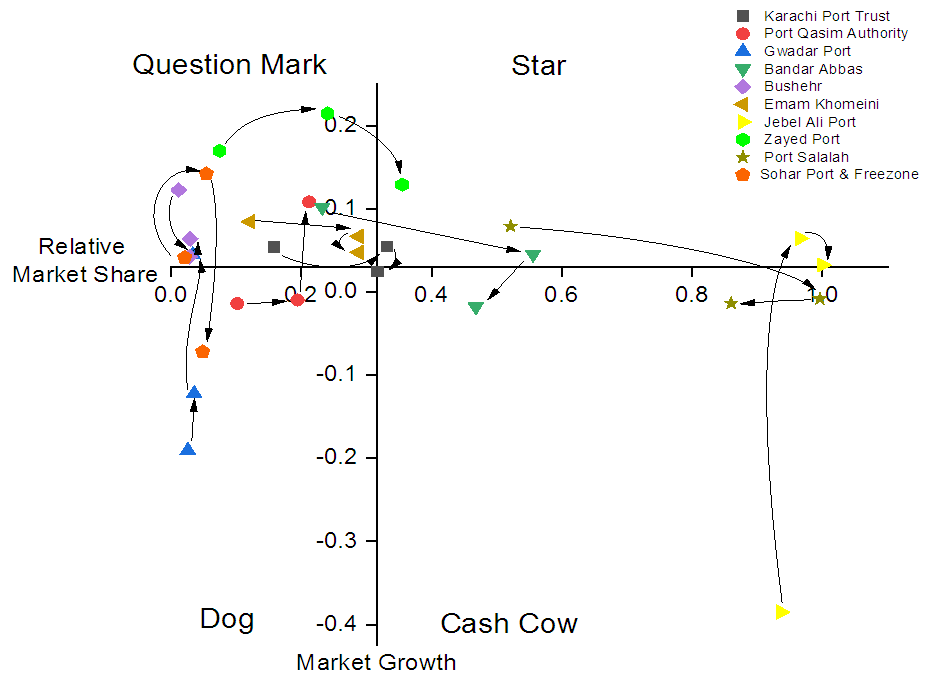
 | Figure 4. BCG analysis for Export trade |
 | Figure 5. BCG analysis for the Total trade volume |
|
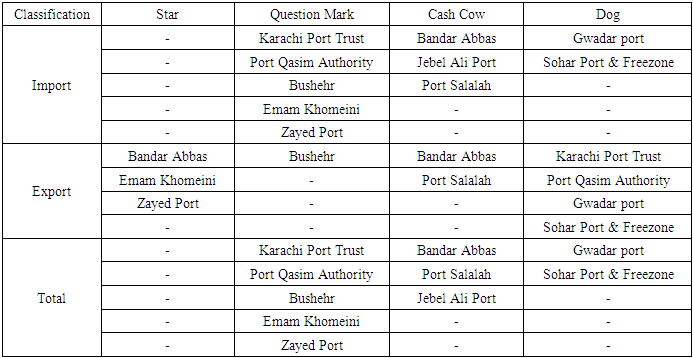
5. Conclusions
- In this study the trade volumes of the Arabian Sea prominent ports for a period of 10 years were classified into exports and imports. These were analyzed through HHI and BCG matrix tools to evaluate the competition, the overall performance and stature of these ports over the time. These tools are vastly accepted and utilized in the literature to analyze the ports business in different geographies of the world. These tools are considered as a reliable tool to assess the performance and competition, and consequently devise concerned policies and decisions based on these results. The results obtained in this study indicate that over the time, oligopoly is decreasing and the ports moving towards a concentrated market with a ferocious competition year after year. The portfolio analysis of the ports under study accomplished through BCG matrix indicates that, dealing with the imports only, the Karachi Port Trust, Port Salalah and Jebel Ali Port exhibited a prominent and steadfast business performance by maintaining themselves in the Star. While ports with insignificant and relatively poor performance which remained in the Dog and Question Mark criteria over the time, are that of Gwadar Port and Port Qasim Authority. Furthermore, Emam Khomeini and Sohar port & Freezone showed the worst performance by being in Question Mark initially and dropping down to Dog with the passage of time. Similarly, in exports the Bandar Abbas, Jebel Ali Port, Zayed Port and Emam Khomeini showed better performance being in Star. Moreover, Sohar Port & Freezone, Port Qasim Authority, Karachi Port Trust and Gwadar Port showed poor performance which mainly could be attributed to the poor export performance and policies by the local governments. The overall business stature of Zayed Port and Jebel Ali Port were significant as they remained in Star. Since the belt and road initiative by China have introduced new business horizons for the ports in this area, hence it is recommended that in future the concept of cooperation among these ports needs to be studied with its effect on the overall efficiency of these ports. Apart from that, various factors affecting the port performance in these areas needs to be determined. Also, the feasibility of various alternative trade routes needs to be evaluated so that the geographic and strategic importance of these ports could be enlightened and the world could have a better, sustainable and greener option for transport.