-
Paper Information
- Paper Submission
-
Journal Information
- About This Journal
- Editorial Board
- Current Issue
- Archive
- Author Guidelines
- Contact Us
International Journal of Traffic and Transportation Engineering
p-ISSN: 2325-0062 e-ISSN: 2325-0070
2019; 8(2): 25-28
doi:10.5923/j.ijtte.20190802.01

Analysis of Emergency Response to Crashes Based on Demographic Parameters
 Abstract
 Reference
 Full-Text PDF
 Full-text HTML
Dinakara Abburi, Mehrnaz Doustmohammadi, Michael Anderson
Department of Civil Engineering, University of Alabama in Huntsville, Huntsville, USA
Correspondence to: Michael Anderson, Department of Civil Engineering, University of Alabama in Huntsville, Huntsville, USA.
| Email: |  |
Copyright © 2019 The Author(s). Published by Scientific & Academic Publishing.
This work is licensed under the Creative Commons Attribution International License (CC BY).
http://creativecommons.org/licenses/by/4.0/

Timely emergency response to crashes has the potential to save lives. As such, emergency vehicles have priority in traffic with the goal of minimizing response time. However, even with traffic priority, it sometime takes a long time for emergency vehicles to arrive at the scene of a crash. This paper examines the difference in response times between different locations in Alabama – essentially the difference in response time between rural and urban crash locations. The data used in this paper for analysis include over 560,000 crashes that occurred in Alabama during a 5 year period, of which roughly 125,000 had emergency vehicles deployed to the crash location. From the analysis, there was a clear difference in response time between urban and rural counties, which has a significant impact on the safety of the residence in rural locations where the population tends to be older and roadways tend to have a higher speed. Both of these situations are potentially hazardous leading to an increase in severity of crashes, which will increase the need for emergency medical service.
Keywords: Traffic Crashes, Response Time, County Differences
Cite this paper: Dinakara Abburi, Mehrnaz Doustmohammadi, Michael Anderson, Analysis of Emergency Response to Crashes Based on Demographic Parameters, International Journal of Traffic and Transportation Engineering, Vol. 8 No. 2, 2019, pp. 25-28. doi: 10.5923/j.ijtte.20190802.01.
Article Outline
1. Introduction and Background
- Travel demand continues to grow every year, and with the growth comes a corresponding increase in traffic crashes. Traffic crashes have a large impact on society in terms of cost, delay and injuries/fatalities. Emergency response plays a very crucial role in reducing the impact of crashes by providing medical response to injured travellers and supplemental transport to medical facilities for care [1-5]. As such, emergency vehicles are given priority on roadways to assist in reducing response time to allow for critical care to be provided. Previous research has indicated that improving emergency services at crash locations is essentially related to reducing the response time associate with arriving at the crash location [6-16].While studies are being conducted related to improving response time and impact of improved response time, this paper examines difference in response time based on location of the crash in Alabama. The objective of this paper is highlight the differences in response time associated with the location of the crash and present issues associated with differences in response time as they relate to the population being served and roadways travelled. The paper contains a comparison of emergency response times for 10 different counties in Alabama that have different demographic, socioeconomic and geographical background. The paper shows that rural crashes often have a higher emergency response time, which when examining the population characteristics, rural counties tend to have older citizens, and roadway characteristics, rural counties tend to have more mileage of higher speed facilities based as a percentage of total roadway miles, lead to a situation of greater impact for increased response time.
2. Data Collection and Methodology
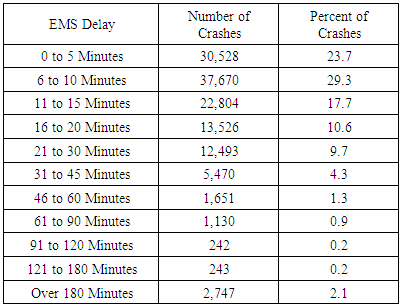
- The crash data used in this research paper were obtained from the Critical Analysis Reporting Environment (CARE) maintained by the Center for Advanced Public Safety (CAPS) at the University of Alabama. The demographic and socioeconomic data were downloaded from the census website [17].The crash data records include a detailed report on the crash prepared by the first officer on scene. The crash database had over 560,000 crashes which occurred between 2010 and 2014. Of the total crashes, only those in which emergency personal were called to the crash location were included. This reduced the number of crashes used in the study to just over 140,000. The crash data obtained contains a variety of details including time, location, weather, urban/rural, age of the driver/drivers, gender of the driver/drivers, to name a few items. In addition, the data also contains the time for emergency vehicle response if requested/required. The emergency response time is divided into 11 time frames. The number of crashes as well as corresponding percentage of crashes in each time option is shown in Table 1.
|
3. Ten County Analysis
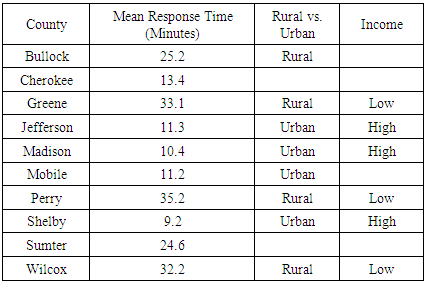
- The aggregate analysis of crashes and emergency response resulted in mainly typical crash numbers. To further the analysis, ten specific counties in Alabama were selected to add demographic data to enhance the analysis. The counties selected had unique population levels, median income, age distribution, and land area. The 10 counties selected were Bullock, Cherokee, Greene, Jefferson, Madison, Mobile, Perry, Shelby, Sumter and Wilcox. Table 2 shows some of the demographic data used to identify differences between the counties. The urbanized counties include Jefferson, Madison, Mobile and Shelby, each part of an urbanized area as defined by the census, while the most rural counties are Bullock, Greene, Perry and Sumter. The high income counties include Jefferson, Madison and Shelby while the low income counties include Greene, Perry and Wilcox. The largest counties by area are Mobile, Jefferson and Sumter and the smallest counties by areas are Bullock, Cherokee and Greene. Table 3 shows the percent of time required for emergency response in each county.
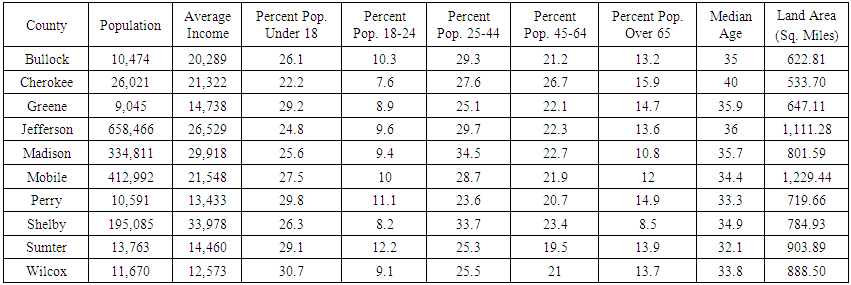 | Table 2. County Demographics |
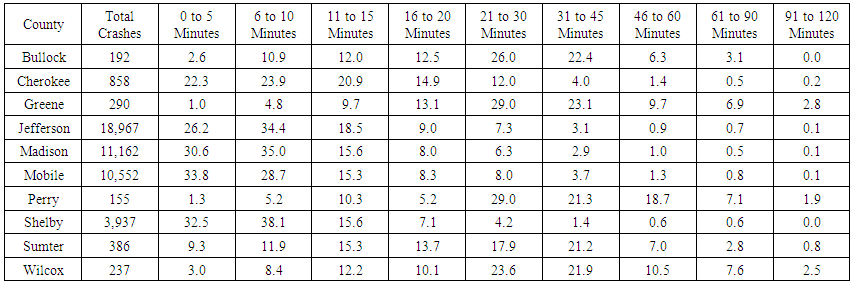 | Table 3. Percent Response Time for Crashes |
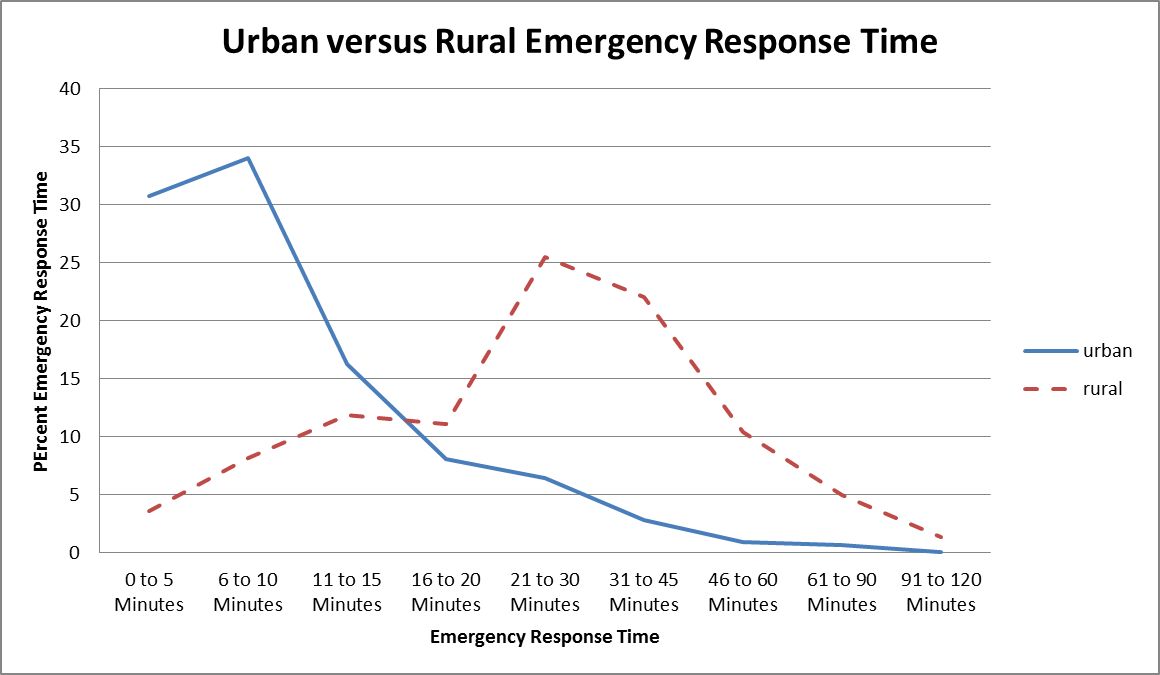 | Figure 1. Urban versus Rural Emergency Response Time |
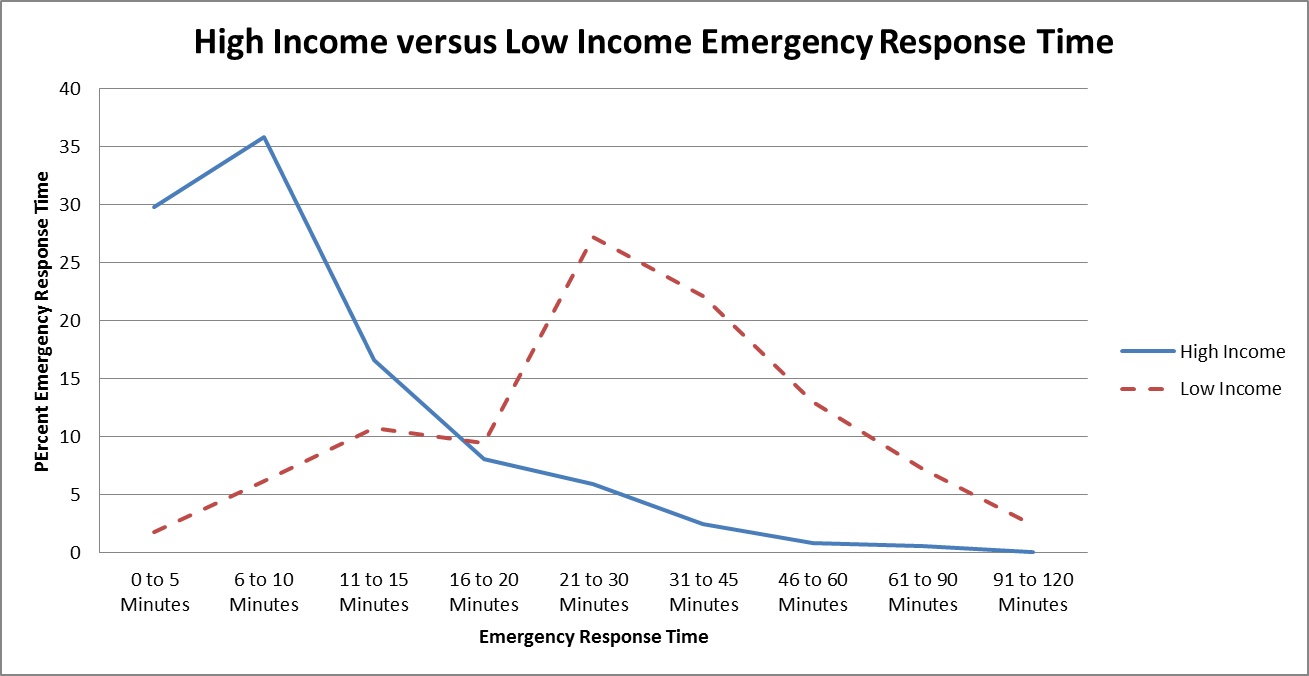 | Figure 2. High Income versus Low Income Emergency Response Time |
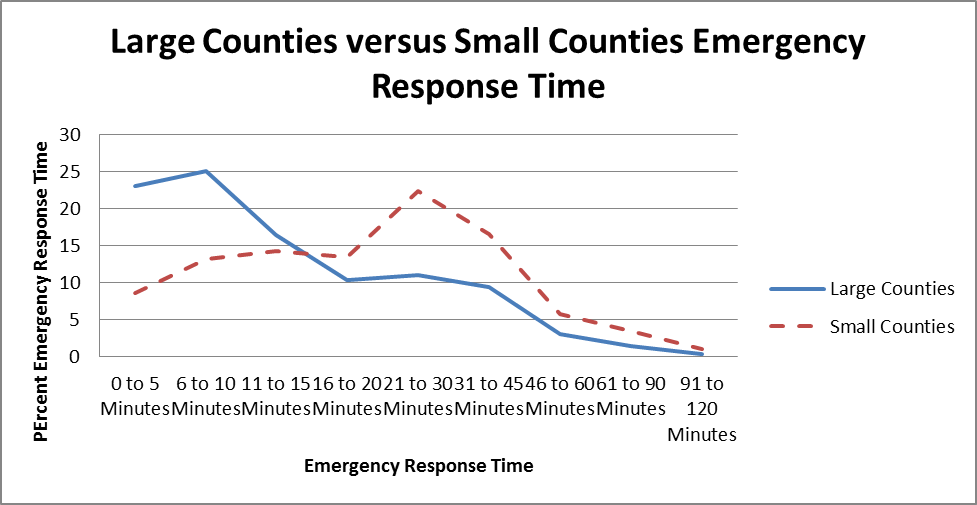 | Figure 3. Large County versus Small County Income Emergency Response Time |
|
4. Conclusions
- Results clearly illustrate that the lower income, rural counties have a higher average response time than the higher income, urban counties. Considering roadways in rural counties tend to be higher speed as a percent of total miles and the demographic in rural counties tend to have a slightly higher percent of the population aged 65 or older, the delay in emergency response is very important as traffic crashes in rural area have a greater likelihood of involving elderly drivers traveling at high speeds, which will lead to increased severity and a greater need for emergency services. Additionally, as the demographic in rural areas will continue to be an increase in elderly drivers, this problem is only going to worsen in the future.Overall, while this analysis is limited, the results are important for agencies to understand the difficulty in providing shorter emergency response time in rural areas. A possible result of this paper could possibly be new measures leading to a better understanding of the placement of emergency response vehicles in rural counties to reduce the travel time to crashes. Additionally, the access to rural hospitals, especially those with trauma centers, while not addressed in this work can be another important consideration in developing infrastructure to better support rural counties. The improvement of response time in the future has the potential to reduce health care costs in rural areas and improve quality of life for those unfortunate enough to be involved in a serious traffic crash.
ACKNOWLEDGEMENTS
- The authors would like to thank the Alabama Department of Transportation for the crash data.