-
Paper Information
- Paper Submission
-
Journal Information
- About This Journal
- Editorial Board
- Current Issue
- Archive
- Author Guidelines
- Contact Us
International Journal of Traffic and Transportation Engineering
p-ISSN: 2325-0062 e-ISSN: 2325-0070
2019; 8(1): 18-24
doi:10.5923/j.ijtte.20190801.03

Smart Transportation Methods - Resolving Traffic Congestions
 Abstract
 Reference
 Full-Text PDF
 Full-text HTML
Raghavendra Devidas1, Hrushikesh Srinivasachar2, Dayakar Devaraiah3, Jayashree Babu1
1IT/QIM, Mercedes Benz Research & Development India Pvt ltd, Bengaluru, India
2IT/QIE, Mercedes Benz Research & Development India Pvt ltd, Bengaluru, India
3RD I/TBE, Mercedes Benz Research & Development India Pvt ltd, Bengaluru, India
Correspondence to: Raghavendra Devidas, IT/QIM, Mercedes Benz Research & Development India Pvt ltd, Bengaluru, India.
| Email: |  |
Copyright © 2019 The Author(s). Published by Scientific & Academic Publishing.
This work is licensed under the Creative Commons Attribution International License (CC BY).
http://creativecommons.org/licenses/by/4.0/

Commuting between any two points in urban areas with a high density of population and vehicles, with a low commute time is one of the greatest challenges. As we understand during the course of study of solutions to aforementioned challenge there are many solutions attempted by building many flyovers & underpasses etc. But none of them have been able to address the Traffic chaos situations. Especially in the developing economies in Asia the demands are high for infrastructure. And the challenges are not any low in Europe and US. After a deep study and analysis on the existing techniques employed to address this problem, and their limitations we propose this novel idea to address Traffic congestion issues. With our research & observations at Silk Board Junction in Bangalore, one of the busiest junctions at different time frames, we are confident that this would result in a great reduction of commute time to an order of up to 50%. This manuscript is prepared for resolving the challenges of traffic management, using the latest transportation technologies and engineering. This is a new method of handling Traffic congestions in urban areas. Keys highlights of the idea are listed below. Ÿ The idea offers great advantages such as reduced commute time overall, better traffic movement. Ÿ Very low additional expenditure (infrastructure) in comparison with other conventional solutions tried. Ÿ Best suit for densely populated cities with ultra-modern urban infrastructure. Ÿ Can also be implemented in cities of Developing countries. Ÿ Increase the number of vehicles crossing a traffic signal per unit time by accelerating before the signal.Ÿ Simple re-ordering of the infrastructure components helps in resolving traffic bottlenecks.
Keywords: Efficient Traffic Management, Smart Traffic management, V2X for smooth traffic, Urban planning, Smart city, Traffic & transportation engineering
Cite this paper: Raghavendra Devidas, Hrushikesh Srinivasachar, Dayakar Devaraiah, Jayashree Babu, Smart Transportation Methods - Resolving Traffic Congestions, International Journal of Traffic and Transportation Engineering, Vol. 8 No. 1, 2019, pp. 18-24. doi: 10.5923/j.ijtte.20190801.03.
Article Outline
1. Introduction
- Traffic congestions are one of the modern day’s biggest obstacles for human well-being. They cause huge discomfort, stress, and strain besides causing excess pollution. It is practically impossible to deal with the demands of traffic management by only infrastructural advancements. We feel there is a need for unconventional approaches to tackle this chaos of traffic. We feel it is possible to improve the current situation by making efficient use of Time & Space. One of the great innovations of this century, viz Relativity, inspires our proposals in this article. We do not mean to derive and use a complex formulation from relativity. However, our ideas presented here are greatly influenced by the great theory of relativity. Relativity, Time Dilation with increased speed (We do not mean to travel with the speed of light!).In our model, we propose efficient use of Time & Space and increase the overall travel experience by reducing the commute time. Yes. With no excess expenditure on infrastructure. You might wonder how this is possible and you might ask, you mean with new Fly Overs, Underpasses and new Roads or by adapting to new means of transport? The crisp and clear answer from us is No; it is a solution using existing infrastructure.
2. Methods
2.1. The Current Situation
- The amount of time spent on roads in any urban area is at least 20 to 30% of our productive time. Increasing traffic is causing health risks due to excessive pollution. The demands for infrastructure are on the rise. We resort to multiple forms of commute like City Rail Transit, Travel Pods (in some countries). The commute time from Point A to point B is very high during peak hours. Time & Money is spent on infrastructure upgrades, rather than looking out for innovative solutions in optimizing the existing situation. Astonishingly the existing infrastructure is not utilized completely to its full potential.
2.2. Existing Systems
- The infrastructure costs are soaring high. We are running out of space inside city limits for further expansion. Some of the non-infrastructural measures we are aware of are:Ÿ Defining time windows for category of vehicles.Ÿ Utilizing alternate roads.Ÿ Car Pooling.Ÿ Using Public transportation.Ÿ Further investments on Alternate transit. Such as Rail transit etc.
2.3. Challenges
- Ÿ Excessive expenditure on InfrastructureŸ Exponential increase in the number of vehicles on the road. Ÿ Adapting the infrastructure to ever-growing demand is impractical.Ÿ Limited space is also a constraint.Ÿ Expansions need re-architecting the city.
3. Reasons for Traffic Congestions
- There are multiple reasons for traffic congestions such as higher vehicle density, infeasible road conditions, poor infrastructure etc. Our approach here was to try and find better solutions for traffic with minimal expenditure because conventional solutions for building new infrastructure are already known and are not affordable at all points of time.With this perspective of finding an economic & efficient implementable solution, we looked at all those factors that occur at a signal junction. What caught our attention was the number of vehicles that crossed the signal in a given signal window. We were surprised that this was very less. When we looked at how this can be improved, it occurred to us that we have to increase the speed of the vehicles when the signal is green. So to increase the speed we targeted the following main reasons causing traffic congestion: Ÿ Reaction TimeŸ Start (Acceleration) from rest.
3.1. Reaction Time
- The major cause for increased commute time in urban areas is due to the reaction time of the driver of the vehicles. Whenever the signal indicator turns from Red to Amber/yellow and then to Green, the vehicle driver in the Lane has to wait for each of the drivers ahead of him/her to start the vehicle (sometimes). Also, many times the Drivers of the vehicles do not have their attention on the signal indicators and the reaction time is at least 1 to 2 seconds. Overall the reasons for reaction time are:Ÿ Time to get the attention on signal change.Ÿ Time to switch gear (The effect is minimal in case of automatic transmission)Hence, the overall wait time is more due to accumulated reaction times of all the vehicle drivers ahead of the vehicle under consideration.Thus, the reaction time of the drivers is one of the major factors, which leads to traffic congestion. However, if all the vehicles on the road are autonomous (Level 5) this effect is negligible.
3.2. Acceleration from Rest
- The signal window of any traffic junction is very crucial time duration. This time duration has to be utilized efficiently so that more vehicles can cross the signal. However, this crucial time duration is consumed for acceleration from rest. I.e. overall speed of the vehicles in this zone is reduced to a mere range of 20 – 30 km/hr. This range varies depending upon the road conditions.Overall, this is one of the decisive factors in reducing the number of vehicles that cross the traffic signal. Thereby increasing the wait time on the road.
4. Results
4.1. Fastest Traffic Movement Algorithm
- As per our studies, we cited the reaction time of drivers and the acceleration from rest at the traffic signal junctions lead to more commute time overall.We carried out live experiments in various cities and derived the factors to quantify the time and vehicle movement. We also present here a new Formula for optimum vehicle movement.
4.2. Smart Urban Vehicle - Algorithm
- This algorithm is based on the principle that the vehicles are made to attain higher speed before the actual signal starts ticking. This helps in the movement of a greater number of vehicles. This is achieved by installing an additional signal on each direction of the Signal junction. These two consecutive signals operate in a synchronized manner. Such that when the first signal is green and the vehicles start moving. By the time these vehicles reach the second signal, the traffic lights would turn green. The distance between the consecutive signals is at least 50 Mtrs because only then this methodology could be effective and the area between the first (newly installed) & the second (existing) signal should be utilised as the space for increasing the speed of the vehicles. This area will be used, to overcome the driver reaction time of vehicles' drivers as well. Also, the distance between the signals and the signal time windows together determine the number of vehicles that cross the signal.The equation is devised using the following parameters:Ÿ Vehicle densityŸ Vehicle dimensions such as length of the vehicleŸ Distance between the consecutive Traffic SignalsŸ Number of Lanes on the RoadThe Stopping distance (The position of the second signal) is calculated for the set of vehicles travelling in a particular direction of the Road. The Stopping distance thus calculated enables a number of vehicles to cross a traffic signal, by offering more space to accelerate. This avoids "Stop & Proceed" scenarios to overcome Phantom traffic jams. The following are the Advantages offered:Ÿ Reduced Journey time in a traffic congested area.Ÿ Increased fuel efficiency due to increased average speed during the Transit.
4.3. Equation
- NV=(S*NL)/Lv*fAs per NV = No of vehicles that can cross the signalS = Speed of the vehiclesNL = No of Lanes in the roadLV = Length of the vehiclesf = Constant factor equivalent to 0.25The duration of the consecutive signals (the newly installed prior signal and the actual signal) and their timing should be decided based upon actual observations and the road conditions.
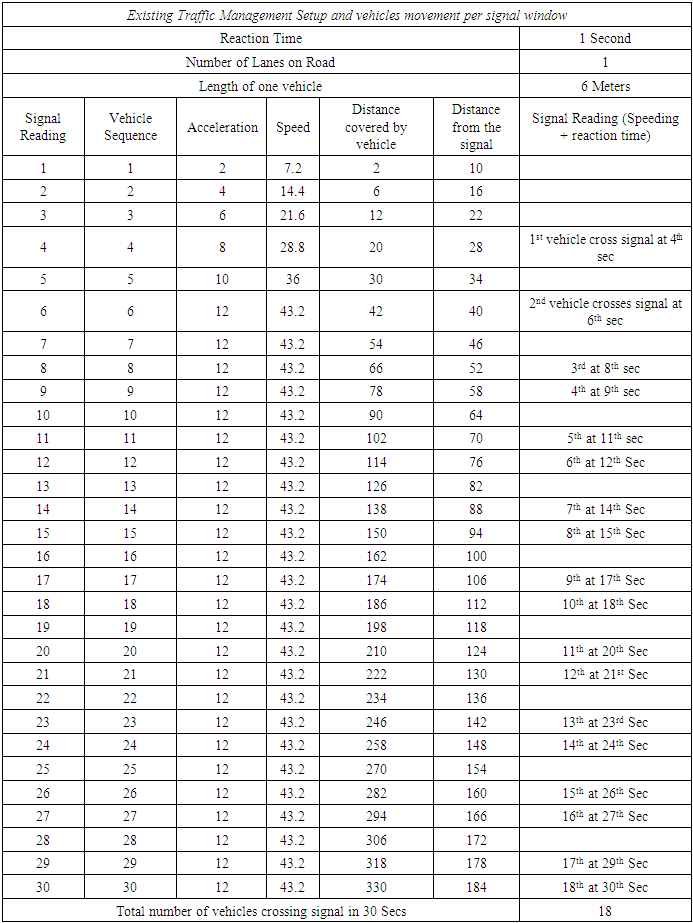
4.4. Explanation of the Idea with an Analogy
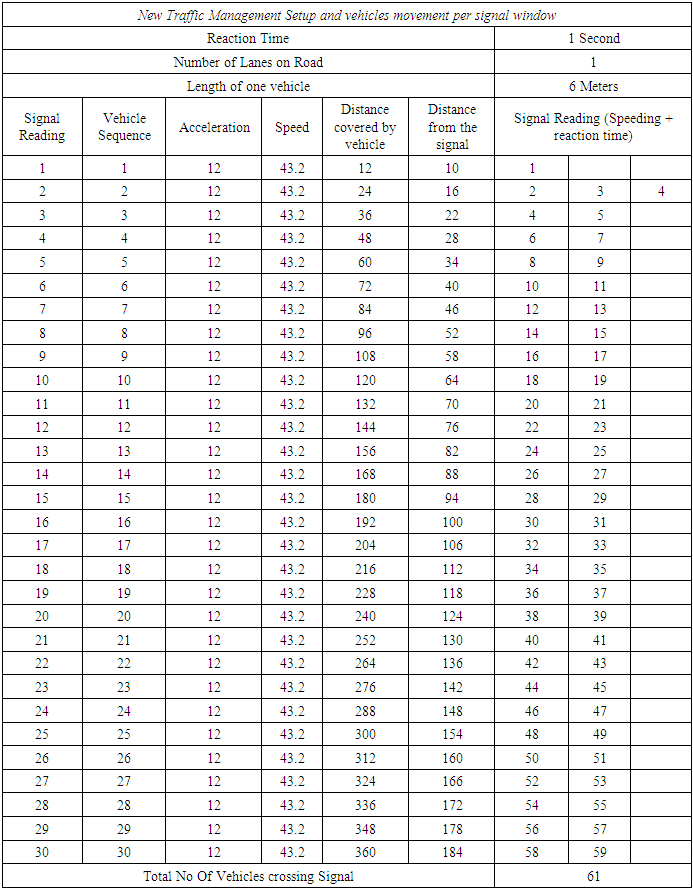
- How can we double the number of vehicles crossing the signal, without increasing the signal time window?Let us say if we increase the signal time window from 60 Secs to 120 Secs, this can double the no of vehicles crossing the signal from a particular direction. Unfortunately, the commuters in the other directions have to wait double the time than before.Surprisingly it is possible to achieve the expected result without doubling or increasing the wait time of other directions. By simply moving the signal start position to a computed spot before the actual signal (Stopping position).The second signal at this computed new spot will read 120 Secs and the actual signal will still read 60 Secs. Now, these are two different frames of reference. The driver/commuter will refer to the newly posted signal (either Physical signal – Conventional vehicles Or Virtual signal – For Autonomous vehicles) and start moving. When they move towards the second signal the average velocity/speed of the vehicles would be higher than before. As a result of this, more vehicles can now cross the signal due to the increased average speed of the vehicles and nullified driver reaction times.The following picture shows the comparison of time and fuel usage with the current setup against the proposed idea.
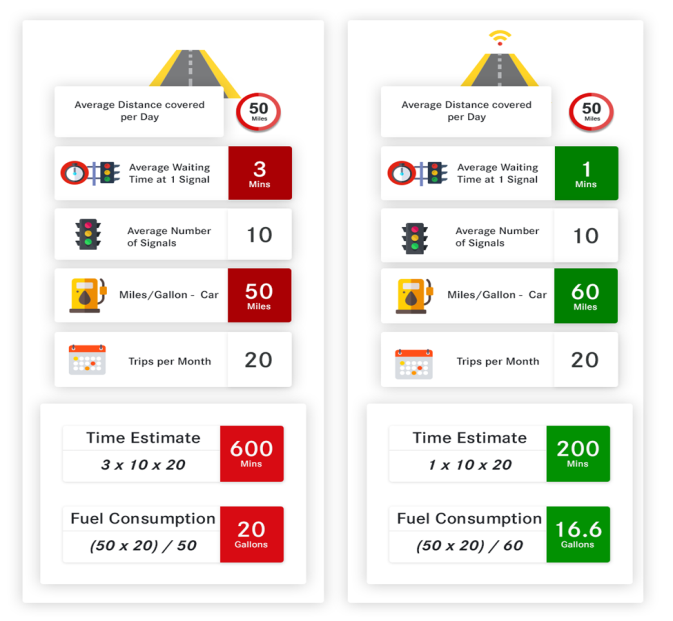 | Figure 1. Comparison of Time spent & Fuel consumption: Current Vs New Proposal |
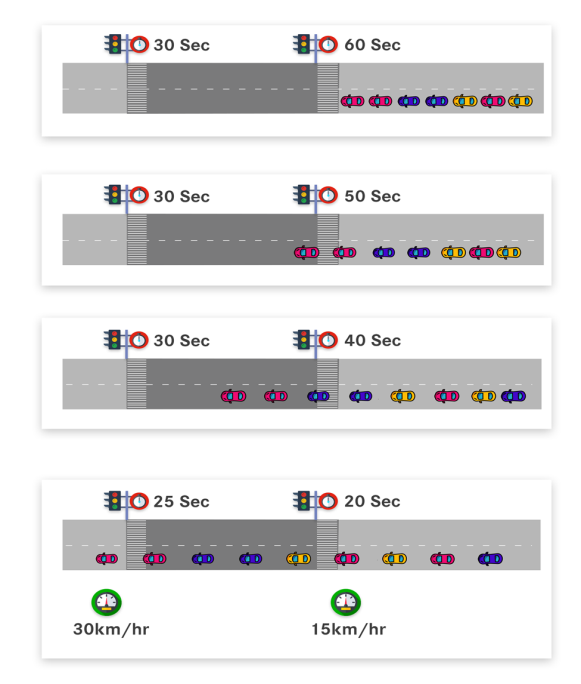 | Figure 2. New signal operated with the original Signal. Observe the increased average speed |
4.5. V2X Solution for Ultra-modern Urban Infrastructure
- In order to apply this design for cities with ultra-modern infrastructure, traffic signals should be equipped with V2X capabilities. Besides, the Signal posts should communicate the stopping distance. Additionally, each one of the vehicle on road is assumed to be capable of communicating with the traffic control centre. From the statistics, it is witnessed that the number of vehicles crossing a signal, increased by at least 50%.
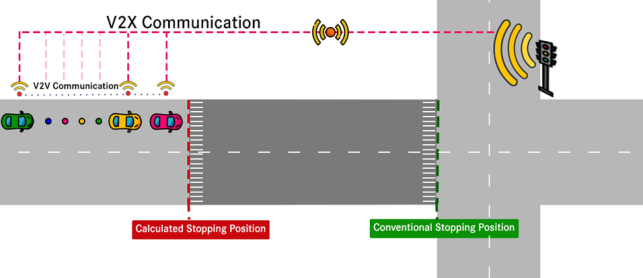 | Figure 3. V2X Implementation (Dynamic computation of vehicle stop position) |
4.6. Traffic Optimization for Existing Infrastructure – Smart City Planning
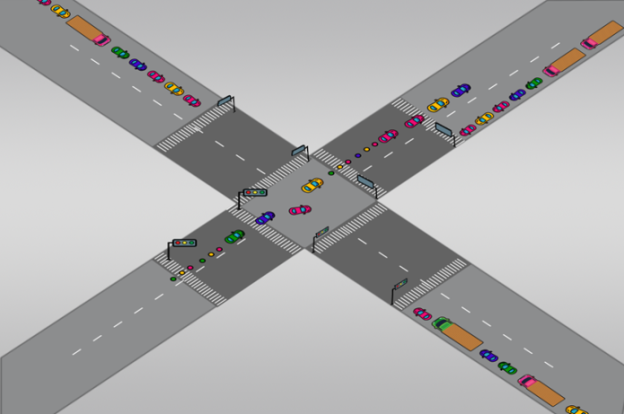
- This solution can be implemented in the existing infrastructure without V2X capabilities either in the vehicles or in the surrounding environment. This method of traffic management is easier to comprehend for it merely needs to install a dummy / prior signal before the actual signal for establishing an additional time to overcome delays. Current situation:
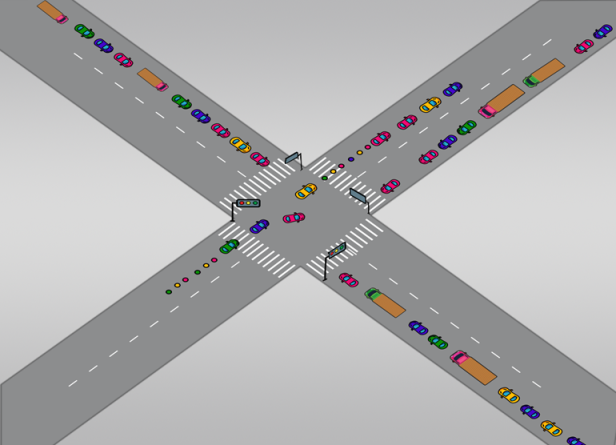 | Figure 4. A Bird’s eye view of the existing traffic junction |
 | Figure 5. A bird’s eye view of the modified traffic junction (The extra space is highlighted in red arrows. This space enables the vehicles to gain more momentum, enabling more vehicles to cross the signal at the signal window time) |
|
|
5. Comparison
- The survey was done in two major city centres of Europe and few urban areas in India. The comparison of the existing model with the proposed model is very promising. Kindly see below the dashboard.
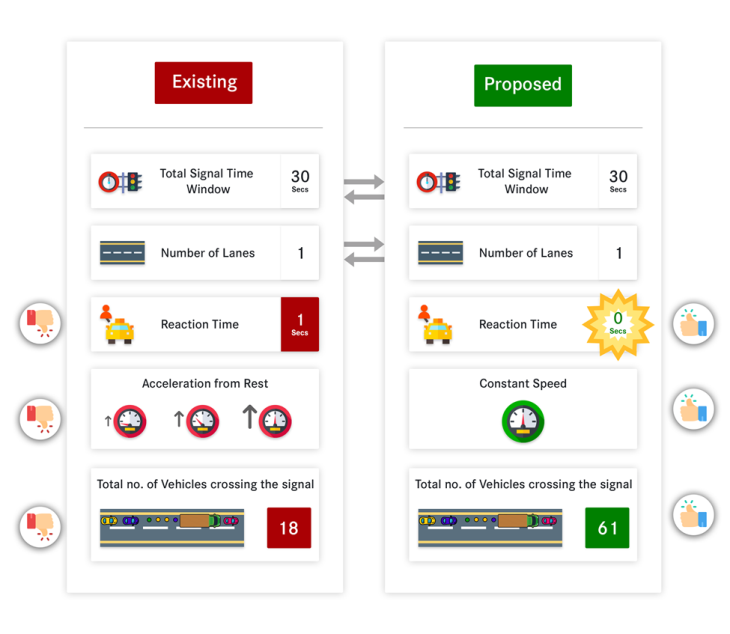 | Figure 5. Comparison of existing vs Proposed Infrastructure Parameters |
6. Applications
6.1. Smart City Planning
- For the city planning authorities to develop infrastructure or revamp existing infrastructure at low cost. The considerable improvement of traffic conditions can be achieved either by the solution mentioned in chapter 4.4 or 4.5.
6.2. Densely Populated Cities
- For the City traffic management authorities to ensure traffic movement in a smooth manner, considering the expansion possibilities and limitations, they can choose either solution in chapter 4.4 or 4.5.
6.3. Developing Countries
- For countries like China and India where the population is high and there is a need for building optimal urban infra-structure at less cost. The proposed solution can be used while building smart cities. This helps in quick urban transit.
6.4. Developed Countries
- Connected Cars infrastructure embedded with the disclosed algorithm will enhance the commute experience. It also aids in lowering pollution levels.
7. Conclusions
- With the above-illustrated study analysis and results, we would like to conclude that there will be a significant improvement in the commute time in the urban areas where traffic congestions are common. Subsequently the positive outcome of this solution results in reduced stress. Inherently the solutions are economically viable.
ACKNOWLEDGEMENTS
- This study was supported by Mercedes Benz Research & Development India Pvt Ltd, the India division of Daimler R&D (MBRDI).The Management from MBRDI has offered exceptional support to carry out deep analysis of the Transportation engineering topic.Sri Raghavendra Vaidya, Senior Vice-President, Mercedes Benz Research & Development India Pvt ltd. Bengaluru.Sri Charudatta Pawar, Vice President, IT/QIM, Mercedes Benz Research & Development India Pvt ltd. Bengaluru.Sri Venkatesh Thiwari, General Manager IT/QIM, Mercedes Benz Research & Development India Pvt ltd. Bengaluru.Sri David Nogossek, Vice President FMC/RI, Mercedes Benz Research & Development India Pvt ltd. Bengaluru.