-
Paper Information
- Paper Submission
-
Journal Information
- About This Journal
- Editorial Board
- Current Issue
- Archive
- Author Guidelines
- Contact Us
International Journal of Traffic and Transportation Engineering
p-ISSN: 2325-0062 e-ISSN: 2325-0070
2019; 8(1): 8-17
doi:10.5923/j.ijtte.20190801.02

Investigating Network Efficiency Improvement Measures Using Simulation Technique in Mirpur Area
 Abstract
 Reference
 Full-Text PDF
 Full-text HTML
Shah Muniruzzaman1, Muntahith Orvin1, Md. Hadiuzzaman2, Samin Wasif1, Selina Nasrin1
1Civil Engineering, Military Institute of Science and Technology (MIST), Dhaka, Bangladesh
2Civil Engineering, Bangladesh University of Engineering and Technology (BUET), Dhaka, Bangladesh
Correspondence to: Muntahith Orvin, Civil Engineering, Military Institute of Science and Technology (MIST), Dhaka, Bangladesh.
| Email: |  |
Copyright © 2019 The Author(s). Published by Scientific & Academic Publishing.
This work is licensed under the Creative Commons Attribution International License (CC BY).
http://creativecommons.org/licenses/by/4.0/

Traffic engineers and planners need information about traffic for planning and designing purpose. Traffic survey are the means of obtaining various data. Survey aims to capture data that accurately reflects the real-world traffic situation in a particular area. It includes determination of volume of traffic, peak hour congestion, traffic composition. It also depicts a complete traffic scenario of a certain area of interest. A traffic study was conducted in the Mirpur cantonment area of Dhaka city to analyze the scenario of the prevailing traffic condition. The traffic is heterogeneous and comprises of vehicles including cars, trucks, buses and non-motorized vehicles (NMV). Inside the Mirpur Cantonment area, flow is relatively lower than any other typical area of Dhaka. This study generates simulation done by microsimulation software-VISSIM using the field data. After calibration, the evaluation parameters are determined. The paper also depicts the future traffic scenario of the studied area simulated by VISSIM. Eventually, the study suggests few measures so that the increased traffic can be efficiently managed and circulated.
Keywords: Traffic study, Traffic simulation, Network efficiency, Improvement measures
Cite this paper: Shah Muniruzzaman, Muntahith Orvin, Md. Hadiuzzaman, Samin Wasif, Selina Nasrin, Investigating Network Efficiency Improvement Measures Using Simulation Technique in Mirpur Area, International Journal of Traffic and Transportation Engineering, Vol. 8 No. 1, 2019, pp. 8-17. doi: 10.5923/j.ijtte.20190801.02.
Article Outline
1. Introduction
- Increasing traffic congestion is an inescapable condition in growing metropolitan areas across the world. Peak-hour traffic congestion is an inherent result of the urbanization. One of the main reasons why there is more congestion is due to more private cars and NMVs on the road. Bangladesh is a densely populated country where traffic congestion is a common phenomenon. Dhaka is a mega city and capital of Bangladesh. More than twelve million people live in Dhaka [1]. In recent years, rapid increase in travel demand and the number of vehicles on roadways have resulted in serious congestion problem here (Figure 1).
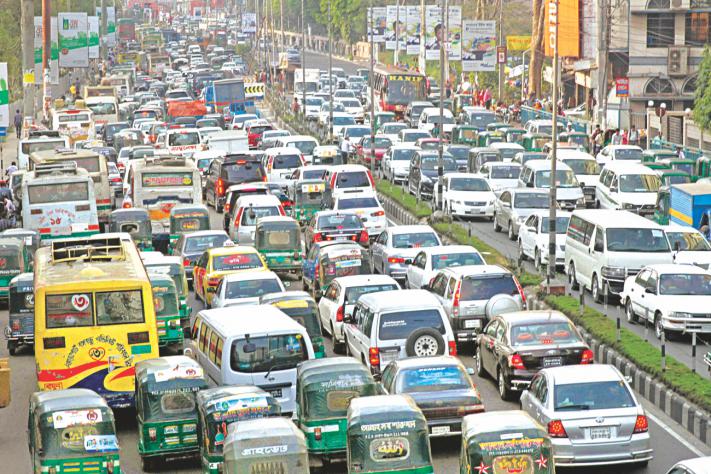 | Figure 1. Traffic Congestion in Dhaka Mega City (Source: www.google.com) |
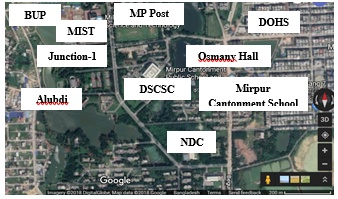 | Figure 2. Mirpur Cantonment area, Dhaka |
1.1. Objectives of the Study and Problem Identification
- The Mirpur Cantonment area faces congestion in the morning peak hour due to the presence of various educational institutions. Among them, MIST and BUP are expanding their curriculum day by day. As a result, the number of students are increasing who rush in the morning to attend the classes. This causes a congestion in the morning that comprises a wide variety of vehicles. Prime target of this research work is to study this traffic scenario. The maximum traffic congestion in the study area occurs in the morning between 0730-0830 hours. This is considered as the ‘Peak Hour’, while the maximum traffic flow generates. Another aim is to model existing traffic condition and calibrate the model with micro simulation technique so that it mimics the real situation. Evaluation parameters need to be determined for this base model. The research also focuses on estimating the rise in future traffic volume with a growth rate of 5%. Thus, the traffic scenario after 5 years is anticipated by micro simulation with VISSIM. The model for future traffic is assessed and measures are provided with the help of evaluation features of VISSIM. This will enable obtaining the best appropriate outputs from the analysis. Therefore, the possible outcome of the study includes a depiction of the existing and future traffic scenario in Mirpur Cantonment and evaluating the measures that will ensure efficient traffic flow through the studied network in future.
2. Literature Review
- Traffic engineers and planners require intensive information to design and manage road traffic system. They use the data for planning and designing traffic facilities, selecting geometric standards, economic analysis, justify warrant of traffic control devices and determination of priorities. They also employ this information to study the effectiveness of introduced schemes, diagnosing given situations and finding appropriate solutions, forecasting the effects of projected strategies, calibrating and validating traffic models. The main purpose of traffic survey are traffic monitoring, control and management, enforcement, forecasting, model calibration etc. Traffic studies include inventory of road traffic physical features, traffic stream characteristics studies, capacity studies, travel time and delay studies, O-D survey, supply & demand studies, accidents studies, environmental impact studies etc. [2]. The traffic engineer must acquire general knowledge of traffic volume characteristics. The total number of vehicles that pass over a given point or section of a lane or roadway during a given time interval is referred as volume or flow. Average Annual Daily Traffic (AADT) is the average 24-hr volume at a given location over a full 365 days year, estimated as the number of vehicles passing a site in a year divided by 365 days.Hourly, daily, and monthly expansion factors can be determined using data obtained at continuous count stations. Hourly Expansion Factors (HEFs) are determined by the ratio of total volume for 24-hour period and volume for particular hour. Daily Expansion Factors (DEFs) are computed as the ratio of average total volume for week and average volume for particular day. Monthly Expansion Factors (MEFs) are computed as AADT divided by ADT for particular month. The AADT for a given year may be obtained from the ADT for a given month by multiplying this volume by the MEF [3]. Different types of traffic counts are carried out, depending on the anticipated use of the data to be collected. Intersection counts are taken to determine vehicle classifications and turning movements at intersections. These data are utilized mainly to determine phase lengths and cycle times for signalized intersections, in the design of channelization at intersections and in the general design of improvements to intersections [4]. In order to obtain certain traffic volume data, such as AADT, it is necessary to obtain data continuously. However, it is not feasible to collect continuous data on all roads because of the cost and time involved. Different types of periodic counts, with count durations ranging from 15 minutes to continuous are conducted. There are two major methods (manual and automatic counting method) for volume survey. There are two methods of manual counting: direct method and indirect method (Figure 3). Data is counted by using hand tally and manual counters in the direct method. Data can be used immediately after collection. Nevertheless, this method is not practicable for long duration count and when flow is high. While in the indirect method, data is collected using video camera. Video is captured for long time and data is collected later by rewinding. Data can be crosschecked and quality can be ensured. This method is applicable when volume is high. It is suitable for non-lane based traffic operation. Although a suitable elevated place is required for filming operation. However, this process is time consuming. Because of limitation of capacity of film, it is not suitable for long duration counts. Quality of video recorded on film is also dependent on intensity of light and this method is not suitable in inclement weather conditions.
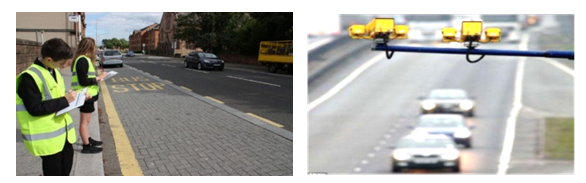 | Figure 3. Manual method of vehicle count |
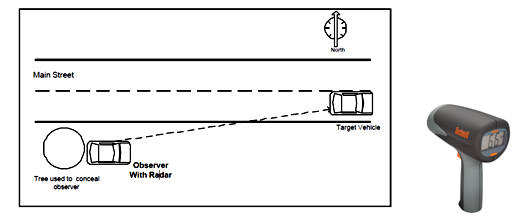 | Figure 4. Radar speed gun for spot speed measurement |
3. Methodology
3.1. Data Collection Procedure
- A team of MIST students collected data from the field. The studied area is modelled with micro simulation software ‘VISSIM’ version 5.40. Extensive data were required since micro simulation encounters with individual track of vehicles. It uses distance and time headway, lane changing and car following behaviour to generate model. Basic data that are required such as geometry of the links and intersections, number of lanes, lane width, median width, traffic volume, directional count, traffic composition, queue length, travel time, speed of vehicles, delay time etc. The traditionally simplest approach for counting vehicle is to record each observed vehicle with a tick mark in a tally sheet which is used in this study. Indirect method of manual counting, video camera was also utilized for verifying the collected data. For speed study, radar speed gun was used. Sample size was taken as at least ten vehicles of a particular vehicle class.
3.2. VISSIM Model Generation
- Using the various data collected from the field, the model is generated in VISSIM. The network generation process includes importing and scaling overlay image after fixing units, determining driver behavior parameters, fixing individual link behavior, link and connector generation, determination of vehicle types and classes, vehicle composition selection, vehicle input in all the arrival points of the network, routing for various links, conflict areas and priority implementation. No traffic signal program is installed in the field. Data collection points, travel time sections and queue counters are established where necessary for evaluation purpose. After the network design, simulation is initiated with random seed value. If the random seed varies, the stochastic functions in VISSIM are assigned a different value sequence and the traffic flow changes. This allows stochastic variations of vehicle arrivals in the network. To attain meaningful results, arithmetic mean for at least five runs with different random seed settings were selected for evaluation.
3.3. Model Calibration and Validation
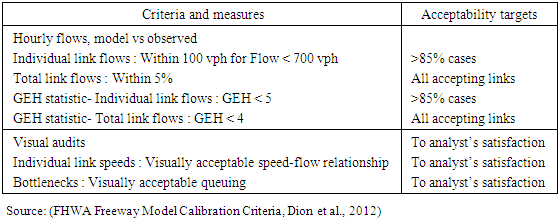
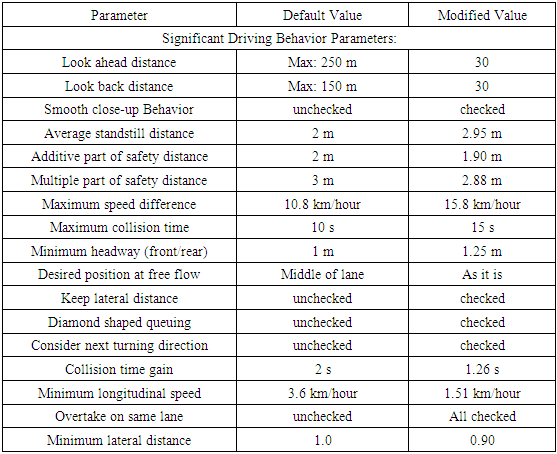
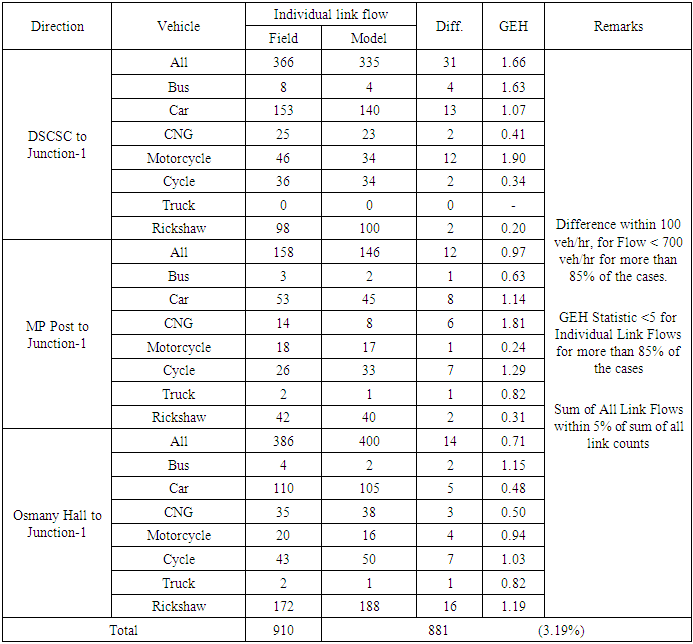
- Calibration of the generated model was executed to check whether it replicate the existing situation or not. Calibration is defined as the process of adjusting the parameters used in the model to ensure that it accurately reflects input data [20]. Traffic at the studied portion is heterogeneous. Since it is in cantonment area, vehicles partially maintain lane discipline. During the calibration process, sensitivity analysis was initiated to identify the key driving behavior parameters. Thus, the driving behaviour parameters were modified so that the model replicates the field condition. Two sets of observed data were required during the model development process. One was used to calibrate the model by adjusting the parameters and latter was used to verify that the aspects of the performance of the calibrated model are in agreement to the set of observed data [29]. It is very significant that the output found for particular traffic parameters combinations are within the calibration target range (Table 1).
|
3.4. Model Evaluation
- After the calibration and validation of a model, evaluation criteria were determined. Due to construction work of BUP and new faculty towers of MIST, there will be vast increase in traffic in future. Therefore, the model evaluation is also done for future expansion of traffic. The probable traffic volume of the next five years is estimated with a growth rate of 5%. The effect of this increased traffic is discussed and measures are tested based on the evaluation result in VISSIM.
4. Data Collection
4.1. Study Area
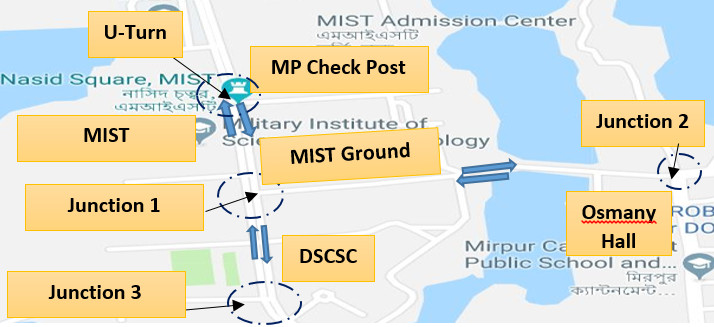
- Certain portion of Mirpur cantonment was the concerned study area. With a view to conducting the volume study of the studied area, the data collection points were selected first. There are one four legged and two three leg junctions as illustrated in Figure 5. The study required vehicle input data for Osmany hall to Junction 1, MP Check Post to Junction 1 and DSCSC to Junction 1 link road respectively. Due to a military controlled area, there are several links where public access is restricted. The blue marks on the Figure 5 indicate the roads accessible by mass people. There is a right turn restriction at Junction 1 for the approaching vehicles from DSCSC. These vehicles makes a U-turn at MP Check Post.
 | Figure 5. Study area |
4.2. Traffic Study
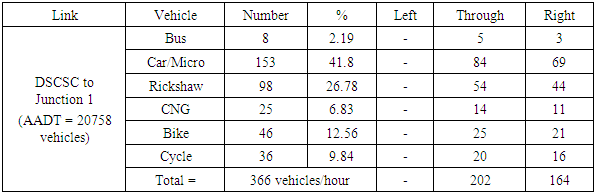
- All the data were collected for one hour in each input. For the data collection, peak hour (0730-0830 hour) was selected. The traffic demand is maximum during this period. Typical volume and composition data for DSCSC to Junction 1 road is illustrated in Table 2. It is observed that number of bus for carrying students is very less. Therefore, there are significant amount of NMV plying in the study area. In addition, it was found that 35% of the students travel by bus, 21% by private car and 44% use NMV. It was also revealed that 71% are not pleased with the number of buses operating in this area. Design speed is 45 km/hour, which is corresponding to 98th percentile speed.
|
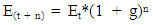 | (1) |
5. Model Generation in VISSIM
- The traffic flow model in VISSIM is a discrete, stochastic, time step based where driver-vehicle-units as single entities. Car following and lane changing behavior is incorporated in VISSIM. Generally, vehicles follow partial lane discipline, as there is military enforcement. The existing situation is generated as per the field data. The model shown in Figure 6(a) mimics the field condition and it is the ‘Base Model’. Link roads from DSCSC to BUP and MP Post to DSCSC have two lanes in one direction. There is prohibition of right turn from DSCSC to Junction-1 (Figure 6b). At MIST premise there is a pedestrian crossing that creates slow movement of traffic (Figure 6c). In addition, after the crossing there is an on-street parking for few moments to drop off students at MIST premise (Figure 6d). Then these vehicles make a U-turn at MP Post. The vehicle composition consists of car, bus, CNG, rickshaw, truck, motorcycle and cycle in all roads. Vehicle routing was done as per the field data. No traffic signal implementation is present in the field condition.
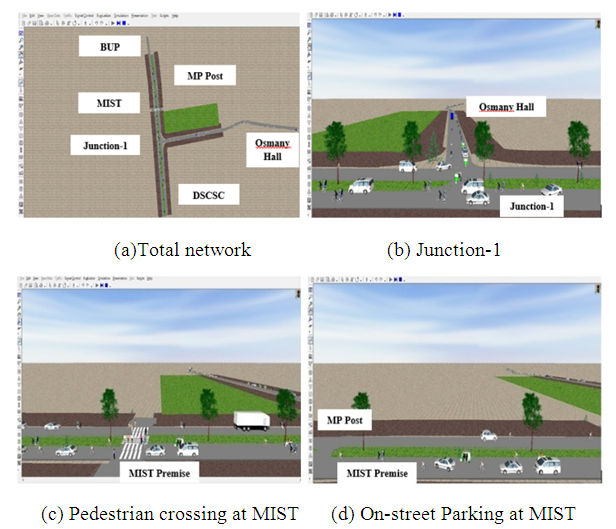 | Figure 6. VISSIM 3-D model |
|
|
 | Figure 7. Modified Model-II |
6. Result and Discussion
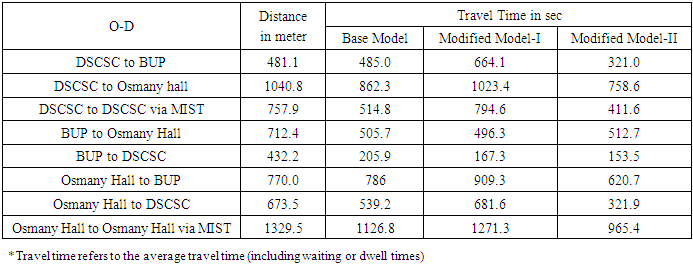
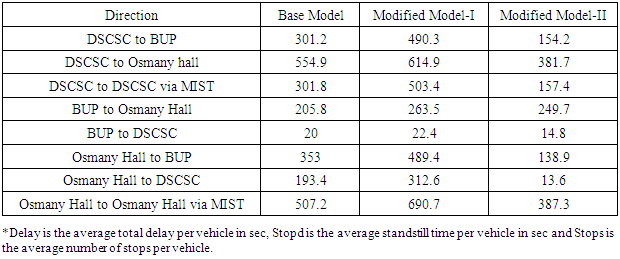
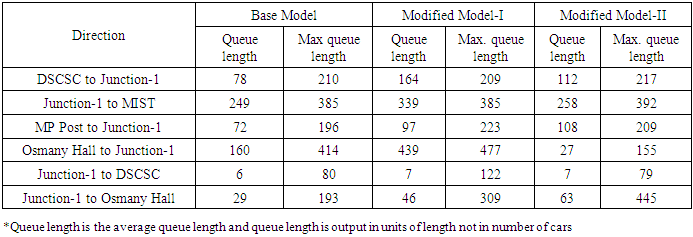
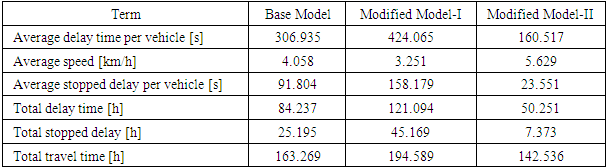
- After studying, it is observed that at field condition there is considerable amount of delay in Junction-1. There also exists slow movement of traffic due to right turn at Junction-1 from Osmany Hall, lack of overtaking lane for speedy vehicles generated from Osmany hall, pedestrian crossing and on street parking for drop off students at MIST premise. To achieve better performance in the study area, various road-traffic parameters, characteristics and measures need to be experimented. In this study existing condition (Base Model) is compared with future traffic generation for 5% growth rate (Modified Model-I) and Modifying Model I with lane increment from DSCSC to MIST and right turn ban from Osmany Hall to Junction-1 (Modified Model-II). Wiseman (2018) thinks expansion of roadway is an efficient solution for traffic delay mitigation. However, due to obstacles, land restraints or other practical reasons there is little scope for lane increment in most practical cases [32]. As the studied site is in cantonment area and military controlled, there is significant amount of unused lands around the existing site. Therefore, we considered lane increment as an important factor for delay minimization for the future traffic. Eventually, the Modified Model II is evaluated in terms of efficiency.It is obvious that traffic volume will increase in future days, as the study area is an education hub for Bangladesh Military Forces and the dimension of the military units are expanding day by day. From Osmany Hall to Osmany Hall via MIST, DSCSC to Osmany hall and DSCSC to DSCSC via MIST, it is observed that the average travel time of the vehicles are moderately high for field condition. It is to be mentioned that VISSIM evaluation results of travel time is the average travel time (including waiting or dwell times) determined as the time required by vehicles between crossing the first and crossing the second cross sections [7]. It is noticed that due to traffic growth in future, the travel time for all links considered except links from BUP, significantly increased in comparison to existing condition (Table 5). If the model with future traffic is modified as discussed, the travel time decreases largely. For instance, for Osmany Hall to Osmany Hall via MIST route, the travel time is decreased to 14.32% compared to base model and 24.06% compared to Modified Model-I.
|
|
|
|
7. Summary and Conclusions
- This research focuses on the study of the major part of the Mirpur cantonment Area. The existing situation is generated and simulated with the help of detailed data input. To investigate the prevailing condition, simulation tool VISSIM 5.30 is applied. All the vehicle types are modeled to induce heterogeneity. The real field condition is simulated by modifying the default driving behavior characteristics of VISSIM. The model is calibrated and evaluation parameters are ascertained. At present, the network is not overloaded though there are few delay points such as Junction-1, pedestrian crossing and on-street parking. Then another model is generated for future traffic propagation for five years with 5% growth rate without changing other parameters. This model is also calibrated and evaluated. The results suggest overall deterioration of existing condition. So, the future traffic model is modified and few treatments are provided such as right turn prohibition and lane increment. This model improves the evaluation parameters a lot and proves that measures will be effective. To achieve better efficiency at Junction-1 and DSCSC, signal system can be experimented which is beyond this study. Signal system may effectively manage conflict points and add more efficiency to the network. Pedestrian crossing signal and on-street parking bay for dropping off students can also be implemented and tested. The existing congestion situation can also be compared using digital image processing modern technique used by Wiseman (2017) [28]. Moreover, more percentage of bus and reduced number of NMV will improve the condition significantly. Overall, it is obvious that improvement measures will be necessary in future. Lane increment and right turn prohibition rather U-turn incorporation will prove to be effective for the studied area for future traffic.
ACKNOWLEDGEMENTS
- Thanks to Almighty Allah for His graciousness. The author expresses gratitude to Dr. Shah Md. Muniruzzaman, Dr. Md. Hadiuzzaman, Mr. Samin Wasif and Mrs. Selina Nasrin for their continuous assistance. Thanks to Head of the Civil Engineering department and Commandant, MIST for the encouragement. A very special gratitude is offered to the author’s parents, wife and his younger sister for their enormous support.