Mohana R. Killada1, GVR Raju2
1Associate Director, Transit Department, AECOM, New Delhi, India
2Sr. Vice President, Transit Department, AECOM, New Delhi, India
Correspondence to: GVR Raju, Sr. Vice President, Transit Department, AECOM, New Delhi, India.
| Email: |  |
Copyright © 2018 The Author(s). Published by Scientific & Academic Publishing.
This work is licensed under the Creative Commons Attribution International License (CC BY).
http://creativecommons.org/licenses/by/4.0/

Abstract
The world has witnessed rapid urbanization and a five-fold urban population growth since the 1950’s. World metro systems followed a similar trend to accommodate the increasing population. However, different countries have varying policies on investment in metros. This paper investigated the state of metro systems in the top 10 economies in the world to find out which country among them is investing profoundly in metros. This research further analyzed the 2016-17 financial statements and ridership data of different metro corporations to find out the best and least performing metro corporations from financial and ridership point of view. Parameters considered for analyses are Operating Cash Flow (OCF), OCF Margin, Daily Ridership, Usage, and Metro Length per Resident. The results indicate that China leads all other countries in terms of developing metro systems at 4,201 Km. Ridership analyses results indicate that London ranks 1st in terms of overall ridership ranking considering Daily Ridership, Usage and Metro Length/ Resident. Financial analyses results indicate that Hong Kong’s MTR (Mass Transit Railway) ranks 1st with the highest OCF and OCF margin, while New York’s MTA (Metropolitan Transportation Authority) is the least performing corporation among the selected metros from top 10 economies.
Keywords:
Metros, Capital Expenditure, Capex/Sales, Development, Economies, Finance, Operation, Ridership, Operating Cash Flow (OCF), OCF Margin, Usage, Metro Length per Resident
Cite this paper: Mohana R. Killada, GVR Raju, World’s Top Economies and their Metro Systems’ Ridership and Financial Performance, International Journal of Traffic and Transportation Engineering, Vol. 7 No. 4, 2018, pp. 91-97. doi: 10.5923/j.ijtte.20180704.03.
1. Introduction
Metros have become an integral part of modern day cities. Metros can be defined as urban mass transit systems with exclusive right of way. Right of way is the legal right of such systems to proceed on specific routes without interference from other vehicles or pedestrians. First underground railway was opened in London in 1863, which used steam engines at that time. In 1890, electric trains were first used, again in London. The benefits of such systems extend from reduction of commute time and cost for the citizens to a phenomenal diminution in the overall carbon footprint of the city. The world’s urban population has grown more than five times from 746 million in 1950 to 3.9 billion in 2014 [1]. The rise in congestion in the cities over the last few decades has resulted in a stark rise in the number of metro systems across the world as shown in Figure 1.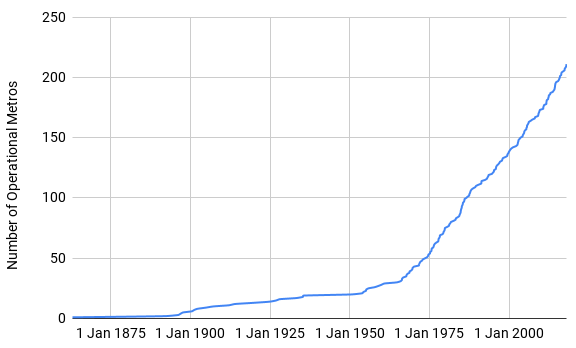 | Figure 1. Growth of Metros |
As of 2017, there are 212 operational metro systems across the world, spread across 59 countries with a combined network length of 14,744 km [2]. There are 87 operational metro systems in Asia, 77 in Europe, 45 in the Americas, 2 in Africa, and 1 in Australia as indicated graphically in Figure 2. Metro systems include metro, light, mono and city rail.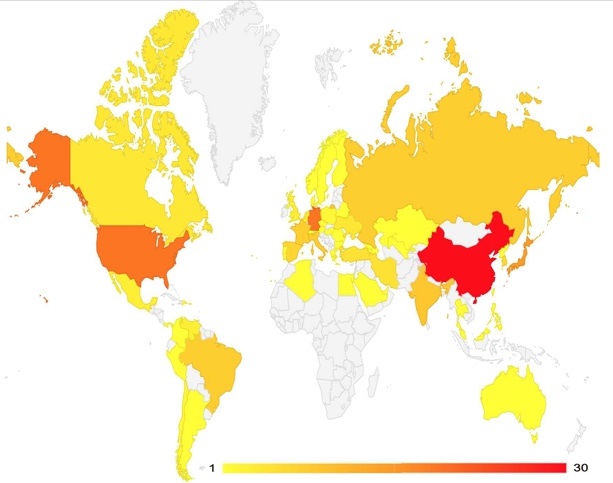 | Figure 2. Countries and their Metros |
The metro systems cater to more than 160 million passengers daily across six continents; almost 50% of the passengers are carried by Asia-Pacific metro systems daily. The Americas combined have 27 million daily passengers; Europe and Africa combined have 53 million [3]. Metro network of the world’s top 10 economies arranged in descending order is represented in Figure 3. It can be seen undoubtedly that China leads all other countries in terms of development of metro infrastructure. It has over 4,201 km of operational metro systems, which is almost three times that of United States. USA has the second largest metro network with 1408 km [2].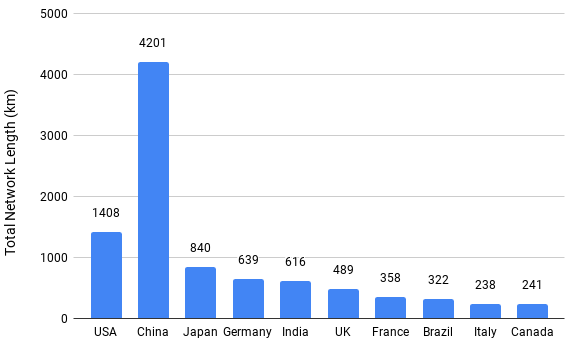 | Figure 3. World’s Top 10 Economies and their Metro Network |
In terms of longest metro system in the world, Shanghai, China leads with a length of 632 km [2]. There are three Chinese metro systems amongst the top 10 longest metros in the world as shown in Figure 4. 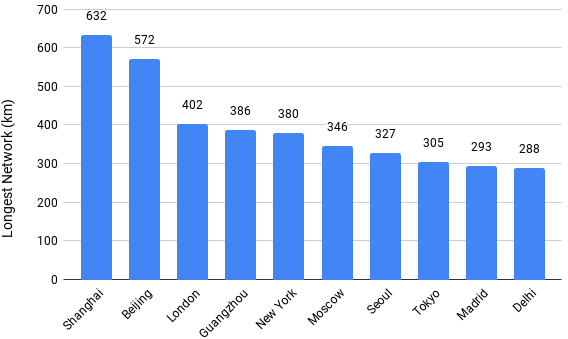 | Figure 4. World’s Longest Metro Systems |
Keeping in view that almost 60% of the total metro network of the top 10 economies is located in three Asian countries namely, China, Japan and India, it is important to discuss briefly about their metro status in this paper. There are 30 Chinese cities with operational metro systems. Shanghai metro first opened in 1993, and since then it has expanded to be the world’s longest metro system. The Chinese government plans to invest about $148 billion in development of metro systems by 2020 [4]. Around 39 more Chinese cities are constructing metros; another 60 are in the planning phase. A total of 5636 km of metro lines are under construction [5]. Development of metros would alleviate congestion in major cities, whilst also promoting economic activity in smaller cities. Businesses in smaller cities would have an increased access to labor. As development of metros is the prerogative of the local governments, urban planning is integrated with the development of the metro systems. High investment in infrastructure by the Chinese government is expected to boost economic growth in times of economic slowdown.Japan had started its first metro operations in Tokyo in 1927 and it had developed 15 metro and light rail transit systems totalling 840 km. The last rail transit system was opened in 2003 and post which no further new development has taken place. Tokyo metro handles the highest daily ridership among the world metros at 8.5 million passengers as per 2011 data [2]. It is one of the densest metros in the world. The Tokyo Metropolitan Government has proposed building two new subway lines from central Tokyo, one line to Shinagawa and the other to the waterfront districts of Harumi, Toyosu and Ariake. However, the exact location of the lines is not finalized, and they won’t be built until after the 2020 Olympics [6].India, much like China, is witnessing a rapid growth in urban population. Almost 60% of Indians are estimated to be living in urban areas by 2050 [7]. India saw its first metro system open in Kolkata in 1984. Delhi metro was the next to open in 2002 and has now become the longest metro system in the country and the 10th longest in the world. Nine (9) Indian cities have operational metro systems. In 2015, the Urban Development Ministry proposed metro systems for 50 cities in India [8]. There are 5 metro systems under construction, and 17 more planned. Considering the high capital investment needed for metro systems, Indian government announced a policy making private partnership mandatory for central assistance in metro rail projects.The recent metro development post 2010 in Americas happened in Brazil, Peru and Panama with a combined length of about 92 km. Similarly, in Europe a total of 25 km of metro has been developed in Spain and Italy put together. In Africa, only Algeria developed a new metro line of about 13 km in recent times. No new metro lines were developed in Australia recently [2].Financial performance of selected metros from the top 10 economies is analysed in terms of financial metrics such as Operating Cash Flow (OCF), OCF Margin, Capex and Sales Revenue. In addition, factors such as ridership along with the Usage and Metro Length/ Resident are also analysed and compared to find out the trend and relationship between OCF Margin and Usage, which could give an insight into further metro development in a city.
2. Background
2.1. Operating Cash Flow
Operating Cash Flow or Cash Flow from Operations (OCF) is the amount of cash that a company generates from day-to-day business activities. It can be represented in a formula as indicated below in Equation, 1. | (1) |
Where:OCF = Operating Cash FlowNI = Net IncomeD&A = Depreciation & AmortizationOTA = One Time AdjustmentCWC = Change in Working CapitalIt does not include the cash inflows and outflows from investing and financing activities. Maintaining a positive cash flow from operations is a healthy sign indicating that the corporation is generating enough money to continue its operations, and also has the ability to re-invest for expansion.
2.2. Operating Cash Flow Margin
Operating Cash Flow Margin is the percentage of Sales converted to Operating Cash Flow (OCF/Sales). It is a measure of how effectively a corporation can convert sales to OCF. A higher OCF margin indicates a more efficient corporation, as a smaller portion of their sales is incurred as expenditure. For example, a firm with 10% margin converts every dollar of sales revenue into 10 cents of OCF. Remaining 90 cents are expenses.
2.3. Capital Expenditure
Capital expenditure (Capex) is the money spent on acquisition & maintenance of fixed assets. As majority of assets owned by a metro corporation are fixed assets, high capital expenditure is inevitable. Free Operating Cash flow (FOCF) is Operating Cash Flow less Capex. For example, a firm has a Capex of 40 cents and OCF of 100 cents then FOCF is 60 cents. Capex/Sales ratio is the ratio between Capital Expenditure and the Sales Revenue. It indicates the level of investment made by a corporation. The ratio could be greater than 100% indicating that the Capex of a corporation is greater than the Sales Revenue.
2.4. Usage and Metro Length per Resident
Usage of a metro system is the percentage of total city population that ride the metro daily which indicates the extent of metro usage in a city. Assuming two passenger trips per day, Usage can be expressed in terms of an equation (2).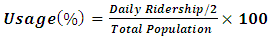 | (2) |
Metro Length per Resident is the ratio of total metro length of a city to its population expressed in millimetres. This factor gives an insight of how widely the metro infrastructure is developed and further scope for future development.
3. Ridership and Financial Analysis
3.1. Data Source
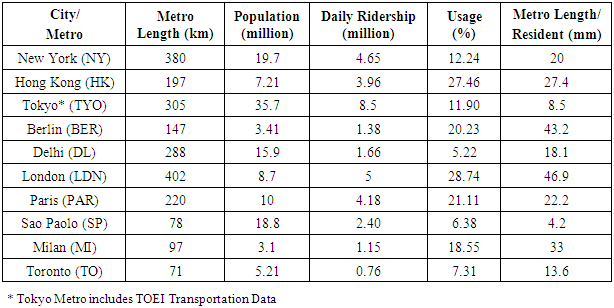
Ridership data of the 10 metros is obtained from World Metro Database [2] and is presented in Table 1. It includes the Metro Length, Population, Daily Ridership, Usage and Metro Length/ Resident data of the metros. Financial statements of the 10 metro corporations for the year 2016-17 were collected and analysed to evaluate the financial performance of the metros from the top 10 economies [9-22]. For ease of representation, name of the city is assumed as name of the metro corporation and is arranged in descending order of their respective country’s economy.Table 1. Metros and their Ridership Data
 |
| |
|
Tokyo leads the chart in terms of Daily Ridership at 8.5 million passengers followed by London and New York; however, it stands at 7th and 9th position in terms of Usage and Metro Length/ Resident respectively. London stands at the top in terms of Usage of the metro system and Metro Length/ Resident categories indicating the extent of the metro system’s infrastructure development and Usage of the same by the general public. Daily Ridership data and Metro Length/ Resident of all 10 metros is represented in the above Figure 5. Tokyo Metro is jointly maintained by both Tokyo Metro Corporation and TOEI Transportation; hence data is combined for analysis.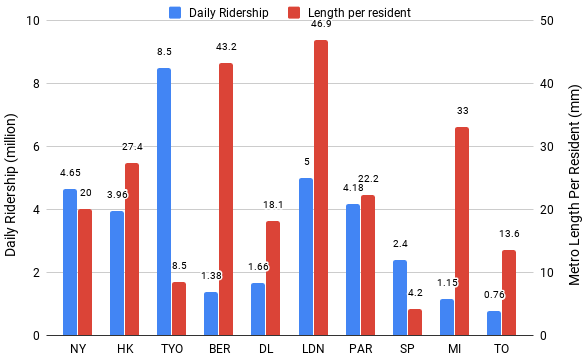 | Figure 5. Daily Ridership & Metro Length per Resident |
3.2. Operating Cash Flow of Metros
As indicated earlier, financial statements of all metro corporations were analyzed and the Operating Cash Flow data was obtained and plotted in a chart as indicated in Figure 6. Except New York’s subway system, all other metros have a positive cash flow. NY has a negative cash flow of $ 3.8 billion. Hong Kong’s MTR has the highest operating cash flow of about $ 2.5 billion.  | Figure 6. Operating Cash Flow (in $ millions) |
3.3. OCF Margin of Metros
Analysis in terms of OCF Margin, which is a measure of effective and efficient operations of metros, revealed that Delhi leads the chart at 36.4% followed by HK and London at 35.4% and 28.4% respectively as indicated in Figure 7.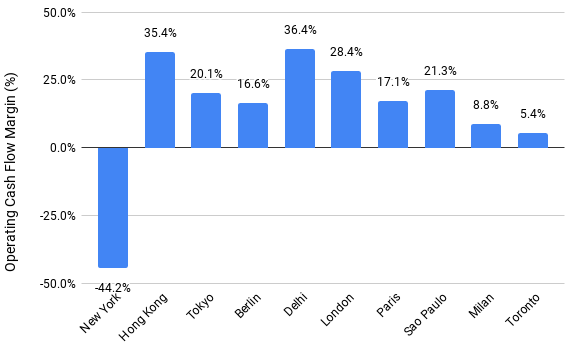 | Figure 7. Operating Cash Flow Margins |
Obviously, New York’s negative OCFs translate to negative margins. Efficient operations decrease the expenditures and increase the margins.
3.4. Usage and OCF Margin Trend Analysis
To better understand the reasons behind a better performing metro with positive and high margins, a trend analysis was performed for Usage and OCF Margin parameters.Data for both Usage and OCF Margin are plotted as shown in Figure 8. As stated earlier, Usage is calculated using daily ridership and population parameters as per equation (2). A higher Usage indicates that large percentage of population is traveling by metro resulting in higher sales revenue for the metro and possibly higher margins.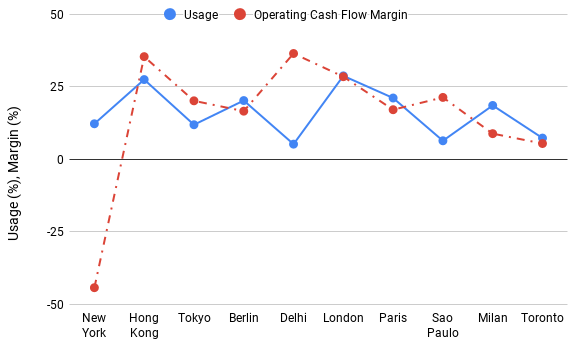 | Figure 8. Metro Usage and Margins |
London, Hong Kong and Paris have high Usages indicating their reliance on metros. Delhi in contrast has the lowest Usage. This is due to its relatively high population when compared to daily ridership.General trend between the two lines shows that as Usage increases, margins tend to increase and vice versa except for three metros namely Delhi, Sao Paulo and Milan, where the Usage and OCF Margin trend lines move in opposite directions. For Delhi and Sao Paulo, Usage seems to be low due to their high populations, indicating that further expansion of the metro is needed. However, for Milan even though the Usage is higher, the OCF Margin is on the lower side, indicating high expenditure.
3.5. Capital Expenditure of Metros
As explained earlier, Capital expenditure is the money spent by a corporation on acquisition and maintenance of its fixed assets. Free Operating Cash Flow is Operating Cash Flow less Capex. Only Tokyo, Hong Kong and Milan have positive Free Operating Cash Flow. This could be due to capital expenditure being funded either through government grants or debt.Capex/Sales ratio indicates that Delhi, Sao Paulo and Toronto metros have high Capex/Sales percentage which is above 100% as shown in Figure 9. These metros are expanding their network to meet the demand due to growing population of their cities. Annual population of these cities grew at 3.3%, 1.21% and 1.21% respectively [24]. 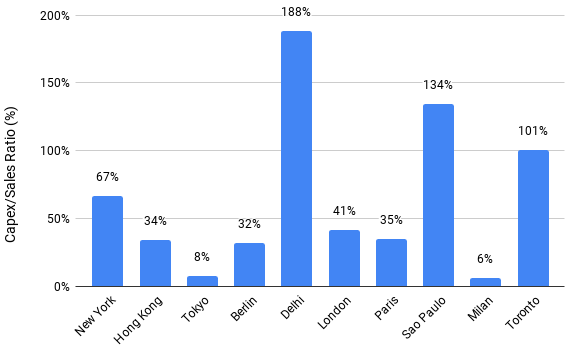 | Figure 9. Capex/Sales Ratio |
New York, Hong Kong and Paris have high capital expenditures of greater than $ 2 billion. However, in terms of Capex/Sales, Hong Kong and Paris have a lower ratio which is due to high sales revenue. New York’s capital expenditure is mostly due to the high maintenance of the aging infrastructure.
4. Results and Discussion
4.1. Comparison of Metros Based on Ridership Data
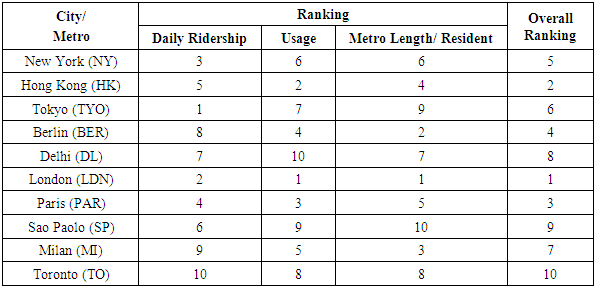
Metros were ranked based on the results obtained from ridership data analyses. All metros ranked differently with different parameters such as Daily Ridership, Usage and Metro Length/ Resident. However, overall ranking was calculated by taking an average of the three different ranks as indicated in Table 2. It is to be noted that ridership data year varies from 2008 to 2012 and the population data is as of year 2010.Table 2. Metros and their Overall Ranking based on Ridership
 |
| |
|
London ranked 1st in overall ranking while Hong Kong and Paris ranked 2nd and 3rd respectively. Tokyo and Milan have same average scores; however, Japan has a higher individual rank in daily ridership, hence it was assigned a higher rank in the overall ranking.
4.2. Comparison of Metros based on Financial Performance
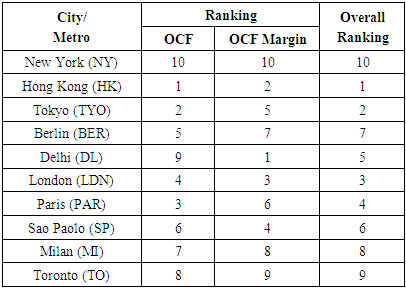
It is prudent to compare both the size of the OCF and the OCF margin to get a better picture of the financial performance of a metro. Hence both parameters were estimated for all the metros and ranked. Overall ranking was calculated by taking an average of the ranks obtained for the above two parameters. Based on the results of the financial analyses, Hong Kong seems to be leading the chart in the overall ranking followed by Tokyo and London in 2nd and 3rd positions respectively. Even though Tokyo and London have the same average ranking, Japan has a better OCF hence was assigned a higher rank. New York stands last in the table at 10th position. Results of the analyses are included in Table 3.Table 3. Metros and their Overall Ranking based on Financials
 |
| |
|
Hong Kong’s MTR has the highest Operating Cash Flow of $2.5 billion with a margin of 35%. Over the years, MTR has expanded operations abroad and has its presence in China, Sweden, UK and Australia. Along with high Usage of 25%, diversification of business is another reason for high margins. Along with the railway business, MTR has other revenue sources. In Hong Kong, MTR earned $538 million from station retail revenue, $238 million from advertising and other commercial revenue [9]. MTR also operates in the property development and management sphere in Hong Kong and Mainland of China. Strategy to develop property sites along the railway network has proven to be highly profitable. In Hong Kong alone, MTR manages 96,000 residential units and has 13 shopping malls in its portfolio [9]. Revenue of $637 million was generated from property management and rental business in Hong Kong, 94% of which was rental revenue alone [9].New York’s MTA earned $8 billion from passenger fare [16]. However, high payroll costs amounting to $9.3 billion resulted in an overall negative cash flow from operations [16]. MTA currently employs two conductors on every train. Investing in driverless metros would save approximately 700 million dollars every year [23]. Aging infrastructure results in poor performance, and a high capital expenditure. MTA’s construction costs are two to seven times more than that of other metros in the world [23].
5. Conclusions
The objectives of this research are to investigate and compare the state of metro systems in the top 10 economies of the world from the data obtained from World metro database and to analyse their ridership and financial performance from the 2016-17 financial statements. Analyses of key indicators such as OCF, OCF Margin, Daily Ridership, Usage and Metro Length/ Resident were carried out. Research also tried to find out a relationship between the Usage and OCF Margin, which would help as an indicator for future growth of the metros.The state of world metro systems indicate that Asian countries have invested heavily and are continuously investing in the development of the metros in recent times. China leads all other countries in terms of operational metro system length of 4,201 Km.The results of the ridership analyses indicate that London leads all other metros in terms of overall ranking considering Daily Ridership, Usage and Metro Length/ Resident. It has to be noted that even though Tokyo has the highest daily ridership, it lacks the edge in terms of Usage and Metro Length/ Resident. London has the highest Usage and Metro Length/ Resident at 29% and 47 mm respectively. It is clear that a low Metro length/ Resident of a city combined with low Usage and high population indicates that metro network of the city needs to be developed extensively to cater to the larger population.The results of the financial analyses indicate that most metro corporations are able to generate Operating Cash Flow. Hong Kong leads all other metros in overall ranking considering OCF and OCF Margin. Tokyo and London stand at 2nd and 3rd ranks respectively. Due to its negative OCF and OCF Margin, NY metro ended up last in the top 10 economies list. As indicated above, implementation of driverless technology and reduction of construction costs and upgradation of infrastructure would improve the situation of NY metro. Results of the Usage versus OCF Margin analysis indicated that in general, Usage is directly proportional to OCF Margin. However, in situations where Usage is low and OCF Margin is high due to high population, it indicates that metro network needs to be developed.High Capex/ Sales ratio results of Delhi, Sao Paulo and Toronto indicate that these metros are expanding to meet the demand.In terms of social benefits, better connectivity between commercial centers and residential areas by metros increases economic productivity. In addition, metros will reduce carbon footprint, reduce road accidents and travel time.Metros act as backbones of major metropolitan cities across the world. Capital investments, however, require assistance by the government. Planned investment in metros should be seen as a tool for urbanization and boosting economic productivity. Governments across the world should look to further develop metro systems, at least for bigger cities. Even though autonomous vehicles (AV) may give rail business a stiff competition [25] in the future, the high cost of owning them by an average individual is very high. Recent fatal accidents by AVs in Tempe, AZ and Mountain View, CA has let down the public and government regulators confidence. Until the regulators approve this technology for safe operations on public roads, which could mean billions of test miles away, metros seem to be the cheap and best alternative.Further research will be conducted based on a different criterion such as top 10 metro networks instead of economies and see how various metros rank based on financial and ridership factors.
ACKNOWLEDGEMENTS
I thank Mr. Vasu Rai for his help in searching some of the financial statements of metro corporations.
References
| [1] | Un.org. (2014). World’s population increasingly urban with more than half living in urban areas | UN DESA | United Nations Department of Economic and Social Affairs. [online] Available at: http://www.un.org/en/development/desa/news/population/world-urbanization-prospects-2014.html. |
| [2] | Serradell, J., Kennes, J., and Rohde, M. (2013). World Metro Database - metrobits.org. [online] Mic-ro.com. Available at: http://mic-ro.com/metro/table.html. |
| [3] | Uitp.Org, (2014). Available at: https://0x9.me/BDCPX. |
| [4] | Goh, Brenda. "China to Invest More Than $148 Billion in Metros By 2020: State Media". U.S., (2016), https://0x9.me/Qnkmt. |
| [5] | Suilengea.com, available at https://www.suilengea.com/show/bvmhzcfjzc.html. |
| [6] | https://0x9.me/ANstd. |
| [7] | India.Uitp.Org. India is investing in metro infrastructure | UITP India | available at: http://www.india.uitp.org/articles/india-investing-metro-infrastructure. |
| [8] | Railnews.In. "50 Cities to Get Metro Rails for Rs.500000 Crore – Railnews Media India Ltd", http://www.railnews.in/50-cities-to-get-metro-rails-for-rs-500000-crore/. |
| [9] | Mtr.com, http://www.mtr.com.hk/archive/corporate/en/investor/annual2017/EMTRAR2017F.pdf. |
| [10] | Ratp.Fr, 2018, https://www.ratp.fr/sites/default/files/2017-06/RATP_1703145_RA_FINANCIER_GB_MEL.pdf. |
| [11] | Tfl.gov.uk, https://tfl.gov.uk/corporate/publications-and-reports/annual-report. |
| [12] | Atm.it, https://0x9.me/aorZY. |
| [13] | Vognselskapet.no, http://vognselskapet.no/assets/annual-report.2015/Annual-Report-2015.pdf. |
| [14] | Smrt.com.sg, https://0x9.me/KnlPc. |
| [15] | Ttc.ca, https://0x9.me/hqGmB. |
| [16] | Web.mta.info, http://web.mta.info/mta/investor/pdf/2018/2017_CAFR_Final.pdf. |
| [17] | Metro.cl, https://www.metro.cl/documentos/memoria-anual-2017.pdf. |
| [18] | Delhimetrorail.com, http://www.delhimetrorail.com/OtherDocuments/DMRC-AR-2017-WEB_23118.pdf. |
| [19] | Metroag.de, https://0x9.me/tvqcP. |
| [20] | https://geschaeftsbericht.bvg.de/img/BVG_Lagebericht_2017.pdf. |
| [21] | https://www.tokyometro.jp/corporate/profile/pdf/corporateprofile.pdf. |
| [22] | https://www.kotsu.metro.tokyo.jp/eng/services/pdf/outline_of_toei_transportation_2016.pdf. |
| [23] | Knocke, Johnny. "The MTA Loses Six Billion Dollars A Year and Nobody Cares". Medium, 2016, https://0x9.me/9j4HS. |
| [24] | World City Populations, 2018. http://worldpopulationreview.com/world-cities/. |
| [25] | Wiseman, Y., “In an Era of Autonomous Vehicles, Rails are Obsolete,” International Journal of Control and Automation, Vol. 11, No. 2 (2018), pp. 151-160. |

 Abstract
 Reference
 Full-Text PDF
 Full-text HTML