-
Paper Information
- Paper Submission
-
Journal Information
- About This Journal
- Editorial Board
- Current Issue
- Archive
- Author Guidelines
- Contact Us
International Journal of Traffic and Transportation Engineering
p-ISSN: 2325-0062 e-ISSN: 2325-0070
2018; 7(4): 78-90
doi:10.5923/j.ijtte.20180704.02

When Expectation Meets Satisfaction: Examining Users and Non-users Perceived Expectations towards Public Bus Services
 Abstract
 Reference
 Full-Text PDF
 Full-text HTML
Alexander Narh Tetteh 1, Emmanuel Tetteh Teye 1, Oliver Tekyi-Arhin 2, Beatrice Ayerakwa Abosi 1, Deborah Rachel Annor 3, Ren Chong 1
1School of Public Affairs, University of Science and Technology of China
2Department of Psychology, School of Graduate Studies, University of Cape Coast, Ghana
3School of Management, Nanjing University of Posts and Telecommunications, China
Correspondence to: Alexander Narh Tetteh , School of Public Affairs, University of Science and Technology of China.
| Email: |  |
Copyright © 2018 The Author(s). Published by Scientific & Academic Publishing.
This work is licensed under the Creative Commons Attribution International License (CC BY).
http://creativecommons.org/licenses/by/4.0/

Studies on public mass transportation has gained attention over the years. Even though as part of the success of achieving low-carbon goal and reduction in traffic congestion has been attributed to promoting public buses usage, transport planners are yet to achieve this goal by meeting the expectations of users and non-users of public bus services to boost patronage. This study examines some elements of public buses attractiveness. The current study is one of the first to empirically examine and test commuters’ expectations towards public bus services in China. The research findings show that among the expectations of users and non-users of public bus services are provision of storage space in public buses, availability of bus card recharge machines at various bus stops, improvement of entry and exit systems in public buses, availability of sufficient charging systems in public buses and provision of free Wi-Fi in the public buses. Also, the study found that, commuters prefer to pay transport fare directly with WeChat and Alipay applications rather than other applications.
Keywords: Public bus (PB), Transportation, Commuters, Expectation, Attractiveness (ATT), Satisfaction (SAT), Loyalty (LOY)
Cite this paper: Alexander Narh Tetteh , Emmanuel Tetteh Teye , Oliver Tekyi-Arhin , Beatrice Ayerakwa Abosi , Deborah Rachel Annor , Ren Chong , When Expectation Meets Satisfaction: Examining Users and Non-users Perceived Expectations towards Public Bus Services, International Journal of Traffic and Transportation Engineering, Vol. 7 No. 4, 2018, pp. 78-90. doi: 10.5923/j.ijtte.20180704.02.
Article Outline
1. Introduction
- Rapid urbanization has resulted to traffic congestion and high carbon emission in megacities. It disrupts business activities, thereby reducing productivity (Harriet. T. et. al, 2013). Researchers have assessed several policy options in promoting green transportation due to the constant growing of transport demand which has led to increase CO2 emissions (Gronau, W. (2017). One of the policies which remains imperative and constant in the literature is improving public bus (PB) services by making them attractive to meet commuters’ expectation and satisfaction (Zhang L. et. at., 2018, Xumei et. al, 2009, Chalak. A et. al, 2016, Tandir, N., & Tandir, H. (2016), 2016, Paulley 2006, Wu, J. et. al. 2016, Giulia. D. et. al. 2014, Tri B. Joewono et. al, 2016, Begoña Guirao et. al, 2016). It is believed that, making public bus services attractive has the ability to retain users and attract non-users to drop their cars to use public buses (Joewono, T. B., & Kubota, H. (2007, Silkunas, 1993, Wu, J. et. al. 2016). It must be noted that, the factors that influence PB improvements are multidimensional (Geng, et. al., 2016: 2017, Chen, X. et. al., 2014, Morris & Guerra, 2015, Acker et. al., 2016) and, since what make public buses attractive varies from city to city, it is therefore vital for policy-makers in the transport industry to identify the major variables which influence PB attraction and satisfaction in different cities and implement these strategies based on the actual challenges that those cities are facing to promote PB usage (Chen, X. et. al., 2014). Not only does PBs help in mitigating traffic congestion, its dependence on electricity contribute to making green environment a reality. PBs are energy efficient, making it environmentally friendly (Chen, X. et. al., 2014). Even though as part of the success of achieving low-carbon goal and reduction in traffic congestion has been attributed to public transport development models globally (Zhang, L et. at., 2018), policy-makers are yet to realize the goal of promoting the use of public transport (public bus) through innovative reforms (Ongkittikul. S, & Harry Geerlings, 2006). While many studies talk about the “why” PB must be made attractive to meet satisfaction, only few of the literature talks about the “how” to improve public buses to make it attractive and satisfactory to commuters. Study proves that, over the years, the number of PBs have increased rapidly, but does not reflect ridership (Chen, X. et. al., 2014). This could mean that, even though PBs keep increasing, it is not meeting the expectation of commuters. According to (Lai, W. T., & Chen, C. F. 2011, Joewono, T. B., & Kubota, H. 2007), when commuters perceive PBs meet their expectation, they are likely to value it satisfactory and use it. To increase public bus usage, its services should be designed to meet the services required by users and potential users. Individuals’ preference of transportation is influenced by different factors, such as lifestyle. It is vital for transport planners to understand individual’s desires and expectations towards PB services. (Gabriel B. and J.A Sarfield carbal, 2007, David & Ahmed, 2016). How commuters consider PBs attractiveness depends on several factors and varies among cultures. Therefore, to promote PB usage, there is the need to ascertain what commuters want and perceive as attractive to them at a particular geographical setting. Although, individuals may have different transportation preferences as stated earlier, comfort is one of the key elements of commuters’ satisfaction which no commuter will take for granted (Hensher et. al. 2003, Hensher & Tirachini, 2011, Friman, 2001, Gabriel and sarfield, 2007, Redman et. al., 2013). At the time of this study, public buses are lacking some essential reforms which can improve commuters’ satisfaction and attraction to its services. As at the time of this research, public buses are still not disability friendly, no or limited storage space for luggage, limited or no charging systems in PB, difficulty in entry and exit by commuters with children in baby seats, no means to recharge bus cards at various bus stops in case one’s bus card runs out unexpectedly, among others. A study noted that, the choice of using PB is depended on one’s perception and preference (Joewono, T. B., & Kubota, H. 2007), also, commuters are perceived to be “sole judges of public bus service quality” (Wu, J. et. al. 2016). Moreover, customer satisfaction usually has a connection with perceive service quality (Jen and Hu, 2003; Petrick, 2004, Chen, 2008). According to (Chalak, et. al. 2016) a realistic improvement in bus services will lead to a reasonable reduction in private cars emission, and traffic congestion. Many policy implementations in addressing traffic congestion and private cars emission, has turn to be policies deterring commuters from meeting their needs (travel needs) rather than satisfying the needs (travel needs) of commuters. Government policies have been more radical and coercive on car ownership as a mean of controlling traffic congestions (He, S. Y., & Thøgersen, J. (2017, Scott G. Dacko, Carolin Spalteholz, 2013). Various reforms had been applied to reduce traffic congestions in megacities. Some global measures include fuel tax, parking fees, congestion fees, among others (He, S. Y., & Thøgersen, J. 2017). In China, some policies to control car ownership includes; auction or lotteries to obtain a vehicle license, limited to local citizens, traffic restriction policies based on last digit of license plates (He, S. Y., & Thøgersen, J., 2017) yet, car ownership is still on the rise. These measures have yielded little results since it only deters commuters from meeting their needs (travel needs) rather than satisfying the needs of the commuters. Addressing the expectations of users and non- users towards PBs will increase PB patronage and will contribute to combating traffic congestions and high CO2 emissions in megacities. Few studies have been conducted on how to make public buses attractiveness from the perspective of users and non-users (Dell Asin. G. et. al., 2014). Contributing to the literature to ascertain those aspects which can improve quality of public bus services, to make them attractive (Redman. L. et. al., 2013), this study aims to ascertain some attractive factors which affect commuters’ satisfaction and loyalty towards PBs by empirically exploring some perceive expectations of commuters and non-commuters towards PBs attractiveness. The study explained the theoretical framework from the customer satisfaction perspective and highlight some essential factors which will make public buses more attractive, accessible, reliable, and convenient to boost the desire to use them (public bus). This article is unique as it offers some insights into commuters’ expectations regarding public bus services that have not been empirically examined previously. Findings of this study when considered would be very useful to public transport planners and other researchers.One of the major responsibilities of every government is to provide good social services for its citizens as a way of improving their standards of living of which transportation is one of the key services that both developed and developing countries are highly investing into to make commuting attractive, comfortable, reliable, and easily accessible by all. In China recently, government is implementing more strategies and innovative ways to improving the transportation system. As a matter of fact, there have been improvements in rail systems, subways, cycling, airlines etc. There is no doubt government is making tremendous investments in the public bus system. To ensure government investment meet users and potential users’ expectation, information of commuters’ satisfaction must be provided to policy-makers and operational managers in the PB services to ensure effective planning to boost PB patronage (Fellesson, M., & Friman, M. (2012, TRB, 1999). Much attention needed to be given to the public bus services since it is the key means of transportation in the country. Looking at the number of people who commute with the public buses daily, it has to be the first point of call as far as any innovation in the transportation sector is concerned since its imperatives cannot be overlooked. (Morris et. al., 2005, Andaleeb et. al., 2007, Ahn, 2009, White, 2010). Quality of service is an important factor in public transport system and should not be taken for granted in transport policies. Policy planners in the transit sector must make public buses very attractive in a way that it would make private car users to forgo their cars and use public buses (Liu & Ceder, 2015). In Britain, the government entered into a bus quality partnership by investing to ensure public buses quality to attract private car drivers to change mode to relief urban traffic congestion (Davison, & Knowles, 2006). Even though, the study by (Wiseman, Y., 2018) argue against the future of public mass transportation such as the rails, by arguing that in an era of autonomous vehicles, the concept of public mass transportation will be obsolete thereby calling for diversion of subsidies for public transportation into facilities of autonomous vehicles, this present study disagree with the argument of (Wiseman, Y., 2018) since public mass transport such as rails has been in inception for more than 200 years (Kalra, N. and Paddock, S.M., 2016) and has been able to stand the test of time. This present study believes that in an era of autonomous vehicles, it would only serve as a complement to the public transportation system and not to relegate the importance of public transportation such as the rails, or public buses. In the next sections, we present a theoretical background, proposed conceptual framework and hypotheses. Following this, we present methodology and the empirical findings. We conclude with discussion limitations and suggestions for future research.
2. Theoretical Background and Research Framework
2.1. Commuters’ Expectation
- Customer expectation is the perceived-value customers seek from what they spend their money on. From the perspective of (Parasuraman, 1988), customer expectation can be seen as the wishes and desire of consumers. That is what consumers think a service or product should offer them rather than what would offer (Gures, N et. at., 2014). Therefore, to realize customers’ satisfaction, their expectation must be managed effectively and efficiently (Kurtz & Clow, 1992, Hsieh et. al., 2011, Coye, 2004, Pitt & Jeantrout, 1994). According, to (Oslon & Dover, 1979), customer expectation is the cognitive acceptance of a product or service. Studies have found that, customers have many ways that inform their expectations about a particular product or service (Zeithanl & Parasuraman, 1993). It was noted that customers’ expectation influences their demand and one can argue that, the major antecedent of consumers’ service quality assessment and satisfaction is the consumers’ expectation (Parasuraman et. al., 1985, 1988, Pham, K.-Q. V., & Simpson, M., 2006, O’Connor et.al., 2000, Gronroos, 1994, Oliver, 1980). In a related research, (Tse & Wilton, 1988), argued that, customer satisfaction assessment is based on series of expectations. It is then vital for service providers and manufacturers to consider the voice of customers into whatever they provide and also after delivering, there is the need to evaluate if the customers’ expectation have been met (Pakdil, F., & Aydın, O. (2007). A study by (Dell Olio et.al. 2011), found that, there is difference between desire quality of service and perceive quality by commuters. Desire quality of service according to the study, is what commuters desire, expect, or aim to receive whiles the perceived quality is commuters’ day to day experience of the service provided to them.
2.2. Satisfaction
- Customer Satisfaction is a key performance indicator that tracks how satisfied customers feel about a particular products or services. It’s a psychological state that is measured by the customer’s expectations. By knowing what those expectations are, service providers can dramatically increase their customer’s loyalty to the brand they offer.Satisfaction is not a new phenomenon. Its genesis can be traced from a Latin word “satis” and “faction” meaning enough and to do/make respectively. Satisfaction as used earlier was used to means free from wrong doing (Aigbavboa, C., & Thwala, W. (2013). In a study conducted by (Oxford Library of Words and Phrases (1993), later stressed on satisfaction to mean “release from uncertainty”. In recent years, the meaning of satisfaction has been extended in a broader perspective. Around 1970’s the study on satisfaction appeared on numerous literature (Hunt, H. 1982), however, most studies of satisfaction have been related to customer satisfaction (Aigbavboa, C., & Thwala, W. 2013). At present, researchers view satisfaction from a consumer or user behavior perspective in association to the consumers’ cognitive acceptance about what they spend their resources on (Kim, S.-H. 1997), according to (Day, R. 1980), “whiles everyone knows what satisfaction mean, it clearly does not mean the same thing to everyone”. It is therefore vital to investigate to ascertain what will be satisfactory for individuals or group of people with respect to the product or service offered to them. From the perspective of (Oliver, R.L. 1980), customer’s satisfaction can be seen as the difference “between expected and perceived product performance, and expectations as predicted of future performance”. According to (Churchill, & Surprenant, 1982, Tse, D.K. & Wilton, 1988), perceived performance can be seen as the antecedent of satisfaction. In view of (Kotler, P. (2000), satisfaction can be seen as “a person’s feeling of pleasure or disappointment resulting from comparing a product’s perceived performance (outcome) in relation to his/her expectations”. Adding to this, (Hoyer, W.D. & MacInnis, D.J. (2001), argued that satisfaction can be attributed with “feelings of acceptance, happiness, relief, excitement, and delight”. In a study by (Hansemark, O.C. & Albinson, M. (2004), also found that “satisfaction is an overall customer attitude towards a service provider or an emotional reaction to the difference between what customers anticipate and what they receive, regarding the fulfilment of some needs, goals or desires”. In recent studies the most widely accepted portraiture of satisfaction is in reference to (Parker, C. & Matthews, B.P. (2001), who define satisfaction as the process of assessment between what was finally received and what was expected. With this definition of satisfaction, most institutions and firms derive several meanings to measure their own consumer satisfactions. To deal with this, a National customer satisfaction index was established (Spreng, et.al., 1996). The American Consumer Satisfaction Index (ACSI) and the European Customer Satisfaction Index (ECSI) are the most common among the rest. From the (ACSI) perspective, (Fornell, C., et. al., 1996), define satisfaction as a “weighted average of three survey ratings; perceived quality, perceived value, and customer expectations”. The ACSI model is notable in many fields such as transportation, communication, service, finance, manufacturing, public Administration among others. According to the ACSI model, consumers’ expectation affects their assessment of quality of a product or service whiles the perceive quality according to the model, indicates the range to which the product/service satisfy the expectation of the consumer (Aigbavboa, C., & Thwala, W. (2013). Previous studies found that, customer satisfaction has a positive significant correlation with customer loyalty and behavior intention (Petrick & Backman, 2002, Cronin & Taylor, 1992, Fornell, 1992, Anderson, E.W. & Fornell, C. (1994, Oliver, 1980, Nathanail, E., 2008, Joewono, T. B., & Kubota, H. (2007). In a related study (Jeowono & Kubota, 2007, Silkunas, 1993), found that satisfying current customers is a way to retain them and also attract new ones. In the field of marketing, consumers’ satisfaction has been among the most vital construct (McQuitty et. al., 2000, Morgan et. al., 1996) and the top most aim (Erevellen & Leavitt, 1992) for goods and services providers. Studies found that, one of the key predictors of purchasing behavior (purchase intention, switching behavior, repurchase) is satisfaction (Oliver, 1993; McQuitty et. al., 2000). Even though studies found that, satisfaction may not be the main measure of loyalty, especially after loyalty has been accomplished, it will be very difficult to attain loyalty without satisfaction. This makes satisfaction an important step in achieving loyalty (Oliver, 1999).
2.3. Attraction
- In a study by (Cain, A., & Flynn, J. (2013), found that, for public bus (PB) to attract commuters at a level compared to rail, it must contain tangible and intangible service attributes similar to rail. And this is one of the reasons this article argues that, PB has been in inception for long and it must be specially design to contain some attractive factors. Quality of public transport (public bus) needs to be improved in terms of reliability, accessibility, attractiveness to demotivate people from driving. If the motive urging individual’s choice of commuting is the perceived image of service quality between public transport and cars (Prioni & Hensher, 2000), then policy-makers must endeavor to come out with innovations in the public transport sector to make public buses more attractive to users. If PB is to attract commuters, it must offer services that convey attractive image (Cain, A., & Flynn, J. 2013). This shows that, making public bus services more attractive has the tendency to promote mass usage of PB to reduce traffic congestion in megacities. From the perspective of (Tandir, N., & Tandir, H. (2016), public bus service needs to carry an image that would attract commuters. Understanding what commuters consider vital and how they perceive public bus services indicate whether investment and improvement of existing service can truly attract new commuters and retain existing ones (Fellesson, M., & Margareta. F., 2008). According to (Tandir, N., & Tandir, H. 2016) on a study of perceived satisfaction, the results of the study indicates that, public transport services needed to be improved since there is the perception that current public transports are not attractive enough to satisfy commuters. In a similar study by (Redman.L. et. al., 2013), argued that PB services has the potential to attract users by improving the quality of its services.
2.4. Commuters Loyalty
- According to (Oliver, 1997), loyalty is “a deeply held commitment to rebuy or re-patronize a preferred product/service consistently in the future, thereby causing repetitive same-brand or same brand set purchasing, despite situational influences and marketing efforts having the potential to cause switching behavior”. Studies further proves that, for consumers to remain loyal, they must believe that, the goods/ services provided meet their expectations (Oliver, 1999). One interesting findings in the literature proves that, satisfaction becomes less significant to consumers after loyalty is achieved. This means that, loyal consumers are usually said to be satisfied (Oliver, 1999). Two categorizations of brand loyalty prevalent in recent times are attitudinal and behavioral loyalty. Whiles attitudinal loyalty is attributed to the consumers’ feeling toward a particular brand, behavioral loyalty is the consumers’ experience and observation of the goods/services they constantly purchase (Morgan, 1999, Chauhuri & Holbrook, 2001). However, a study on loyalty stresses that behavioral loyalty comes in different forms. The study indicates that, frequency of an amount purchased can be associated with the consumer’s primary behavior. And the consumer’s second loyal behavior consists of the consumer’s referral, acknowledgement and word of mouth, the final loyalty behavior according to the study is the consumer’s intent to rebuy goods/services without considering whether they will be willing to purchase the same brand in the near future (Jones & Sasser, 1995). The study by (Oliver, 1999) also came up with four stages of brand loyalty in ascending order. According to the first level of cognitive loyalty, consumers are loyal to a particular brand based on what they know about that brand. The next stage has to do with affective loyalty. Affective loyalty is linked to the consumers’ emotion towards the brand they prefer. Whiles the third stage conative loyalty has to do with high degree of consumers’ commitment to purchase a particular good/service. At the final stage, action loyalty is where consumers willingly transform their initial intentions into actions. At this stage, consumers are able to resist factors that entangle them to purchase a particular good/service. Thus, this study put forward the following propositions;Hypothesis (H1): Availability of bus card recharge machines at various bus stops will make PB services attractive.Hypothesis (H2): Availability of storage space in PBs will make PBs attractive.Hypothesis (H3): Easy entry and exit systems in PBs will attract more users especially, commuters carrying children in baby seats and physically challenged persons.Hypothesis (H4): Availability of sufficient charging systems in PBs will make it attractive to users. Hypothesis (H5): Making PBs attractive will be satisfactory to commuters.Hypothesis (H6): when PBs become attractive, commuters will be loyal to its use.Hypothesis (H7): when commuters find PBs satisfactory, they will be loyal to its use.In line with the proposed hypothesis, a conceptual framework is developed.
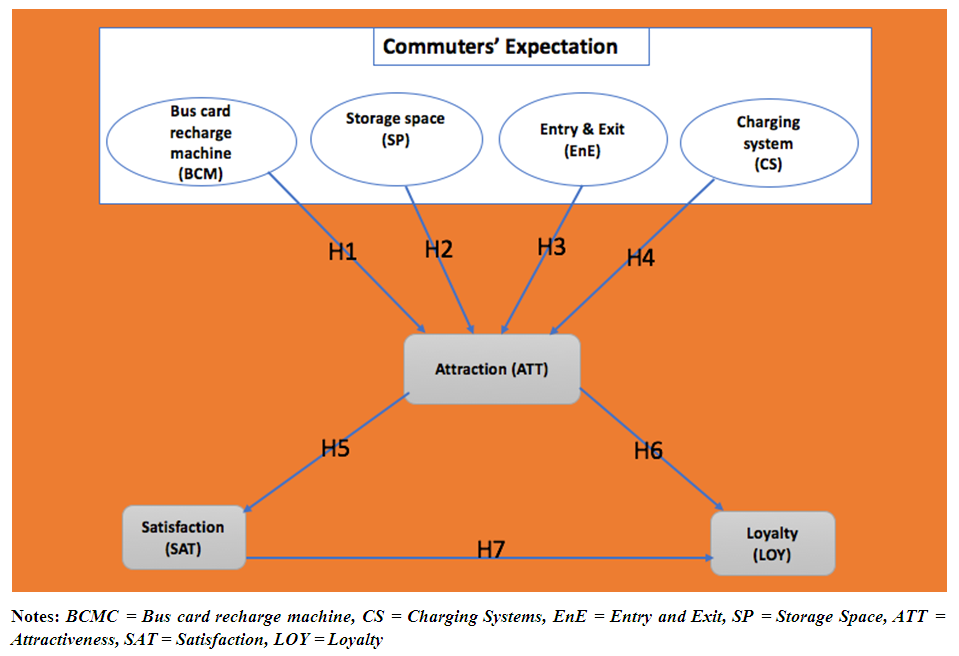 | Figure 1. Research framework and research hypotheses (H1–H7) of commuters’ perceived expectations towards public buses |
3. Research Methodology
3.1. Research Settings and Design
- A literature review was conducted on how to make PBs attractive and satisfactory for commuters to become loyal users. Based upon this review, a framework of key determinants of PBs attractiveness was developed, incorporating both elements of theory and best practice. First, relative possible factors likely to make PBs attractive are identified. Second, the predicted attractive factors are tested by investigating the opinions of users and non-users of PBs. Due to the nature of the study, participants who are willing and ready was considered for the survey. The purposeful random sampling technique was used to select respondents for the purpose of increasing credibility and not only to foster representativeness of the total population. The questionnaires were administrated in both English and Chinese Languages. Special attention was paid to translating the original version of the measurement scale to capture the linguistic nuance. The scale was first translated into Chinese and then translated back into its original state by another translator in order to verify if the correct meaning of the questions were maintained. The survey was confidential and anonymous. The items in the questionnaire were adapted from previous studies and slightly modified to be suitable for the present study. The questionnaires contained structural and close-ended questions. These items were rated using a five-point Likert scale ranging from ‘‘strongly disagree” (1), “disagree (2)”, “maybe (3)” “agree (4)” and ‘‘strongly agree” (5). Data analysis is then conducted by using structural equation modeling (SEM) technique. The model links attractiveness and satisfaction to its determinants, and, in turn, to its, consequence, namely loyalty. The determinants of attractiveness and satisfaction are storage space, bus card recharge machines, charging systems, and easy entry and exit systems. Each of these seven latent variables is operationalized by a set of measurement variables, observed by questions to the respondents, and the entire system is estimated using a partial least square (PLS) method (Fornell and Cha, 1994). To measure the predictor and outcome variables, instruments was developed for both the latent and observed variables all of which were combined into a satisfaction measurement model. This served as the motivation to select structural equation modeling (SEM) as the appropriate method of analysis. Accordingly, a sample size for complex SEM should be more than 100. (Kline 2005). In order to minimize a social desirability bias in the measurement of the constructs, it was emphasized in the cover letter that, there are no right or wrong answers and also assured that all responses would be held strictly confidential (Zahra and Covin, 1995).
3.2. Sample and Data Collection
- The data was collected in Hefei, China. Most of the respondents were approached in various public buses and were asked to participate in the survey. Commuters who were travelling for about 20 minutes agreed to respond to the survey. On the other hand, some private car drivers were approached and was asked if they can assist to respond to the survey. Approximately, 10-15 minutes was enough to complete a questionnaire. The survey which started in June, 2018 ended in July, 2018. At the end, 396 respondents were contacted out of which 314 responses were complete and valid for the data analysis therefore, the response rate was about 79.3%. The age range of respondents was 18 years and above. The response had 167 males representing 53.2% and 147 females representing 46.8%. According to the responses, commuters’ preference of bus fare payment are as follows: 77 responses representing 24.5% prefer wechat, 150 responses representing 47.8% prefer electronic bus card, 72 responses representing 22.9% prefer Alipay while 15 responses representing 4.8% prefer to use coins.
3.3. Measurements
- Measures for satisfaction were adapted from existing scale from prior research with four items (Cronin Jr, et. al., 1992; Wen-Tai Lai, Ching-Fu Chen; 2011, and Almsalam, S. 2014). Some items include; “Generally, am satisfied with the use of PB”, “am pleased that I decided to use PB”, “using PB exceeded my expectation” and “I will speak highly of PB to my friends and colleagues”. Attractiveness towards PB had four items adapted from (Lievens, F. et. al., 2005; Highhouse, S., et. al., 2003; Lievens, F., & Highhouse, S. 2003; and Hillebrandt, I., & Ivens, B. S. 2013). Some items include; “Am proud to say I use PB”, “Using PB is very appealing to me”, “PB is attractive for me as a means of transportation”, and “For me PB would be a good means to commute with”.Commuters’ loyalty towards PB was measured with six items adapted from (Han, X., et. al., 2008; (Oliver, R. L., 1999; Bobâlcă, C., et. al., 2012; and Zeithaml, V. et. al., 1996). Some items include; “Using PB does not reduce my status”, “I feel quite certain of the benefit I could expect to get if I use PB”, and “I will choose to use PB instead of taxi, didi or driving”.Easy entry and exit was adapted from (Joewono, T.B., Kubota, H., 2007; Imam, R. 2014; and Griffin, K. W. (2004) With two items. Items include; “I find it difficult entering and exiting PB with child in baby seater” and “I find it difficult entering and exiting PB”.Furthermore, bus card recharge machine had two items. Items includes; “I find it difficult loading my smart card when it runs out unexpected” and “Smart card cannot be recharged online”.Availability of charging system had three items. Some items include; “There is no charging systems in PB for use in case of need” and “The number of charging system is PB is not enough to accommodate a large number of people of commuters”.Finally, availability of storage space in PB had two items. Items include; “There is need for storage space in public buses” and “I don’t feel comfortable travelling with luggage in public buses”. All items for bus card recharge machine, charging system, and storage space were adapted from (Imam, R. 2014).
4. Results
- According to Fornell and Chan (1994), the adopted procedure for analyzing the data has been the analysis of structural equation using the partial least square (Smart PLS). PLS uses ordinary least square (OLS) algorithm. It is designed to reflect the theoretical and empirical qualities of social science and behavior, where there are usually instances with insufficient supported theories and little information available (Wold, H. (1979). Before analyzing the structural model, we assessed the reliability and validity of each construct. (Hair et al. (2010) recommended the acceptance of items with a minimum loading of 0.7. The reliability of the individual items was reasonably judged, given that no items exhibited loading of less than 0.7 (Table 1). Composite reliability (CR) is measured in relation to internal reliability. The CR of all the constructs was above 0.7, (Table 1), which satisfies the rule of thumb in (Hair et al. (2013). The average variance extracted (AVE) was used to evaluate the convergent validity; this value exceeded 0.5 in all of the constructs (Table 1). This finding indicates that the convergent validity of these constructs is satisfactory (Fornell and Larcker, 1981). The R2 for the three dependent variables; attraction, satisfaction, and loyalty are 0.103, 0.624, and 0.584 respectively. (Table 1). The Q2 of the dependent variables; attraction, satisfaction, and loyalty are 0.077, 0.426, and 0.487 respectively (Table 1). The Stone-Geisser Indicator (Q2) evaluates how much the model approaches what was expected of it (or the model prediction quality or accuracy of the adjusted model). Q2 >0 means that the PLS-SEM model is predictive of the given endogenous variable under scrutiny (HAIR et al., 2013). The mean, standard deviation, and discriminant validity of all the constructs obtained are summarized in (Table 2). SRMR=0.059 which is within the accepted threshold of 0.080. Also, NFI =0.813 similar to (NFI=0.818) reported by (Joewono, T.B., Kubota, H., 2007). Although it is slightly lower than the 0.90 threshold, it is believed that, one of the consequence of comparison between covariance structure analysis modeling approach and PLS is that, no proper overall goodness-of-fit measures exit for models using the later (Hulland, J. 1999), (Henseler. J. & Sarstedt, M., 2013). The structural model is often evaluated examining the “R” Square values and size of the structural path coefficients (Alon, I., et. al., 2013). The structural model resulting from the PLS analysis through the bootstrapping procedure with 314 cases and 1000 samples is summarized in (Table 3), where the T-values observed and their corresponding, path coefficients (β), P-values and F2 values with the level of significance achieved from the bootstrap test are shown. For the degrees of freedom, t-values of (t> 1.96) and path coefficients (β-values) >0.1 correspond to p-values of (**p < 0.05). As observed, six out of the seven hypotheses presented have been verified. With respect to the relationship of bus card recharge machine (BCMC) and the consequent variable of the model, in accordance with hypothesis (H1), the influence of BCMC on attractiveness (ATT) has been fully confirmed (t=1.984**, β=0.129; β> 0.1). Moreover, the effect of storage space (SP) and entry and exit (EnE) on attractiveness, H2 and H3, are positive and significant as shown respectively (t= 2.376**, β=0.157; β>0.01 and t=2.784**, β=0.146; β>0.1). The effect of charging system (CS) on attractiveness H4, is positive but not significant (t=1.023, β=0.062 β<0.1). This is possibly because, most of the respondents were observed using power banks to charge their phones during the administration of the questionnaires. Thus, the effect of CS on ATT was not significant in this research. The results of H1, H2, H3 and H4 confirms a study by (Cain, A., & Flynn, J. (2013), which argued that for PB to be attractive to commuters, it must contain some tangible and intangible attributes similar to rail. Also, the effect of attractiveness on satisfaction, H5 is positive and significant (t=24.062**, β=0.790; β>0.1) which is in line with previous studies (Jeowono & Kubota, 2007, Silkunas, 1993). Again, the effect of attractiveness on loyalty H6, is also positive and significant (t=6.777**, β=0.472; β>0.1). Furthermore, the effect of satisfaction on loyalty H7, is positive and significant (t=4.810**, β=0.334; β>0.1). Finally, results of H6 and H7, also confirms similar findings of previous studies (Gures, N. et. al., 2014, Petrick & Backman, 2002, Cronin &Taylor, 1992, Fornell, 1992, Anderson & Sullivan, 1993, Oliver, 1980, Nathanail, 2008, Joewono, T. B., & Kubota, H. (2007).
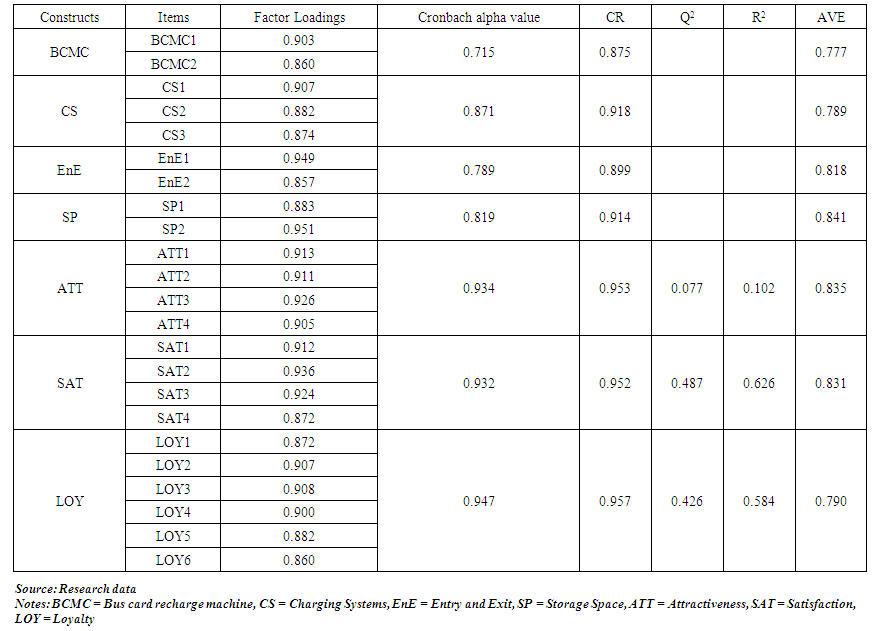 | Table 1. Quality criteria of model application according to PLS method – SEM specification – Factor loadings, Cronbach´s Alpha, composite reliability (CR), R2, Rates of average variance extracted (AVE), and Q2 of Constructs |
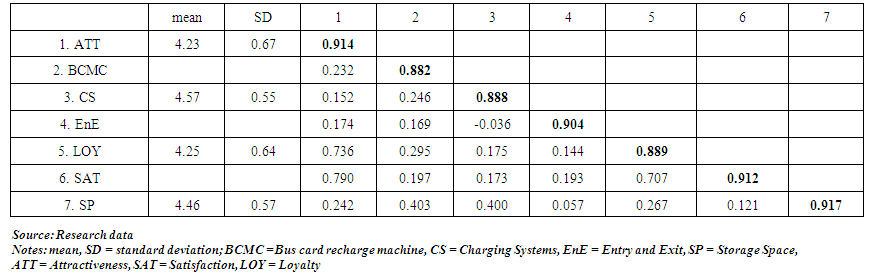 | Table 2. Discriminant Validity (Fornell and Larcker criterion) |
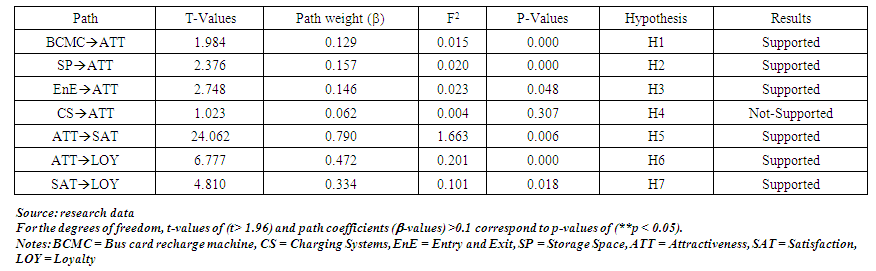 | Table 3. Quality criteria of model application according to PLS method – SEM specification with Path coefficients, T-values, P-values, F-square of the structural model through the bootstrapping procedure with 314 cases and 1000 samples |
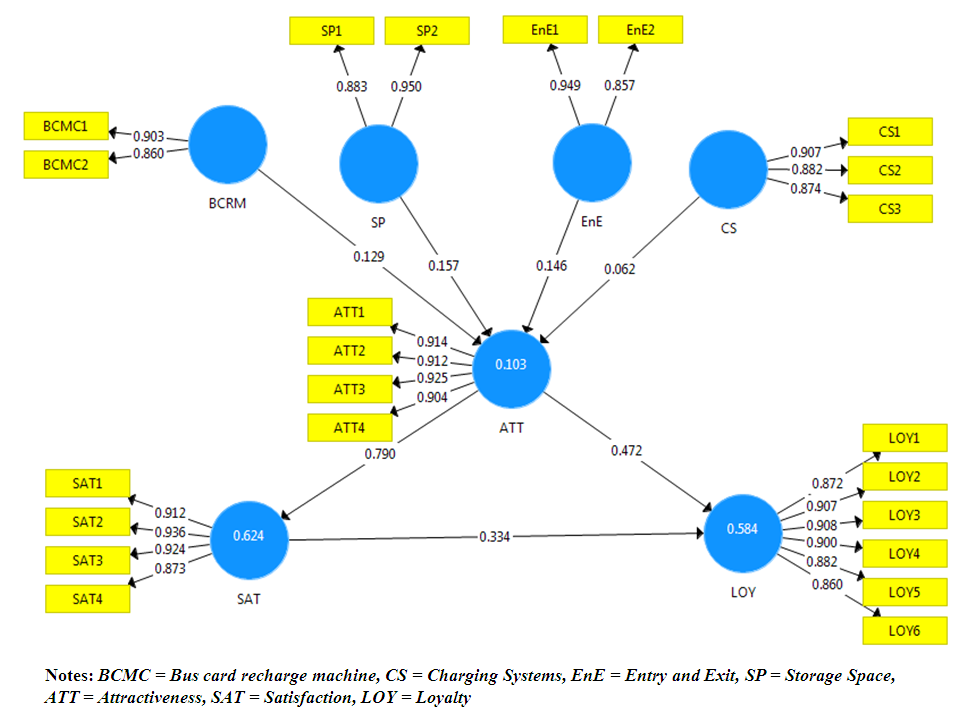 | Figure 2. Outer model with factor loadings of the structural model according to the SmartPLS method (Source: Research data) |
5. Discussions
5.1. Payment
- The introduction of bus card payment system has helped complement the use of coins in bus fare payment. Commuters are supposed to load their card in other to pay for their fare. Most often than not, it is difficult to know the balance on the cards since most commuters do not pay much attention to it. As a matter of fact, most commuters get onto the buses, before realizing their bus cards have run out of cash. At that moment, the only options are to use coins to pay or get someone to bill you out. If these options fail, it becomes difficult to board the bus unless one is willing to use note money to pay which the commuter may not even get change for it. Even that option is only possible if the commuter has cash on him/her at the time. The question is what happens if the bus card runs out, no friend to bill one out, and there is no cash on the commuter at that time? Does it mean that the commuter has to forgo the travelling at that time? Or he/she has to search for a vendor to recharge his/her bus card? What happens if the commuter at that time is on emergency call? In finding solution to this, this paper believes when smart phone payment system such as WeChat or Alipay is introduced in all the public buses to complement the existing payment, it will make commuting more flexible for commuters especially where payment of bus fare is concerned. Most people in China use mobile phones. According to the Ministry of Industry and Information Technology (MIIT), mobile phone users in China has reached 1.29 billion representing 94.5% of the total population (ChinaDaily.com.cn, August, 20-2017). China is the leading WeChat user in the world (DMR wechat report July 2, 2017 by Craig Smith) with an estimate of about 93% of the population using wechat in china. Total number of active users on WeChat reached 963 million in china (china internet watch, August 16, 2017). In China, most services payment is done through wechat or Alipay and the experience has affected the people which they forget at times to take other alternative means of payment with them. It is estimated that 600 million mobile payments monthly were through WeChat by active users and its payment related services. (https://www.chinainternetwatch.com/20042/tencent-2016/#ixzz4qJPZDLV6). One remarkable thing is that, a commuter may have only 20rmb on his/her bank card. And the person cannot withdraw that money before loading it to the bus card since the minimum withdrawal balance is 100rmb. In this instance, the commuter will be left stranded. But if there is WeChat or Alipay payment system, the person can easily pay the bus fare from the little balance on the bank card. Also, currently the only two main systems for public bus fare payment in Hefei, Anhui province is using bus card or coins. In China people don’t like carrying coins as seen from the respondents only (4.8%) prefer to use coins to pay bus fare. So, when one’s bus card runs out unexpectedly and there is only note money available, the person becomes stranded and begins to look for help in the public which most at times proves futile. This paper also, suggests that there should be bus card recharge machines at the various public bus stops especially for commuters’ whose bus cards might run out and do not also have coins on them to easily recharge their cards to pay the bus fare since bus cards can only be recharged at some designated supermarkets.
5.2. Provision of Wi-Fi
- China presently has developed to the extent that; Wi-Fi services are made available at almost every place. Free Wi-Fi services run from banks, supermarkets, restaurants, train stations, mini shops, and schools among others. Private customized buses (CB) in China became attractive when it includes internet, telephone, and smartphone to interact with its customers. Some of the incentives customers enjoy in customize buses include, free Wi-Fi, newspapers, magazines, and drinking water. These factors helped to boost patronage of the buses (Liu, T., & Ceder, A. A. (2015). If the proposed attractive factors are implemented in public buses, it will make the buses more attractive to commuters which will end up increasing patronage of public buses.
5.3. Provision of Charging Systems
- This paper also proposes sufficient installation of mobile phone charging systems in public buses. This is another innovative idea that will bring attraction and will take the public bus services to another level in china. This service will help commuters in many ways. Those whose phones run out of battery unexpectedly can easily charge them in the buses. The rate at which people carry power banks around just to make sure their phones are not off indicating how concern they are in keeping their phones from running out of power. The availability of charging systems will increase commuters’ satisfaction.
5.4. Storage Space for Luggage
- Most people admire travelling with luggage even on short distances. Due to the nature of the public buses it is not convenient when carrying a luggage especially when the bus is full of commuters. Not only the owner of the luggage suffers the inconvenience but other commuters also do. The luggage blocks space making it difficult for people to enter and exit. When a commuter is travelling about an hour, the situation becomes worse to cope with when having a luggage. Going forward, space can be created in the buses for commuters to keep their luggage. This will make it more comfortable for those with luggage to commute with the public buses and will not change mode.
5.5. Creation of Easy Entry and Exit Systems in PBs
- Among the factors that de-motivate commuters from using public buses are disability and discomfort. This paper propose that public buses should be made disability friendly by creating entries and exit systems for physically challenged persons especially those in wheelchairs. It is estimated that there are roughly 500 million “disadvantaged” people in China, including 60 million disabled (Yulin, J. et. al., 2006). This people also need to enjoy the services of the country such as public bus services and cannot be abandoned because they are disabled. A system should be created for people in wheel- chairs to easily enter and exit public buses. When these systems are created in the public buses, not only will it benefit disable persons but it will also be of good help to commuters who travel with their children in baby seats. It was observed that commuters find it difficult entering and exiting the buses with their children in baby seats. As a form of addressing social needs of the people, when easy entry and exit systems are created it will help commuters especially physically challenged persons in the country and will make public bus services accessible to all.
6. Limitations and Future Research
- The survey only focused on a small portion of a larger population. Future study should also focus on other cities to ascertain if commuters have similar expectations. This will help transport planners to know certain attractive factors that they must be bond to provide for commuters in general. Factors that urge people to use public buses are numerous. As this paper only access few of these factors, further studies can also investigate if the use of PBs varies in seasons. For instance, do people patronize PBs more in summer compared to winter with strong snow. If there is vast difference, what strategies can be used to bridge the gap.
7. Conclusions
- This present study believes in the future of public transportation and since public bus services have been in inception for long, we believe that, there is no way its imperatives will be relegated any soon. It is therefore essential to come out with innovative ways to make its services convenient, reliable, accessible, attractive, and satisfactory for commuters. As long as comfort, reliability, and attractiveness are the major things motivating individuals to own cars, any policy contrary to addressing these needs will prove futile. This paper presents an innovative idea to improving public bus service. The paper presents a model which will help to make public buses attractive. Among other things the paper outlines the need for Wi-Fi, charging system, and storage space for luggage in PBs. Also, provision of bus card recharge machines at various bus stops will be a dynamic way of improving the public bus services in the country. Again, creating of easy entry and exit system in PBs will make public buses accessible to all. Even though this research may be peculiar to a particular city, when considered carefully, it can serve as a mirror for transport planners to access commuters’ specific expectations toward public transport services in any geographical location and plan accordingly. Looking at the economic development and improvement of China’s standard of living, the transportation system must also accommodate the increasing expectations for better service quality such as easy accessibility, attractiveness, comfort, safety, and efficiency, all at a lower cost (Wu, J. et. al. 2016).
ACKNOWLEDGEMENTS
- We wish to extend our sincere gratitude to the school of Public Affairs of the University of Science and Technology of China for their great contribution towards this research work.