Weerahennadige Suren Hemal Romesh Fernando, Niranga Amarasingha
Department of Civil Engineering, Sri Lanka Institute of Information Technology, Malabe, Sri Lanka
Correspondence to: Niranga Amarasingha, Department of Civil Engineering, Sri Lanka Institute of Information Technology, Malabe, Sri Lanka.
| Email: |  |
Copyright © 2018 The Author(s). Published by Scientific & Academic Publishing.
This work is licensed under the Creative Commons Attribution International License (CC BY).
http://creativecommons.org/licenses/by/4.0/

Abstract
Railway-roadway level crossings are dangerous crash prone locations and the safety at these locations is of utmost importance. The objective of this research was to analyze the contributing factors of railway-roadway level crossing crashes. Crash data at railway- roadway level crossings, level crossing characteristics and both railway and roadway characteristics were collected along the coastal line from Pettah to Aluthgama in Sri Lanka. Seventy-seven level crossings were identified along this railway route. The data were collected using field surveys and site visits. The Multiple linear regression analysis was used to compare how a considered set of independent variables affects the dependent variable which was the crash data. According to the multiple linear regression analysis, the distance to nearest curvature from Colombo direction and Galle direction and the available traffic control system at the level crossings were not significant predictors of the occurrence of crashes at level crossings. The sight distances from the seaside and the land-side were significant predictors of crash data according to the regression model results. The sight distance from the seaside had a higher impact than the sight distance from the land side according to the standardized coefficients obtained from the model. The dangerous and hazardous level crossings along the selected route were identified through the detailed analysis of the crash data. Enhancements that could improve the standards of Galvanized Iron (GI) gates were identified and increasing the GI gate operator’s salary was also proposed.
Keywords:
Level Crossings, Fatal Crashes, Level Crossing Safety Equipment, Level Crossing Characteristics
Cite this paper: Weerahennadige Suren Hemal Romesh Fernando, Niranga Amarasingha, Linear Regression Models to Evaluate Characteristics of Railway-Roadway Level Crossings in a Developing Country, International Journal of Traffic and Transportation Engineering, Vol. 7 No. 3, 2018, pp. 43-52. doi: 10.5923/j.ijtte.20180703.01.
1. Introduction
Many transportation modes exist in the world today. Among them, the train is an energy efficient transport mode which deals with the means of transport of passengers and goods on wheeled vehicles running on rails. This is an important mode of transportation because it has many advantages over air, roadway, water, and other land transportation modes. Railway transportation is comparatively safer, faster, economical but more dependable than the other modes of transportation because it is not affected by the change of sunshine, rain, or other adverse weather conditions. This is the cheapest transportation mode which helps towards public welfare since it carries hundreds of people to the same location for a lower price [1]. The carrying capacity of railways is high and elastic, that means the capacity can easily be increased by adding more wagons. Furthermore, the development of railways has led to an increased amount of jobs for both skilled and unskilled labour.
1.1. Railway- Roadway Level Crossings
A level crossing is a location where a railway and a roadway, or two railway lines, crossing at the same level on the ground [2]. Figure 1 shows a protected level crossing equipped with a gate in Wadduwa, Sri Lanka.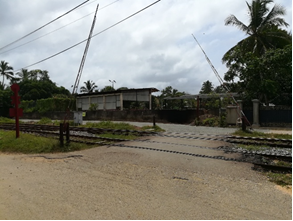 | Figure 1. A Level Crossing in Sri Lanka |
There are different types of level crossings and vehicle drivers and other users should be aware of each of these types in order to cross safely. Trains have a much larger mass in comparison to that of road vehicles. The braking distance of a train is much lengthier than that of normal road vehicles. The huge mass and high speed of trains result in the generation of a large momentum. All momentum gained should be reduced in order to stop the train and this requires a longer distance [3]. Therefore, the priority at a level crossing is given to the train [4]. Different railway crossing safety techniques exist and they provide information and cautions to road users in different ways. The type of level crossings required for the crossing is determined according to features of the individual crossings. The main two level crossing systems are the passive and active systems which are determined by availability of warning devices. Passive level crossings are road-rail crossings that are only protected by warning signs and are normally found on roads that have less traffic. Warning signboards fall into this category. A passive level crossing notifies that the railway- roadway crossing is a dangerous place and road users should be careful at all times. It warns the road users to expect an approaching train and to always give priority to the train if it comes without trying to outrun it. Accidents are more likely to occur at passive crossings because the vehicle drivers on the road may not identify the approaching train [5]. The main passive control systems are the warning boards and signs indicating the position of a level crossing. Crossbucks are among one of the most used passive safety systems. These are found around the world and even in Sri Lanka as shown in the Figure 2. In the United States (USA), the back to back crossbucks are used on each of the railroad intersection [6]. 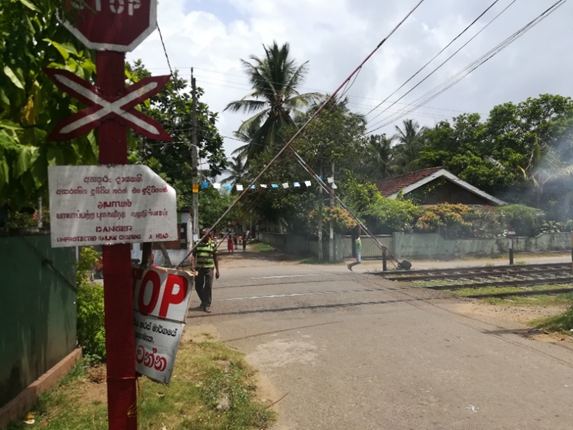 | Figure 2. A Crossbuck found in Sri Lanka |
Active systems are a safer level crossing comparatively to passive systems. Active traffic control strategies are an effective way to advance security at railway –roadway level crossings. They notify the driver of an approaching train and the driver has to take suitable safety measures only when the device is activated. An active level crossing is a level crossing controlled by automatic warning systems in addition to passive railway level crossing signs [2]. Active level crossings are usually found on first class roads or roads that are deemed to require high protection. They provide active warning of approaching trains and are complemented with the same road signs and marking used for passive surveillance. This consists of flashing lights mounted on poles or cantilevers, automatic booms, road signs, active alert alarms etc.
1.2. Railway Operations in Sri Lanka
Railway travel has a long and important history in Sri Lanka. Originally known as the Ceylon Government Railways, the first piece of track was put down by the British Governor, Sir Henry Ward, in 1858 [7]. The implementation of railways was very beneficial towards the crucial development in the gradual modernization of Sri Lanka [1]. The tracks were open for business in 1864, a remarkable achievement both in terms of speed in the pre-industrial era of the country and of engineering ingenuity and excellence [7]. The British used the newly made railway to transport the upcountry tea and coffee harvest to the commercial city of Colombo [1]. Extensions to the railway line were added during the years 1867, 1874, 1885, 1894, and 1924 [7]. Other additional railway tracks were added to the local railway system within the first century of the Ceylon Government Railways life span. Today the Sri Lanka Railways (SLR) operates 411 trains per day, a total track route length of 1960 km and it carries 348,206 passengers per day [2].The railway roadway level crossings in Sri Lanka can be divided into a few categories which are public crossings located on roadways under the jurisdiction and maintenance of public authorities, crossings that are open to the travelling public, and the private railway-roadway crossings which are privately owned and used only by the owner. There are reported 1,186 level crossings throughout the country and out of these only 130 are protected with an Automatic barrier, 155 are protected with bell and flashing lights, 140 are protected with lever operated barriers and only 17 are protected with wing type gates. Today the SLR is divided into three operating regions based in Colombo Maradana, Nawalapitiya and Anuradhapura. At present, there are nine important railway lines in Sri Lanka as shown in Figure 3 [1]. 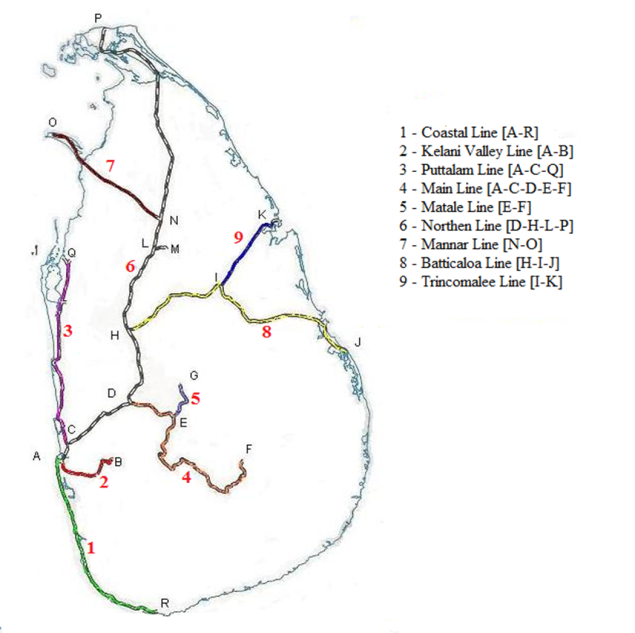 | Figure 3. Railway Network in Sri Lanka |
In Sri Lanka, four types of protected level crossings exist: farm gates, mechanically operated level crossings, automatic bell and light systems, and electrically operated barrier systems. Farm gates are protected by gates on both sides of the railway and are completed with the farm type gate when closed across the railway track. Mechanical level crossings are situated in locations having heavy traffic density. They are progressively interlocked with signals and planned basis by gatemen. Automatic bell and light systems have no barriers but are protected by road traffic light signals and an audible warning. Electrically protected crossings are protected by road traffic light signals and a lifting barrier on the side of the roadway on both sides of the railway [1]. Figure 4 shows an active level crossing equipped with a mechanical barrier protection situated in Hettimulla, Sri Lanka. Protected level crossings are consisted of permanent gates. Unprotected level crossings in Sri Lanka consist mainly of two types which are level crossings equipped with GI gates and level crossings which do not have any gates or warning signs. The GI gate level crossings are maintained by the Sri Lankan Police. The protected level crossings which are the permanent gates are maintained by the SLR. 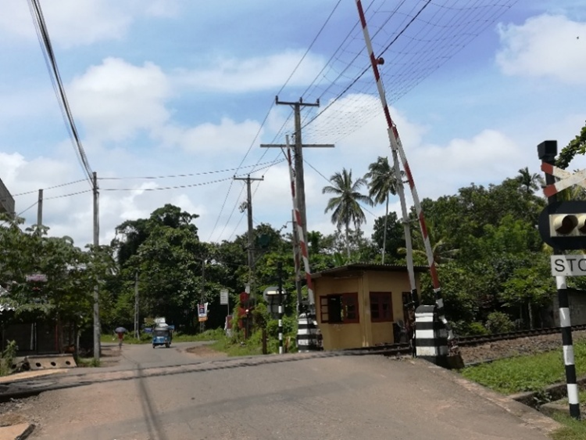 | Figure 4. Barrier Equipped Mechanical Level Crossing in Sri Lanka |
1.3. Safety at Railway Roadway Level Crossings
Railway-roadway level crossings are train-roadway vehicle crash prone areas due to the potential point of conflict between roadway traffic and trains. In the past, the protection at railway roadway level crossings was not an issue due to the limited number of trains that ran and considerably low speed, due to the less technological advancement. Furthermore, roadway users also used to travel by foot or animal drawn vehicles. Today the road network has expanded and there are many places of conflicts between roads and railways and speeds of modern motorized vehicles are higher showing much attention on crossings. Therefore, to prevent crashes at these locations, the application of suitable safety measures is important.Railway-roadway level crossing crashes are one of the most frequent railway related fatalities in many countries [8]. The loss due to level crossing crashes is significant and gives a negative impact on the economy and is amongst the complex issues in rail operations [8]. Crashes at level crossings are not as frequent as normal road crashes but they are usually more severe and the fatality rate is higher [6]. This may be due to the potential mass difference between a train and a normal road vehicle. Crashes at level crossings cause fatalities and also economical loss by train delays and operational interruptions [9].In the USA, in 2006, more than 250,000 railway-roadway crossings were identified and they were catering to a broad spectrum of road and train traffic [6]. Suitable safety initiatives have been implemented at all these locations. In spite of the success of the recent safety initiatives, the US Federal Railroad Association (FRA), more than 30,000 collisions during the ten-year period from 1997 to 2006 were recorded [6]. In Australia, there are around 9,400 level crossings and out of these crossings, only 30% were equipped with active protection systems. Furthermore, 74 deaths during 1997 and 2002 due to collisions between trains and motor vehicles at railway-roadway level crossings were recorded, according to the Australian Transport Safety Bureau (ATSB) [10]. Considering Taiwan, from 2001 to 2005, 410 crashes occurred at around 630 railway-roadway level crossings which resulted in 125 fatalities and 153 injuries [3]. In 2002, 48 level crossing crashes had occurred in Iran and 12 of them were at active and 22 at passive level crossings [11]. In Sri Lanka, there are 1,061 level crossings out of which only 442 are recorded as protected with Active systems [1]. The numbers of crashes at railway-roadway level crossings in Sri Lanka have been increasing annually. In 2011, 2010, 2009, and 2008 numbers of crashes were 82, 75, 66, and 43 respectively [12].The installation of active systems is costly and therefore they are not installed in every crossing situated throughout the country. Places with a minimum of motor vehicles and train traffic are usually avoided due to the high cost of installation. The passive control level crossing upgrades are also not practical due to various challenges such as a high number of private and occupational crossings, the remote location nature of some crossings, the lack of power available on site, the difficulty to reach, and viable cost- benefit ratios for crossings with low road and rail traffic [13]. The identification of collision contributing factors and countermeasures at level crossings is very important due to the catastrophic nature of traffic crashes at railway-roadway crossings [6]. Since the crash severity at level crossing crashes is much higher than that of normal crashes, factors contributing to crashes should be analysed to improve the safety at unprotected level crossings. Thereby, it is possible to develop all level crossings accordingly and thus improve the safety at each level crossing, equipped with both active and passive safety precautions.
1.4. Objectives
The aim of this research was to identify factors that contribute to crashes at railway-roadway level crossings. The most hazardous level crossing in the Coastal railway line was also identified. This could lead into improving existing level crossings and modifying them accordingly which would increase the safety standards and thus reducing the chance of the occurrence of crashes at the level crossings. The study area of this project was limited from Pettah to Aluthgama along the coastal railway line. Figure 5 shows the railway line in the selected study area. The distance from Fort railway station to the Aluthgama railway station is 59.6 km. The coastal line is also referred to as the Southern line and it runs between Colombo Fort and Galle. The total line length is 157.88 km and 61.9km of line has a double track from Colombo Fort to Kalutara South and the remaining length is a single track from Kalutara South to Galle.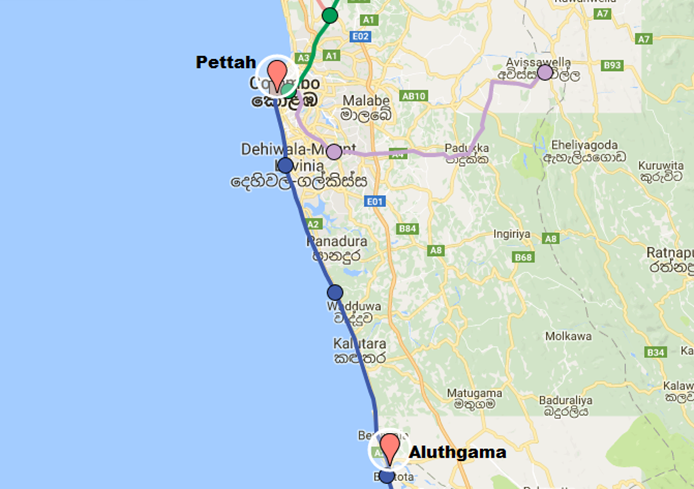 | Figure 5. The Existing Railway Line in the Study Area |
2. Literature Review
Gunathilake et al. studied the railway – roadway crossing safety by considering the southern coastal railway line in Sri Lanka, from Aluthgama to Ambalangoda [14]. At first, different railway-roadway crossings located on the southern coastal line were identified with the aid of a map. Then field surveys were used to gather data on each railway- roadway crossing situated on the specific line. Among the 51 crossings that were considered in the study about 94.1% of railway-roadway level crossings were facilitated with active safety measures. Among them, 62.7% of gates were established and maintained by the police and the other remaining 37.2% of gates were maintained by the SLR. It was found that the crossing at urban roadways was facilitated with permanent SLR gates, while 18.6% of rural roadways was facilitated with SLR permanent gates. Around 74.4% of remaining rural roadways was facilitated with GI gates which were arranged by the police with the aid of rural people. Furthermore, there were 7.0% of railway-roadway level crossings without gates and among them 33.3% of crossings were facilitated with passive safety measures and the remaining 66.7% of crossings were under an unsafe condition. All rural roadway gates were manually operated by a gate operator. The gathered data were useful in identifying the most dangerous and hazardous level crossings throughout the selected geographical area. Enhancements should be done to the active system, passive system, and additional safety precautions needed to be taken by the SLR and necessary improvements for the railway – roadway safety were also identified by this research.The identification of different factors that influence the severity of roadway vehicle occupants, of particular, drivers, involved in a vehicle-train collision at railway-roadway level crossings were studied [6]. An innovative latent segmentation based ordered logit model was used to evaluate the effects of various factors on the injury severity of vehicles drivers. In this model, the railway-roadway crossings were assigned probabilistically to different segments. It was based on their attributes and a separate injury severity component was defined for each segment. The model estimation results showed that the presence of active warning devices, presence of permanent structure near the crossing, and roadway type clearly highlighted the existence of risk segmentation within the affected level crossing. The key factors influencing injury severity were driver’s age, time of the accident, and presence of snow and/or rain, vehicle role in the crash and motorist action prior to the crash. The researchers’ main focus was to examine the influence of two sets of attributes namely, accident attributes and railway-roadway crossing attributes. Accident attributes considered include, driver demographics (including gender, age, vehicle occupancy), characteristics of the vehicle involved in the collision (vehicle type), environmental factors (weather, lighting conditions, time of day, etc.), and crash characteristics (role of vehicle in crash etc.). Crossing attributes considered include crossing characteristics (Annual traffic on the highway, railway traffic etc.), and crossing safety equipment (presence of gates, traffic signals, watchmen etc.). In the newly formulated model, the researchers partitioned railway-roadway crossings into segments based on their attributes. Then they estimated the influence of accident attributes on injury severity separately within each segment. Segment 1 was labeled as the “high risk” segment and segment 2 as the “low risk” segment. The segmentation component results highlighted important findings which were that the “low risk” crossing segment was characterized by higher number of trains, roadway classification of smaller roads, pavement markings for stop signs, absence of permanent structures obscuring the view, lower maximum posted train speed limits, and presence of gates and stop signs. For the high-risk segment, age, collisions during the time period 7PM to 6AM, vehicles struck by train, aggressive driver maneuvers and estimated train speeds at the time of the collision contributed to increasing the likelihood of severe injury. The researchers also identified that driving a van and presence of snow reduced the injury severity. The analyzed data contained that majority of the drivers were male (66.4%), under the age of 40 years (62.7%), and were primarily driving a sedan vehicle (72.7%). Furthermore, the researchers identified that majority of collisions occurred during fair weather (68.2%) and temperature (50.1%) conditions.According to Ishak et al., the railway-roadway level crossing crash is one of the major contributing factors of railway related fatalities in many countries [8]. The loss due to these crashes is very significant and contributes to a huge negative impact on the economy. Level crossing crashes are amongst the most complex issues in rail operations. Numerous efforts were made to develop methodologies and countermeasures to railway-roadway crossing safety problems. In rail safety engineering, factors associated with railway-roadway crossing crashes are human errors of both rail operators and others, engineering infrastructure, and crossing surrounding environment. Under this research, active railway crossings in South Australia were evaluated using Petri Nets which were believed to represent a better accident potential at a level crossing. As the proposed methodological framework, the design phases and the modeling steps were illustrated by stages according to the nature of the considered elements. Three phases, namely conceptual creation, performance validation, and model development were included in the modeling process considering basic elements of railway-roadway crossings as signal control, roadway characteristics, and railway characteristics. Railway-roadway crossings generally experience three phases of independent operation; the train approaching towards the crossing, opening the gate to the train, and stopping of traffic at crossings. The concurrent operation of tasks was needed to ensure that the train passes through crossing safely. The sub factors to be considered were focused on three major factors; engineering infrastructure, level crossing surrounding environment, and human factors. Three modeling techniques namely, Stochastic Petri Nets, Time Nets, and GIS were used in this study. Four models were developed while analyzing the obtained data. Model-1 considers the basic operations involving signal control, railway and roadway characteristics. Model-2 combines of Model-1 and traffic/ road characteristics. Model-3 combines Model-1 and railway/ train characteristics. Model-4 is the combination of Models-2 and -3. This final model defined the possible events which were undesired and desired. These events were represented by the markings of the respective Petri Nets places and transition process. TimeNET version 4 was used as the modelling software. The final phase was to incorporate the modelling output into Geographic Information Systems (GIS). It offered the spatial representation of a particular railway-roadway level crossing location in the case study area. The application of the GIS in spatial representation of the level crossings helped to link the model output with the visual background of the land surrounding the level crossing. This helps to further understand railway level crossing crash phenomena.Davey et al. studied the experiences of heavy vehicle drivers and train drivers at railway-roadway level crossings, with a view to explore the contributing factors toward crossing crashes [10]. The researchers have found that heavy vehicle-train collisions had the potential to be catastrophic in terms of fatalities, environmental disaster, delays in the rail network, and extensive damage to property. The surveys were conducted among a total of 17 train drivers and 26 heavy vehicle drivers. The survey included both design issues and behavioral issues. It was found that potential for a catastrophic event at level crossings such as a train derailment resulting from a heavy vehicle/train collision was of great concern. The collisions between heavy vehicles and trains were the most severe. Despite the low incidence rate of level crossing collisions, the potential loss in financial terms associated with a heavy vehicle/train collision, and the associated potential for delay in the commercial rail network was found to be large. Heavy vehicle drivers and train drivers were consulted by the researchers. The experiences of both the two groups were gathered to paint a more detailed picture of the circumstances and behaviors that may contribute to heavy vehicle accidents at level crossings. The researchers found that one of the main contributing factors to heavy vehicle crashes at level crossings were the size of the trucks involved. Heavy vehicle driver behavior was discovered to add to the danger at level crossings. Heavy vehicle drivers often exhibited dangerous behavior by attempting to avoid stopping at crossings while a train is approaching. The researchers identified that the improvement of level crossing safety was required to be done in two levels due to the complex conditions encountered at such locations. These levels were the environment level and driver level.
3. Methodology
The level crossings being investigated were identified from records obtained from the SLR. Field visits were conducted along the line considered and the required railway-roadway crossing characteristics were collected at each of the situated level crossings. A total of 77 level crossings was identified along the selected line. Furthermore, the level crossing crash data on these crossings for the last four years were collected from the SLR. The data required were identified as the characteristics of the railway- roadway level crossings, level crossing crash data and the Average Daily Traffic (ADT) data.
3.1. Railway-Roadway Level crossing Characteristics
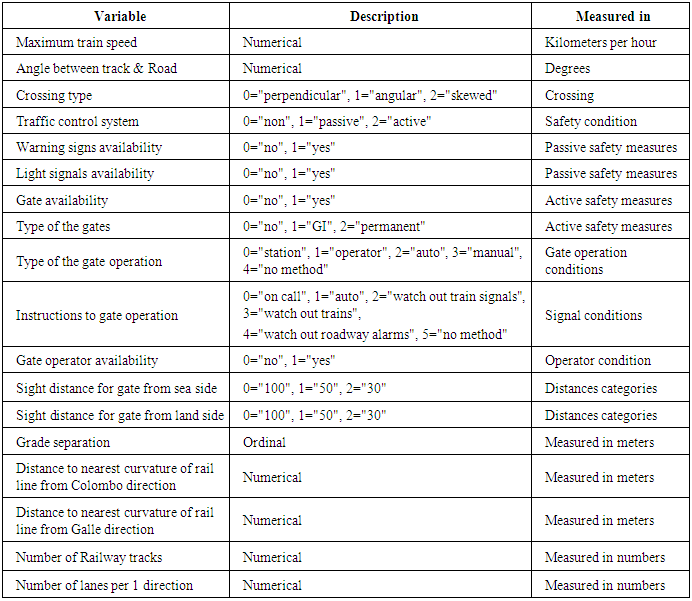
Different railway-roadway characteristics were recorded at each level crossing situated in the study area. The data obtained was summarized as follows. The level crossings equipped with an active traffic control system was 73% and 25% of level crossings had a passive traffic control system. The remaining 2% of level crossings had no traffic control system at all. Warning signs were found at 75% of all level crossings. A majority of level crossing did not have light signals. The light signal availability was found in 42% of level crossings whereas 58% did not have light signals. Gates were found in 75% of all level crossings situated along the respective route. About 32% of these gates were permanent gates and 43% were GI gates. About 52% of the level crossings had a gate operator whereas 48% did not have one. Around 27% of the level crossing gates were electrically operated by using a level or switch to open and close the level crossing. About 26% of level crossing gates were operated manually. This would require the gate operator to manually close the level crossing gate. Also, GI gates were operated manually. Only 4% of gates were remotely operated from a station. Around 32% of the gates received instructions to close the gate by a call. About 20% of the level crossing gates were closed by watching the train whereas 4% were closed by watching the signals. The gates which were closed by simply watching on the train and watching on signal were manually operated GI gates. Considering the sight distance from the sea side, 59% of level crossings had a good sight distance whereas 31% had a moderate sight distance. Only 10% of level crossings had a bad sight distance from the sea side. Considering the sight distance from the land-side 57% of level crossings had a good sight distance and only 16% had a bad sight distance. Around 27% of level crossings had a moderate sight distance from the land-side. Good sight distance was considered to have more than 100m to see the railway track [14]. Bad sight distance was considered if the sight distance was within the range of 100m and 50m [14]. Moderate sight distance stands between the good and the bad. A description of the considered railway-roadway characteristics in this study is shown in Table 1.All the railway-roadway level crossing characteristic data, crash data listed in Table 1 together with ADT data were used for the analysis. Table 1. Railway- Roadway Characteristics
 |
| |
|
3.2. Crash Data
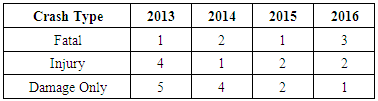
The crash data at level crossings in the selected route from Aluthgama to Pettah for the past four years (2013-2016) were collected from the SLR. Fatal, injured and property damage only crashes were considered for the analysis. The different types of crashes were converted into Equivalent Property Damage Only (EPDO) crashes by using factors obtained from the Road Development Authority (RDA), Sri Lanka. The injured crashes, fatal crashes and damage only crashes at a specific level crossing were multiplied from the factors 0.4, 1 and 0.5 respectively and summed up in order to obtain the EPDO value at a specific level crossing. The crash data for the previous four years are shown in Table 2. The crash data variation throughout the selected coastal railway line had significantly reduced after the year 2013 which may be due to the implementation of GI gates for the unprotected railway–roadway level crossings by the police [14].Table 2. Crash Data for Pettah-Aluthgama Rail Line from 2013 to 2016
 |
| |
|
3.3. ADT Count Data
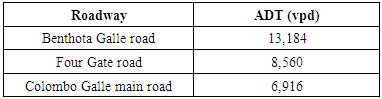
Traffic counts at each location were collected manually during the daytime through field visits. Traffic 15- minutes counts for a duration of two hours were obtained at each of the 77 level crossings situated along the railway line from Aluthgama to Pettah. All roadways were considered and classified vehicle counts were obtained which included bicycles, motorcycles, three wheelers, passenger cars, vans, cabs/small lorries, large buses, small buses, large lorries, multi axles and tractors. Passenger Car Unit (PCU) factors were used to convert the obtained classified vehicle counts to relevant passenger car values. The relevant PCU factors were obtained from the RDA. This two-hour count was multiplied by five to consider a day time period of 10 hours due to unavailability of the hourly expansion factors in Sri Lanka. This was used as the ADT for each of the roadways. The most congested roadways in the study area are shown in Table 3. The most congested roadway was Benthota Galle road and it consisted of an active traffic control system. The level crossing at Four Gate road was an angular level crossing equipped with a passive traffic control system. The Colombo Galle main road also consisted of an active traffic control system.Table 3. Most Congested Roadways
 |
| |
|
3.4. Linear Regression Analysis
Regression analysis was used to identify whether a set of predictor variables does a good job in predicting an outcome variable and also to check whether the variables are significant predictors of the dependent variable. Regression estimates are helpful in identifying the relationship between the dependent variable and one or more independent variables [15]. In this research, multiple linear regression was used to analyse how a certain selected set of independent variables had an effect on the dependent variable, crash data. The simplest form of the regression model with the dependent and independent variables is shown in Equation 1 [15]. 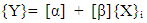 | (1) |
Where,Y = Estimated dependent variable scoreα = constantβ = Regression coefficientsX = Independent variablei = Number of independent variablesThe addition of more independent variables to a linear regression model will make it inefficient and model overfitting can occur [4]. Therefore, separate multiple linear regression analyses were done for the maximum of two selected independent variables at a time. The independent variables which were tested against crash data were, the distance to the nearest curvature of railway line from Colombo and Galle directions, sight distance to see railway track from seaside and land-side and the type of traffic control system at each level crossing. The sight distance to see the gate from the land-side and seaside was the minimum distance in which a road vehicle could identify the level crossing from both the sea and land sides. The distance to the nearest curvature of the railway track defined the distance from the level crossing where the railway track would be curved in both Colombo and Galle directions. The traffic control system considered the availability of active and passive protection in the level crossing.
4. Results and Discussion
Considering the crash data, the level crossing situated in Abrew road had the most number of crashes. The level crossings at Balikawa road and Bangalawatta road were also identified as crash prone locations with respect to the obtained crash data. The level crossing at Abrew road had a Passive traffic control system. Railway roadway level crossings are situated throughout Sri Lanka and only a very few are protected with active safety systems. Therefore, the safety at other passive level crossings is an important issue.A multiple linear regression analyse were performed to check how the distance to the nearest curvature of rail line from Colombo and Galle direction, sight distance to level crossing from seaside and land-side and the level crossing traffic control system affected the dependent variable, crash data. The effect of the distance to the nearest curvature from both Colombo and Galle directions (model-1), the effect of the sight distance from both the sea and land side (model-2) and the effect of the available traffic control system (model-3) against the crash occurrence are shown in Table 4. The distance to nearest curvature from Colombo direction and Galle direction has significant values of 0.929 (>0.05) and 0.729 (>0.05) which means they are not significant predictors of crash data. Since these variables do not have a significant effect on the dependent variable, the beta coefficients of them can be considered as zero. The sight distance from the seaside and the land-side had significant values of 0.037 (<0.05) and 0.023 (<0.05) which makes them significant predictors of crash data. Furthermore, it is clear that the sight distance from the seaside has a higher impact than the sight distance from the land-side by comparing the standardized coefficients obtained from the model. (beta = -0.292 versus beta = -0.321). The available traffic control system consisted of two main protection systems, namely active protection and passive protection. The availability of an active protection system had a significant value of 0.645 (> 0.05). The availability of a passive protection system had a significant value of 0.390 (> 0.05). Therefore, the available traffic control system was not a significant predictor of the occurrence of crashes at level crossings.Table 4. Regression Results
 |
| |
|
5. Conclusions
In this research, seventy-seven railway-roadway level crossings situated between Pettah and Aluthgama were analysed in order to find the relationship between crashes and contributing factors at such locations. Observational surveys were done to collect the data on railway- roadway level crossing characteristics and traffic counts. Traffic counts were done for a duration of two hours and this was converted into ADT. The crash data were collected from the SLR.The multiple linear regression analysis was done to compare whether certain independent variables were significant predictors of the dependent variable, crash data. The considered independent variables were the distance to nearest curvature from both Colombo and Galle directions, sight distance from sea side and land side and the traffic control system. The distance to the nearest curvature from Colombo direction and Galle direction had significant values of 0.929 (>0.05) and 0.729 (>0.05) which indicated that they were not significant predictors of crash data. The sight distance from the seaside and the land-side had significant values of 0.037 (<0.05) and 0.023 (<0.05) which makes them significant predictors of crash data. It was also noted that the sight distance from the seaside had a higher impact than the sight distance from the land-side. This was proved by comparing the standardized coefficients obtained from the model. The available traffic control system consisted of two main protection systems, namely active protection and passive protection. The availability of an active protection system had a significant value of 0.645 (> 0.05) and the availability of a passive protection system had a significant value of 0.390 (> 0.05). Therefore, the available traffic control system was also not a significant predictor of the occurrence of crashes at level crossings.From 2013 to 2016, the railway- roadway level crossing crashes had decreased for a selected area in the Southern Coastal line [14]. This may be due to the implementation of GI gates. A majority of level crossings was equipped with GI gates. Though the crash rate decreased due to the implementation of GI gates, it was evident that some gate operators were reluctant to perform their duties due to their low salary. Police maintained gates (GI gates) were not in an appropriate condition. A majority of GI gates were in a bad condition and some were broken and replaced with rope. All SLR maintained gates were maintained properly and the security at such locations was acceptable. SLR maintained level crossings were operated by individuals who got reliable information about the arrival of trains unlike the GI gate operators who would reply on train signals or themselves to close the gate. The mechanical barrier and electric barrier gates maintained by SLR were up to a good standard and constant maintenance was done to ensure that they work properly. As a conclusion, it is recommended that the standard of GI gates is also upgraded and proper funds should be utilized by the government in order to maximize the security at such locations.
6. Recommendations for Future Work
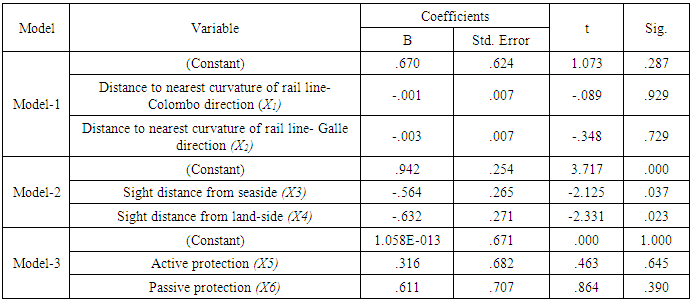
Due to time limitations, this research was only focused on the Coastal railway line from Pettah to Aluthgama in Sri Lanka. If more data were collected, a crash frequency model can be developed to predict the crash frequency at railway-roadway level crossings. This can be easily done by continuation of the study from Pettah to the end of the Coastal Line. Therefore, it is recommended to continue the study throughout the selected railway line.The ADT count data collection was done for only two hours at every level crossing. This small duration was done since there were seventy-seven level crossings and the time duration for data collection was insufficient. The ADT count was collected at different times at each crossing. Therefore, a larger duration such as eight hours is recommended for ADT data collection. This will provide a more accurate value for the existing traffic condition. According to the collected data, 43% of level crossings were equipped with GI gates. GI gates are operated manually and therefore this requires a gate operator to be present. Furthermore, the gate operator should be aware of the arrival time of trains on this track. Watching on train and watching the train signal are the only observation techniques used by the gate operators in order to close the gates. Some gate operators knew the exact arrival time of the train by experience and use this past experience to close the level crossing gate on time. During the field observations it was found that the pay received by a GI gate operator was a sum equivalent to 2 US Dollars per day. Interviewing the gate operators revealed the fact that most of them were complaining about their wages and this was keeping them less enthusiastic about this important job. It was observed that at some locations, the gate operators only partially closed the gate. Motorcyclists could easily go through the partially closed gate and this carelessness could lead into fatal crashes. Figure 6 shown below illustrates a partially closed GI gate situated in the study area. 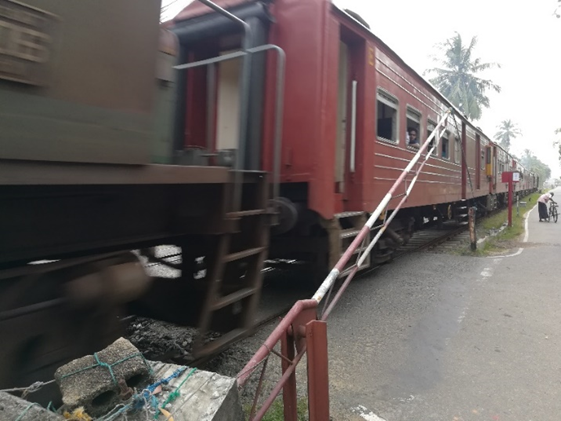 | Figure 6. Partially Closed GI Gate |
Furthermore, it was noted that though the gate operators closed the gates, some drivers would ask them to open it since the train was not in sight. These types of behaviours could cause fatal crashes especially in level crossings where the visibility of the train is not clear. The GI gate operators should be educated with proper safety programs in the dangers of performing such acts. A salary increase of even at least a small amount is also suggested since it would motivate the operators into doing their job properly since the presence of a careless gate operator who does not perform their job well is the same as not having one at all.The train maintains an average of around 72.2 Km/h speed in the Southern Coastal railway line [14]. Since the GI gate percentage was also the highest, this speed limit could cause fatal accidents if proper standards are not maintained at each level crossing. A large percentage of GI gate operators was elder men who would sit by the level crossing without a view of the train or train signal. Therefore, it is hard to rely on such gate operators to ensure the proper closure of the gate upon the arrival of a train. Furthermore, some GI gates had broken down and they had been replaced by rope and red cloths. The police may maintain such gates and SLR may also look into such locations and provide bell and light passive safety measures in such unsafe locations. This would also help the operator since he can make sure the time he needs to close the gate. It will also help to regulate the operator’s contribution for the reduction of fatalities at the railway –roadway level crossings [14].Figure 7 shows a GI gate which does not exist due to the lack of proper maintenance. The gate has been replaced by a rope and red cloth. Considering the sight distance from the seaside, 31% had a moderate sight distance and 10% of level crossings had a bad sight distance. Considering the sight distance from the land-side, 16% had a bad sight distance and 27% of level crossings had a moderate sight distance. Vehicle drivers are unable to suddenly control their speed while approaching a level crossing. Therefore, in such low sight visibility areas, pave rumble strips or asphalt bumpers on the road surface should be made in order to control the vehicle approaching speed. Since there are unprotected level crossings with bad sight distance, this step would help in giving the vehicle driver time to observe the level crossing before crossing it. | Figure 7. A GI Gate replaced with Rope and Red Cloth |
During the field observations, it was confirmed that the most of the warning signs and safety sign boards were fixed too close to the railway-roadway level crossing. This kind of placement affects the perception reaction time of the drivers and it contributes to the occurrence of a fatal crash at an unprotected level crossing with bad sight distance. For example, Figure 8 shows a low sight distance level crossing near Aluthgama with safety signs fixed too close to it.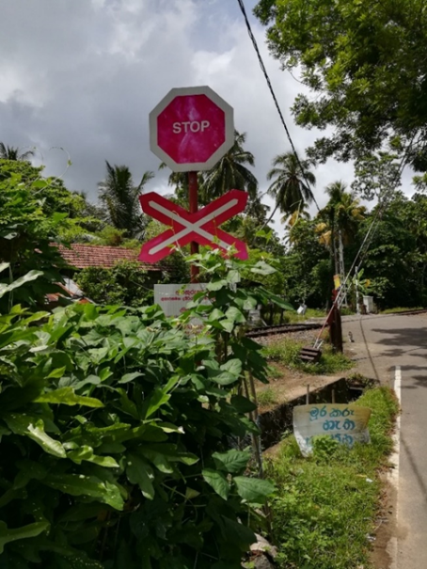 | Figure 8. Safety Signs fixed too close to the Level Crossing |
Though the level crossing in Figure 8 has GI gates, it does not have an operator thus making it an unprotected crash prone location. This type of situations should be avoided.
ACKNOWLEDGEMENTS
Our thanks go out to the SLR for providing data, Ragulan Kulasingham for his help, Palitha Sarukkali for sharing the statistical knowledge, Randhula Gunawardhana for proof reading, Jayantha Mendis for data collection, and SLIIT for the financial support.
References
| [1] | Railways, Sri Lanka., 2011, Sri Lanka Railways history. Available from: http://www.railway.gov.lk/. |
| [2] | Rail Industry Safety and Standards Board Australia, 2017, “What is a Railway level crossing?” Available from: https://www.rissb.com.au/safety/railway-level-crossings/what-is-a-railway-level-crossing/. |
| [3] | Barney, D., Haley, D. and Nikandros, G., 2001, Calculating Train Braking Distance. In Proc. Sixth Australian Workshop on Industrial Experience with Safety Critical Systems and Software (SCS 2001), Brisbane, Australia. CRPIT, 3. Lindsay, P., Ed. ACS. 23-30. |
| [4] | Sian Tey L., Ferreira L., 2010, “Driver compliance at level crossings”, Transportation Research Record 2298, pgs 70-79. |
| [5] | Settasuwacha, D., 2015, “A Review of Highway Railway Grade Crossing (HRGC) Safety Countermeasure “, Journal of Society for Transportation and Traffic Studies (JSTS), Vol.4, No.3, pg 30. |
| [6] | Eluru N., Bagheri M., Moreno K. F. M., Fu L., 2012, “A latent class modelling approach for identifying vehicle driver injury severity factors at highway-railway crossings”, American Society of Civil Engineers, vol. 1, pg 24. |
| [7] | Munidasa, K.G.H., 2009, “First train on line to Badulla from Colombo”, Sunday Observer, Available at: http://archives.sundayobserver.lk/2009/02/01/foc13.asp. |
| [8] | Ishak S.Z, Yue W.L and Somenahalli S.V.C, 2011, “The methodology development of railway level crossing safety systems-South Australia case study”, Computers in Railways XI, pg. 629. |
| [9] | Bongkwan C. and Jaeil J., 2010, “A Study on Intelligent Railway Level Crossing System for Accident Prevention”, IJR International Journal of Railway, Vol. 3, No.3, pp. 106-112. |
| [10] | Davey J., Wallace A., Stenson N., 2008, “The experiences and perceptions of heavy vehicle drivers and terrain drivers of dangers at railway level crossings”, Accident Analysis and Prevention 40(3): pp. 1217 – 1222. |
| [11] | Zaker, J.A., Sadeghi, A.A., 2012, “Evaluation of Safety Improvement in Iranian Railway Level Crossings,” Journal of Safety Engineering, 1(1), pp.1-6. |
| [12] | Mudugama, M., 2012, Mishaps at Unprotected Level Crossings Increase, The Island, Colombo. |
| [13] | Larue, Gregoire S. and Wullems, C., 2015, “Driving simulator evaluation of the failure of an audio in-vehicle warning for railway level crossings”, Urban Rail Transit, 1(3), pp. 139-148. |
| [14] | Amarasignha N., Gunathilake O.H.D.C., Ragulan K., Aravinda M.P.N., Fernando W.S.H.R. “Characteristics of Railway-Roadway Level Crossings at Coastal Railway Line in Sri Lanka”, KDU International Research Conference, 03-4 Aug. 2017, Colombo, Sri Lanka. |
| [15] | Garson G.D., 2016, Logistic Regression: Binary & Multinomial, 2016 Edition: Statistical Associates Blue Book Series. |

 Abstract
 Reference
 Full-Text PDF
 Full-text HTML