A. T. M. Abir1, MD Mostafizur Rahman1, Farjana Islam1, Raisa Bashar2, Sirajul Islam1
1Department of Civil and Environmental Engineering (DCEE), North South University, Bangladesh
2Department of Environmental Science and Management (ESM), North South University, Bangladesh
Correspondence to: A. T. M. Abir, Department of Civil and Environmental Engineering (DCEE), North South University, Bangladesh.
| Email: |  |
Copyright © 2018 The Author(s). Published by Scientific & Academic Publishing.
This work is licensed under the Creative Commons Attribution International License (CC BY).
http://creativecommons.org/licenses/by/4.0/

Abstract
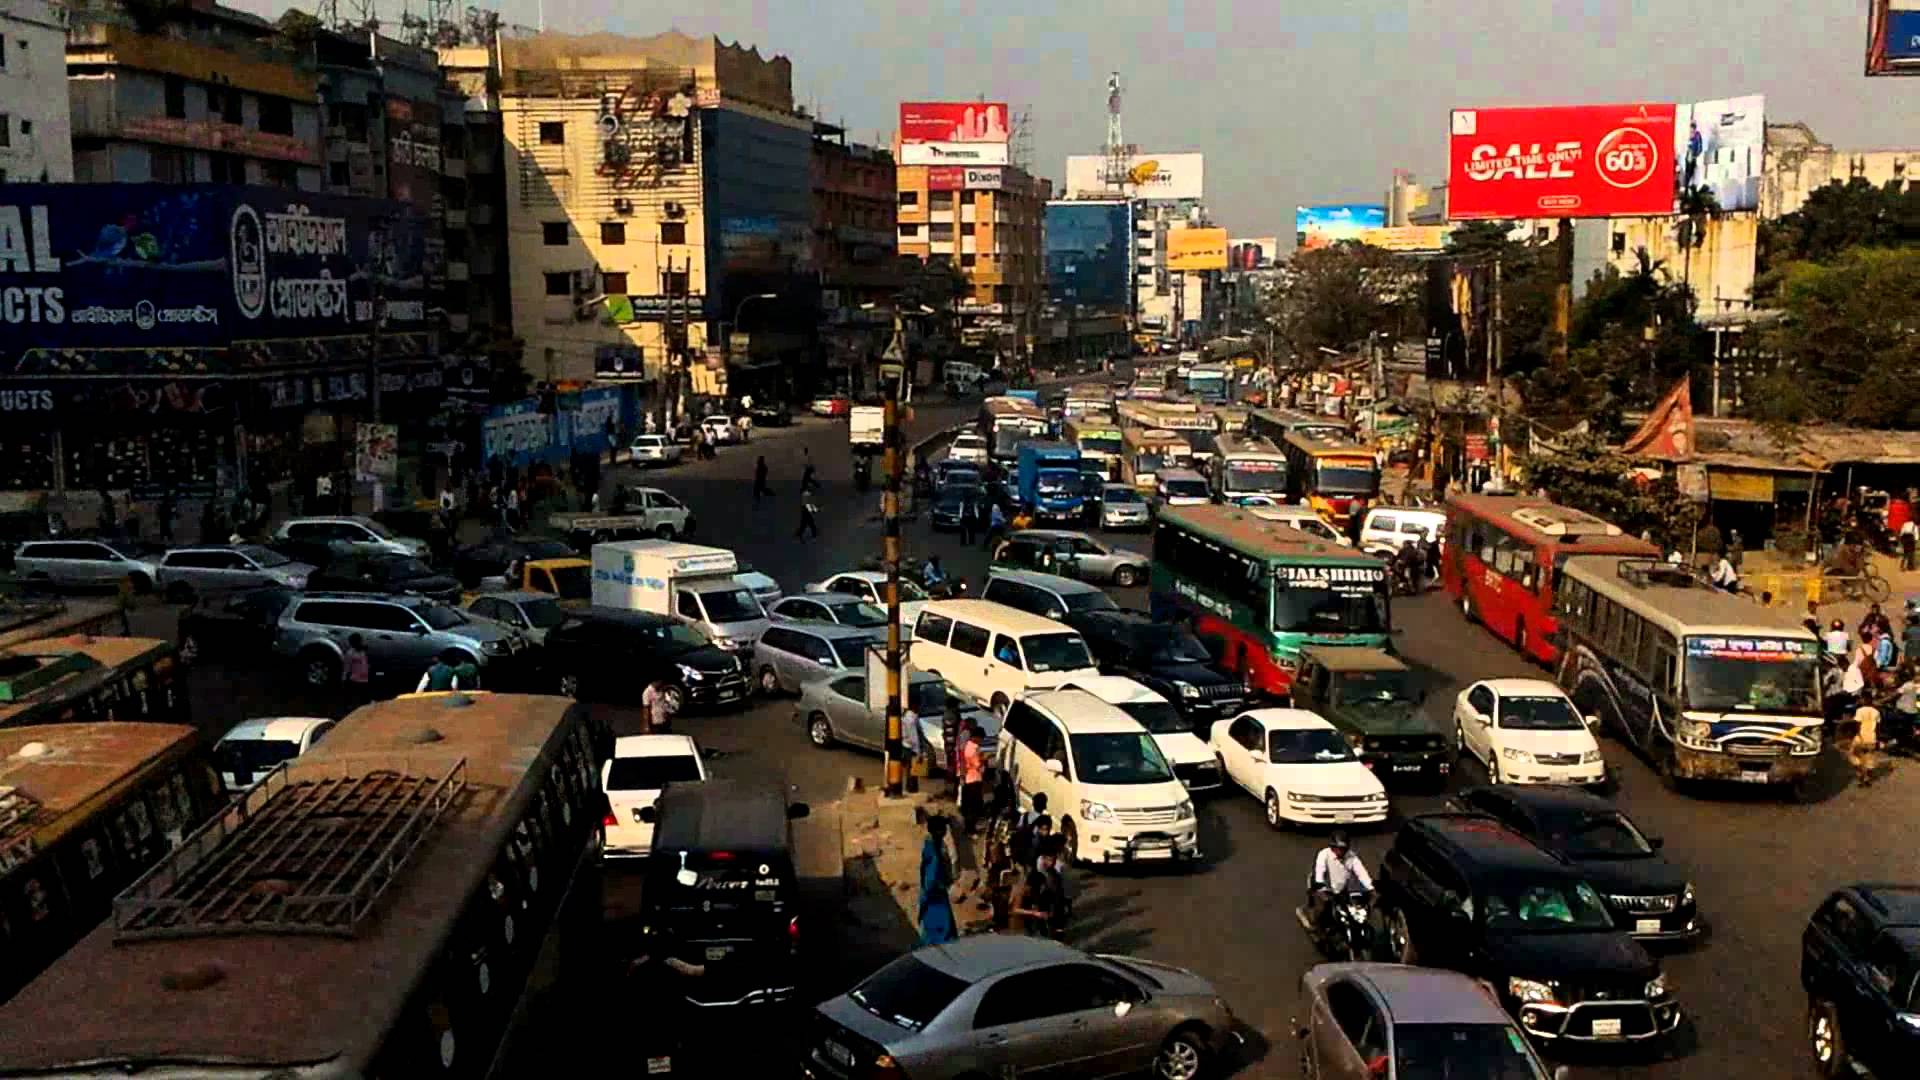
For a country of millions, traffic congestion significantly reduces the economic productivity. This statement holds true for most urban areas of the world, especially Dhaka, the mega-city of Bangladesh. An area of Dhaka which has a lot of potential in terms of both as a residential and commercial region, is undoubtedly the suburb of Uttara. Along with being adjacent to the airport on one side and having a link to industrial areas like Gazipur and Savar on the other, it also has residential amenities in its numerous blocks, making it a colony for traffic congestion. Unfortunately, no sustainable solution has come about to successfully reduce this problem. Hence, this paper tries to understand where the problems lie from the perspectives of the most important stakeholders – the residents and commuters of the area. It supports the use of their simple thinking to reach solutions through suasive instruments, like training and awareness-building campaigns, instead of spending millions on building lengths of roads and investing in technology. A survey of 150 bus passengers and 150 private car owners, coupled with literature review were conducted to accumulate, identify and address the traffic congestion reasons and associated issues. These problems were later used to propose recommendations. Responses revealed that the satisfaction levels of the commuters fell mostly under the ‘dissatisfied’ category (78%), based on parameters like fitness of the bus and driver, behavior of drivers and conductors, etc. Unsurprisingly, most respondents showed interest to pay an extra bit of fare for better bus service and believed that these would greatly help to mitigate the issue of running this sector with ‘unskilled’ and ‘unprofessional’ drivers/conductors (92%). Additionally, the large presence of private cars seemed to cause higher amounts of traffic congestion, but 56% of these users believed that the public buses had poor service and hence, their decision to avoid it as a regular commuting option. Hence, it was clear from the responses and their analysis that only a reliable, comfortable, and safe bus service system (including good drivers, conductors and buses themselves) is what will encourage more people to travel in public buses, leaving behind their private cars. This would in turn, greatly reduce the traffic congestion problem as people will be able/want to follow the traffic regulations better.
Keywords:
Buses, Public Transport, Sustainable Solutions, Traffic Congestion, Uttara
Cite this paper: A. T. M. Abir, MD Mostafizur Rahman, Farjana Islam, Raisa Bashar, Sirajul Islam, User Response – based Sustainable Solutions to Traffic Congestion Problem Using Public Transport: The Case of Uttara, Dhaka, International Journal of Traffic and Transportation Engineering, Vol. 7 No. 2, 2018, pp. 32-41. doi: 10.5923/j.ijtte.20180702.03.
1. Introduction
Dhaka is one of the biggest and fastest developing urban areas of the world. Its metropolitan populace has developed exponentially to around 18 million today (RSTP, 2015). Dhaka has also moved toward becoming the world's most swarmed mega-city, with twofold (or more) the population density of other urban communities of the world including Tokyo, London and Shanghai. This huge population is the biggest contributor of traffic congestion in this mega-city, along with several others. A current World Bank study demonstrates that Dhaka's normal movement speed has dropped from 21km/h to 7km/h over the most recent 10 years, marginally over the normal strolling speed. Furthermore, movement gridlock eats up 3.2 million work hours for every day. Another examination led by the Copenhagen Consensus Center says that the speed in Dhaka is presently 6.4km/h, and that if vehicle development proceeds at its present pace, without significant public transport the normal speed may tumble to 4.7km/h by 2035 (Mamun, 2017). Lowering speeds will lead to huge losses in productive hours of the day and night, which in turn will eat away from the economy. Even though Dhaka represents only 1% of the country’s total area, it contributes to over 36% to the GDP and creates 44% of the country’s total employment (Mamun, 2017). Unfortunately, the lack of importance given to the public transportation sector is one of the major reasons why the public avoids travelling in buses. This, in turn, results in too many private vehicles jamming up the main roads (and in many cases the side roads and alleys) and causing losses in millions due to productive time lost stuck on the roads.
1.1. Background and Rationale
The Uttara area of Dhaka city is a suburb which is up and coming, has a huge population and has faced the resultant congestion on roads due to more people opting for private modes of transportation. This is mostly because of the lack of security in the public transportation, the harsh behavior of the staff, the lack of fitness of the buses and several other associated issues. What is important to note is that Uttara (Figure 1.1) is one of the prime areas of Dhaka city as it is adjacent to several important landmarks of the capital like the international airport, airport railway station and various important commercially areas like Savar, Gazipur and Ashulia. It is also home to over 179,000 residents (Ahmed, 2004) who have children going to schools, parents going to work and relevant facilities like hospitals, malls and so on.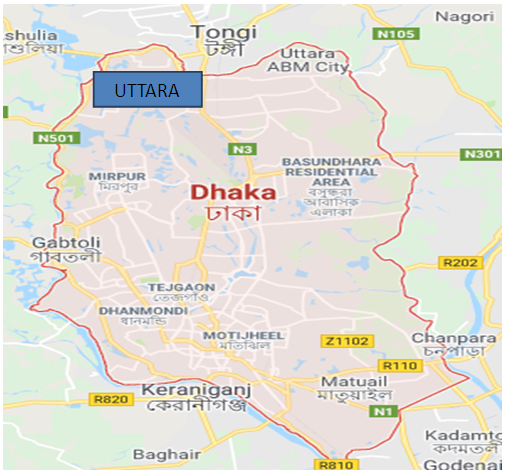 | Figure 1.1. Location of Uttara in Dhaka city (Source: Google Images) |
This area and its roads, therefore, needs to be free from the heavy traffic congestion it faces today so that the public’s movement becomes easier and more productive. What’s more fascinating to note is that this area being newer than its other counterparts in the Northern Thana of Dhaka, has faced several experimentations by the government to try to reach sustainable solutions to the congestion issue, but without fruit. However, there is still time to improve the planning as its roads are still just being built and it is not as busy as its other older counterparts further South. Hence, the researchers decided to focus on this area and its residents to find out simple, yet sustainable solutions to the traffic congestion issue, without spending a lot of money, which seems to be the only way according to the actions of the policy makers of the urban regions of Bangladesh.Moreover, Uttara is one of the last areas that one passes through while going out of the city of Dhaka on the North. It is arranged by RAJUK (Rajdhani Unnayon Kattripakkhi – the capital city development authority of the country) and separated into 14 sectors (Ahmed, 2004). Most of the residents are service holders. The major amount of the people in these areas are middle-income, with a few low-income families living in the surrounding low-income housing and a few rich residents who usually have large houses and own more than one private cars. It is also one of those few areas in Dhaka city that has the positive combination of at-hand regular facilities, affordable housing and good security. Hence, every day more and more people are migrating to this area from the city-center where housing is more expensive and schools and hospitals are further away. From recent studies and observations, it seems that Uttara, despite being so many miles away from the center, is also suffering from similar forms of traffic congestion. This is mostly because of the huge number of private vehicles running in this area and inadequate and unsatisfactory bus service systems in the locality.Most of the traffic congestions is not found within the sectors, but at the access points to Uttara which are also the shared roads to access other points like the Dhaka-Mymensingh highway or the airport. A few such areas/roadways, namely the Jashimuddin traffic signal, Airport traffic signal and Housebuilding traffic signal were therefore chosen as the study areas for this research (Figure 1.2). Photos (1 – 4) of this congestion are available in the Appendix.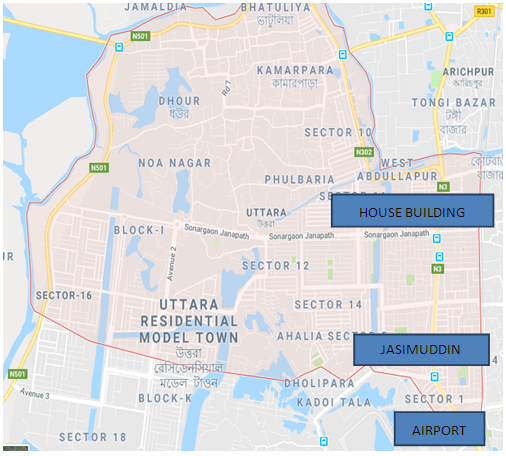 | Figure 1.2. Locations of the selected areas in Uttara (Source: Google Images) |
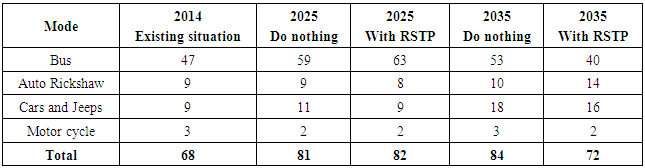
Transport administrations accessible in Dhaka city’s Uttara could be ordered in two gatherings: counter transport benefit and neighborhood transport benefit. Counter transport benefit has determined stoppages for boarding and landing of travelers and the tickets are sold at the counter of those stoppages. For such transports, travelers need to buy their tickets from the transport counters just before loading up into transport. A little number of counter transports are aerated and cooled. Conversely, neighborhood transport benefit has no predefined stoppage (they can stop at anyplace in transit for boarding and landing travelers) and travelers pay the reasonable price to the transport conductor in the wake of boarding. Transports of the two kinds frequently remain vigorously packed, generally, due to a gap between demand and supply. In any case, there are a couple of seating administration transports working in certain constrained courses which permit boarding travelers only if there is a vacant seat accessible for the individual. These transports likewise board and land travelers at the predefined stops (at times enable travelers to land at whichever place the traveler needs to), and the travelers need to pay for their tickets inside the transport. Only six seats in each transport are saved for the female travelers and as of yet no such arrangement is there for handicapped individuals or senior nationals (Rahman, 2009).Over the years, there have been many suggestions and solutions for the traffic congestion problem in this area including the building new roads, flyovers, u loops, metro rail, BRTA system and so on. However, what is being ignored is the fact that these are short-term traffic solutions. In fact, many-a-times, the construction and implementation of these projects contribute to the problem itself that is being discussed.In a part of the RSTP Interim Report (2015), shown in Table 1.1, it can easily be seen that the largest chunk of the mode of transportation is and will be taken up by buses (among all the public transportation that was focused on by the research) till 2025. Even adding up all the private vehicles does not match the share of buses: 47% vs. 21% in 2014 which will go up to 63 vs. 19 in 2025 (with RSTP). Hence, the focus should not only be in pushing people towards travelling public, but to improve this sector’s buses as well. It is important to notice that by 2035, however, the share will go down for buses and move up for cars and jeeps, but the public sector will still dominate.Table 1.1. Vehicular modal shares (in percentage) predicted by Revised Strategic Transport Plan
 |
| |
|
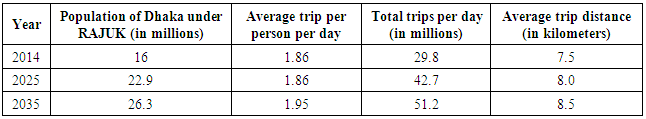
The situation is going to get worse if Table 1.2 (RSTP, 2015) is to be believed. Even though, according to RAJUK, the population growth will see a deceleration (16 – 26.3 million) in the next twenty years, the average number of trips (1.86 – 1.95), total trips and (29.8 – 51.2 million) and average distance travelled (7.5 – 8.5 kilometers) will all increase by 2035. This portrays the fact that the number of vehicles will also be on the rise. Since Bangladesh’s road areas are already under strain and cannot be increased by very much, the only way out would be to introduce more efficient public transportation systems – buses on the roads, coupled with fast moving city trains (Mamun, 2017).Table 1.2. Predicted future travel demand in Dhaka
 |
| |
|
Hence, this research was initiated in an attempt to identify the problems in the public transportation sector due to which Uttara public (residents and commuters) are not using the public transportation, namely the buses (which is the focus for this research). It is expected that providing a more desirable transport system and simultaneously using awareness programs and trainings among the commuters and bus drivers/conductors, respectively, is the ‘easy way out’ and will provide the most cost-effective and sustainable solution.
2. Literature Review
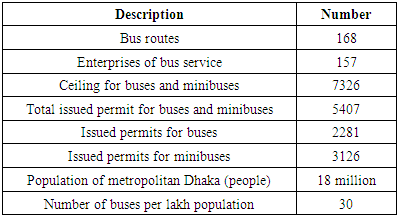
Traffic congestion is not a new or unique issue for Dhaka. The dawn of the first congestions served as an indication of the growing economy of the country for many. Hence, a review of the relevant literature is needed to better grasp the issue of congestion, its status and the attempts to solve and to enrich this research further and address the gaps. This section focuses on the analysis of secondary information available on the difference between the public and private transportation sectors and the statuses of transportation across the world, in mega-cities and in cities of developing countries. Bangladesh’s traffic congestion scenario has also been reviewed, focusing on Uttara’s previous successes and failures with reduced traffic congestion initiatives, along with a summary of the findings at the end. Unsurprisingly, the transport demand in most major cities around the world can only be met with a high-quality public transport system. The reliance on buses is, therefore, high in both developed and developing countries. Furthermore, most metropolitan territories are endeavoring to give more motivating forces to nationals to leave the private auto at home and utilize the nearby travel frameworks. Public transport is frequently seen to be a poor commuting option and the opposite holds true for their private counterparts. In this research public transportation are those that are state-owned, have lower fares and are accessible by all (in this research’s case – buses), while private transports are those that are individually-owned and maintained and inaccessible to the public (Gakenheimer, 1995). Private auto use has developed quickly amid the most recent decades. Around 75 million to around 675 million mechanized vehicles were developed in the during the time period of 1950 to 1990. Around 80% of these vehicles were essentially utilized for individual transportation, i.e., autos and motorcycles and the measure of traveler kilometers by private auto per capita expanded by 90% (from 4,620 to 8,710 kilometers) in Western Europe in the vicinity of 1970 and 1990 (Hossain, 2006). The expanding private vehicle use has produced different ecological, social and financial issues. Natural issues concern the outflows of lethal and unsafe substances, which, in addition to other things, add to a dangerous atmospheric deviation, brown haze and corrosive precipitation. On the social level it undermines the urban personal satisfaction since it is uproarious, causes nasal irritation, neighborhood air contamination and results in accidents during movement. The economic issues of private transport are identified with the diminished openness of monetarily vital goals. For instance, blockage in European urban communities is evaluated to cost 100 billion euros for each year and is anticipated to increase twofold in the following decade (Hossain, 2006).In the developed nations, urban communities and their associated districts had a very large response time to react to the difficulties postured by the far-reaching utilization of private vehicles and expanded dependence on trucking for transporting cargo. In numerous urban areas a proportional development is happening over just a single or two decades. In Bangkok, for instance, engine vehicle enlistments have expanded at the rate of 12% a year for as far back as 10 years, while in China, one of the world's minimum mechanized countries, the development rate of engine vehicles has surpassed 18% for every year since 1985 (Gakenheimer, 1995). In Asian urban areas, for example, Shanghai and Calcutta, the coordination of work, habitation, and trade in the urban center is high. Developing nation urban areas usually have significantly less space distributed to streets than was valid for western urban communities amid their underlying period of mechanization. In Chinese urban communities, the measure of land dedicated to street space is frequently under 10%, while even in 1910, when New York City was at its most dense as far as populace per hectare, streets contained completely 15% of the urban land region in Manhattan (Jackson, 1984). Mega-cities of the developing countries have a constraint on the amount of public revenue that can be used because of several central public needs that need to be met. Along with transportation, water and sanitation administrations, broadcast communications, and power supply are issues of importance as well. In most developing urban areas, interest for shared transportation (both mechanized and non-motorized) has developed significantly more quickly than the populace and has greatly exceeded the revenue growth that can be used for developing transportation. (Armstrong-Wright, 1993). Moreover, roughly 40% of midtown inhabitants in New York's Manhattan stroll to work and more than 90% of business laborers utilize public transport to go to London's monetary center point (Mamun, 2017), which shows the increased reliance of the developed world’s mega-city residents on public transport, unlike the developing ones. In contrast, travel designs are more intricate in Shanghai and Mexico City, like in Bangladesh’s Dhaka, which is a reason that their reliance on the public-sector transportation is lower than in other parts of the world. In spite of the fact that Mexico City depends on a solid metro framework, just 14% of the city's populace utilizes it: minibus administrations are the most commonly used public transport. Public transportation in Shanghai is quickly developing as well, but in the initial staged, with 24% of people attending work daily utilizing some type of open transportation– rail, metro, or transport (Mamun, 2017).The transportation arrangement of Dhaka city is transcendently street-based. Despite the fact that there is a constrained utilization of conduits along the stream of Buriganga, inside the metropolitan territory, the rail and water transport is relatively missing as a city’s open transport. The city has no mass travel framework like metro rail or transport quick travel (BRT) frameworks. Be that as it may, the administration is wanting to have BRT frameworks in three noteworthy hallways and metro rail in one passage. As in other Asian urban areas, the larger part of excursions in Dhaka are served on open transport and non-mechanized transport modes (NMT) or para-travels on the grounds that a large amount of individuals are poor and cannot manage individual vehicles. As the charge of NMT (for example, rickshaws) or other para-travels are costlier than the public transport charges (Rahman, 2009), a large portion of the general population are greatly reliant on open transport for their movement (Hossain, 2006). Strengthening this fact, the RSTP (2015) expressed that the modular offer of excursions on open transport in Dhaka is around 44%. Transport administrations are assuming the overwhelming part in giving open transport offices of the city. Notwithstanding, the quantity of travelers in broad daylight transport has been expanding ceaselessly amid the most recent 20 years (Karim & Mannan, 2008). The transport armadas working in Dhaka, are for the most part standard transports and mini-buses. As indicated by the key transport design (RSTP, 2015), it is evaluated that there are around 7,100 transports in Dhaka. Among this large number, only 1,300 of them are currently in use, of which under 200 are of enhanced quality. Although the Bangladesh Road Transport Corporation (BRTC) gives transport benefits in a few courses, the private transportation sector is still overwhelming popular, constituting over 95% of the aggregate open transport, and regularly act like a syndicate giving monopolistic administration (Rahman, 2009). Furthermore, because of the absence of legitimate arranging, administration and upkeep, the transport benefits in Dhaka is under unsuitable circumstances (Olsson & Thynell, 2004). Dhaka, being a city with less auto possession rate and poor economy, needs financially savvy open transport frameworks and administrations. Subsequently, transport administration ought to be the spine of transportation for the city. Different reports (Rahman, 2009; Karim and Mannan, 2008; Haque, 2000) revealed that the present transport administrations are wasteful, ineffective and what is more, hazardous, because of long hold-up time, delay on implementation, over-burdening, uneasiness, long commuting distance between the habitation/work place to transport stoppages and so on.The different attempts all over Dhaka city to reduce the congestion issue on roads due to an onslaught of private vehicle have involved several costly measures like setting up flyovers and better traffic signaling systems. However, it was failed to understand that these measures would only work if the users are aware and civilized enough to follow the rules and regulations of the road and opt for public transportation for a lot of their travels. Neither holds true today for the country. Currently, there are only 30 buses on average per hundred thousand passengers which is a poor picture as shown in Appendix Table 1 (RSTP, 2015). Several measures were also taken in Uttara to reduce traffic jam like the introduction of good quality air-conditioned buses and seating service buses such as Omama Paribahan and Falgun Paribahan. However these could not reduce the traffic jam, because the bus service introduced were inadequate and the ticket prices were too high (especially for the air-conditioned buses). As a result, those bus services were complete rejected by the public from all income levels.
3. Methodology
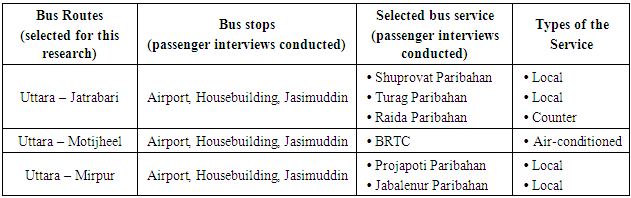
As covering the entirety of Uttara region or all the transport courses and administrators of the city were not possible due to time and asset limitations, only three noteworthy transport courses, specifically Uttara-Jatrabari, Uttara-Motijheel, Uttara-Mirpur courses, had been decided for this research. These courses were the busiest from all and represented a large portion of the travelers’ commuting to/from Uttara zones (i.e. the focal territory and the fringe, the arranged and spontaneous region, and the higher-salary and lower-pay private areas). Additionally, as the sample size is not very big, the results achieved lacks high levels of accuracy. However it is does attempt to represent the real scenario due to the intended diversity in gender, ages, occupation, income levels, commuting distance, time and purpose. All the real transport specialist co-ops working in the chosen courses were considered for this examination. While choosing the transport suppliers of a particular course, both the counter administration (and seating administration) and neighborhood benefits were considered to have the entire picture of existing transport administrations of the city.Different types of buses were selected in Uttara which traveled to different routes and survey of the passengers were conducted to get their views on the buses they travel in. Buses which travel to Jatrabari, Motijheel and Mirpur were selected and interviews of their passengers were conducted. The questionnaire used for both the travelers of buses and private transportation were divided into three parts to find out the demographic information of the respondents, their perspectives on the different aspects of public buses which affects their satisfaction and lastly, their proposals on simple solutions to the problem. The third part’s analysis was summarized in the next section and it was supplemented by the information extracted from the dialogs and authors’ observation as well. Different types of buses such as local, counter, air conditioned ensured a variety in the research sample as represented in details in Table 3.1.Table 3.1. Selected bus route and the operators for interviewing passengers
 |
| |
|
Dialogs with the transport administrators (i.e. worker at the counters, transport conductors, transport drivers) was done to know the recurrence of administrations and in addition, to identify the different issues and associated reasons. A total of 150 travelers (50 from each course specified previously) were arbitrarily chosen and met with a foreordained organized poll at various transport stoppages; the poll was conducted after a (unbiased) briefing was given to the respondents. The poll secured the responses to investigate the respondents’ experiences and fulfillment levels of the present transport travel, their general assumptions about transport administrations and perspectives on how to improve the bus services to reduce the existent congestion.Furthermore, 150 private car owners were interviewed and their views regarding this issue were taken. The meetings of transport travelers were directed on ordinary bright week-days in October 2017 for the primary stage and after that again in November 2017 for the second stage; the overview time was in the vicinity of 08:00 and 18:00 hours of the day. While conducting the traveler interviews, once in a while, the questioner went onto the transport alongside the respondents to finish the meeting: each questioning took 15-18 minutes.After all the interviews and dialog sessions were taken the data were analyzed using graphical and tabular representations to find out the relationships and understand the responses. Secondary analysis by reviewing existent relevant short and long articles was done to address the literature gap and plan ways to use the research at hand to bridge them.
4. Results and Discussion
The research was based on a survey taken amongst 300 daily travelers, out of which 150 respondents were bus users and 150 were private car users. The survey results have been divided accordingly.
4.1. Bus Users
Among the bus users, 52% of the respondents were regular bus users while 20% did not use the bus regularly. 20% of the respondents had stated that they travel via bus sometimes and only 8% of the respondents had stated that they used the bus often. These responses showed that most of the respondents are regular traveler of public buses. The passengers were asked about their satisfaction with the current bus fare, upon which the majority, i.e., 58% of the respondents, responded negatively and expressed their dissatisfaction, while 42% were satisfied (Figure 4.1).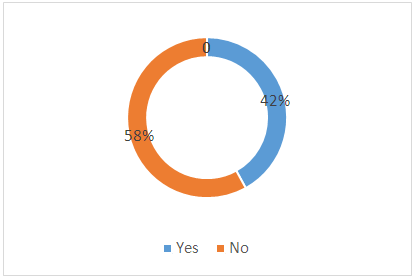 | Figure 4.1. Satisfaction with the bus fare |
When asked about their opinion on the physical condition of the buses, 82% of the respondents said that they think the condition of the buses are poor while 10 percent think it is satisfactory and 8% think it is moderate (Figure 4.2). Upon being asked about seating, 68% of the respondents said that they find seats available in the bus while travelling and 32% of them said they find buses to be over crowded. These responses revealed that most of the passengers do not get seats while travelling. The bus passengers were further asked about the satisfaction level regarding the behavior of the bus staffs. 78% of the respondents, i.e., the majority, responded as being dissatisfied with their behavior, while 22% said that they are satisfied with the behavior. Thus, it can be concluded that most of the respondents are dissatisfied with the present bus service system.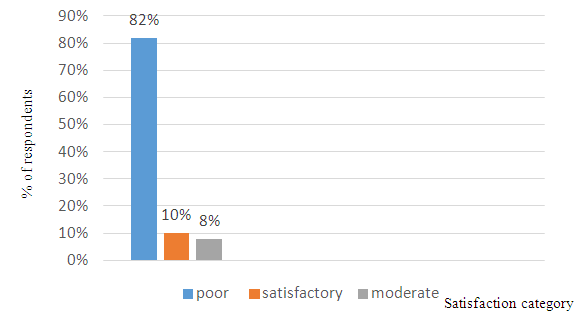 | Figure 4.2. Physical condition of buses |
The bus passengers were also asked if they would like to pay an extra bit of fare for better bus service and 92% of the respondents said they were willing to do so while 8% of them said they are not (Figure 4.3). In addition, they were asked about the amount of extra fare they were ready to pay for better bus services. 52% of the respondents said that they would like to pay 7-10 Taka, 22% responded with 2-5 Taka, 14% with 5-7 Taka and 12% with 0-2 Tk. According to this, most bus passengers want good bus service and money is not an issue. Lastly, the bus passengers were asked if they had any intention to buy private cars in the future. 64% of them responded positively while 36% said they had no such intention. The respondents who answered positively were then asked why they intended to buy private cars in the future and the 54% of the respondents intended to do so for greater comfort, 26% for privacy, 16% due to poor bus service and 4% planned on buying a car as a personal luxury.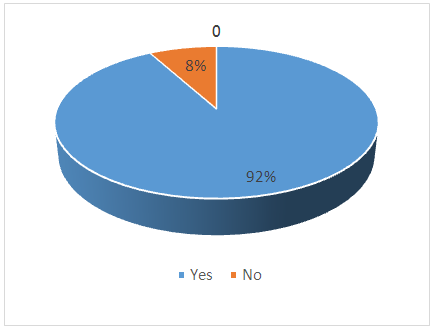 | Figure 4.3. Willingness to pay extra for bus services |
4.2. Private Car Users
When asked about the number of private cars the users owned, 52% answered that they had 1 private car, 20% answered two private cars, 4% answered 3 cars and 6% said that they had more than 3 cars. The respondents with more than one car were further asked why they needed more than one car and in response 34% said they needed more cars for family members, 24% said it was a luxury and 10% said they needed it for their work.Upon being asked about why the car using respondents didn’t use the public bus, 71% said due to poor service, 17% said they feel uncomfortable, 8% responded saying they do not like buses and 2% felt there’s no privacy in bus (Figure 4.4). This response reveals that private car owners also avoid public buses due to its very poor service. The car users were also asked about what kind of bus services they needed, if they were to travel in a bus. The options provided were proper pickup drop service, comfortable seats and air conditioning. 54% of the respondents said they need all these services. 26% responded saying they need only proper pickup drop service, 12% need comfortable seats whereas a mere 8% said they need air condition only. When asked about how much the car users are willing to pay for their desired bus services, 74% said they would pay 5-7 Taka at max for it, followed by 16% of them wanting to pay 7-10 Taka for it, 4% of them saying at max they can give 2-5 Taka while only 6% said they will pay at max 0-2 Taka for it. 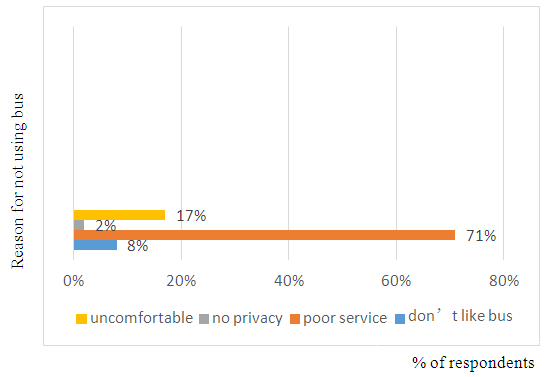 | Figure 4.4. Reasons for not using the bus |
The car users were further asked if they knew that cars cause more air pollution in the streets, upon which air pollution 94% said they knew while only 6% said they didn’t know about this fact before. When asked if they are aware of the waste of natural resources by private cars, 92% said that they are aware of it whereas only 8% said they are not. This revealed that most of the car user respondents were aware of the environmental problems caused due to the GHG emission from too many cars on streets. Lastly, the car users were asked if they would travel by bus instead of their private car if the desired bus services were provided. 88% of the respondents responded saying that they are willing to do so whereas 12% said that even if such services were provided, they would not stop travelling by their cars.The results from the questionnaire therefore concluded that the bus passengers, as well as car users are not happy with the bus service system and they want a more reliable, comfortable bus service system in the area so that they can have a better travelling experience.
5. Findings and Recommendations
From literature review it is evident that the developed nations’ mega-cities like New York and Tokyo (Gakenheimer, 1995; Haque, 2000; Ahmed, 2004; Hossain, 2006) also face huge amounts of traffic congestions and so it is not solely a problem for developing countries. However, as Bangladesh’s Uttara is still not as full of residents and activities compared to the mega-cities of the other countries as well as other areas of Dhaka, this place can be used to experiment on in order to find out whether the simple, sustainable solutions based on only user responses are feasible and long-term or not.The primary data analysis states that most people do not travel by buses because they are either dissatisfied with the bus services or the buses themselves. The bus drivers not following traffic rules contribute highly to the congestion too, and the low quality of buses further make them slower and a slow burden on the roads. The easiest solutions to these according to the respondents include trainings for the drivers and conductors, banning the introduction of unfit buses and introducing fit buses instead. Also, establishment of stricter boarding and landing laws, waiting areas, bus lanes and an income-based bus charge (higher for air-conditioned ones and lower for the others) are good, easy and cost-effective solutions that the government can apply for Uttara.Other recommendations include: subsidizing the public transport sector more so that bus owners can provide good service in reasonable fare, color coding buses so that people who are not very educated can easily identify the route a bus is travelling to/from, introduction of double decker buses, encouraging carpooling, making schools, offices and commercial institutes introduce their own bus service, enforcing a law to allow private cars on the roads for certain intervals of the day especially and not 24/7.
6. Conclusions
A good reliable, comfortable, and safe bus service system should be provided to the people of Uttara. Without providing people with a good bus service, we cannot encourage them to travel in public buses, leaving behind their private cars. Keeping this area traffic free is necessary as the airport and the railway station is in this area. People coming from abroad will have a very negative point of view regarding our country when they see unbearable traffic jam in such areas. This is the first area they see when they visit Bangladesh, which is why it is necessary for us to keep this area traffic free. The suggestions provided are very basic, but ones that are often ignored due to their simplicity. Policy makers and implementers instead, tend to think of high-cost, grand solutions that provide only temporary solutions. Hence, this paper’s main motive was to highlight these solutions, as no matter how many new things the city officials construct to decrease traffic jam, unless the public transport sector is utilized efficiently by the public, traffic congestion is here to stay.
ACKNOWLEDGEMENTS
The authors would like to thank North South University’s Department of Civil and Environmental Engineering (DCEE) and Department of Environmental Science and Management (ESM) officers and staff for supporting them to conduct the research. Gratitude also towards all the respondents who took the time to help fill out the research, Special thanks to those who participated in the dialog session to further enrich this research.
Appendix
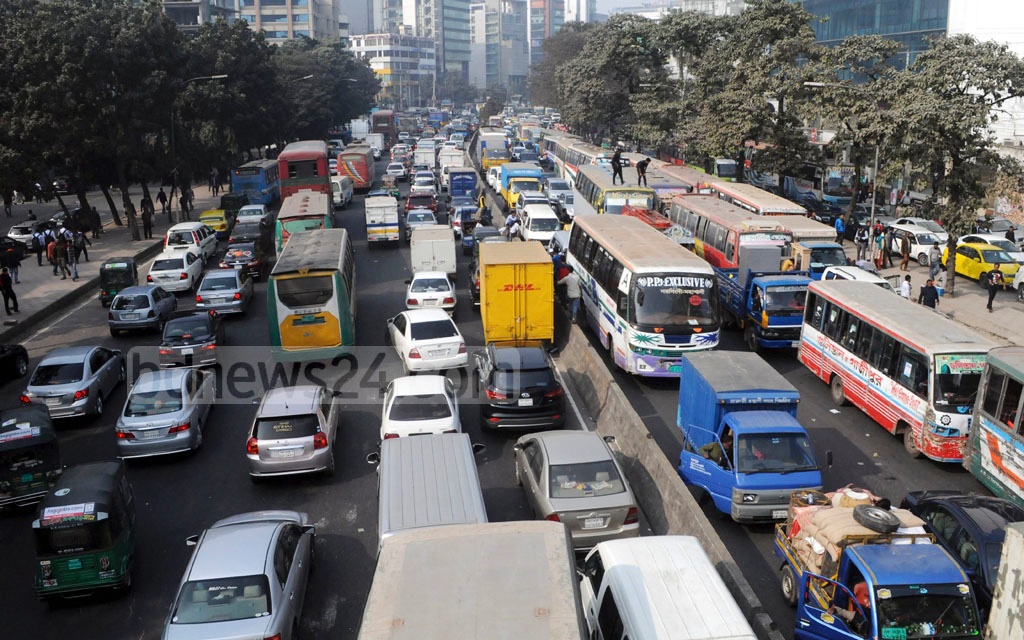 | Photo 1. Jhashimuddin road traffic congestion during the afternoon (source: BDNews24) |
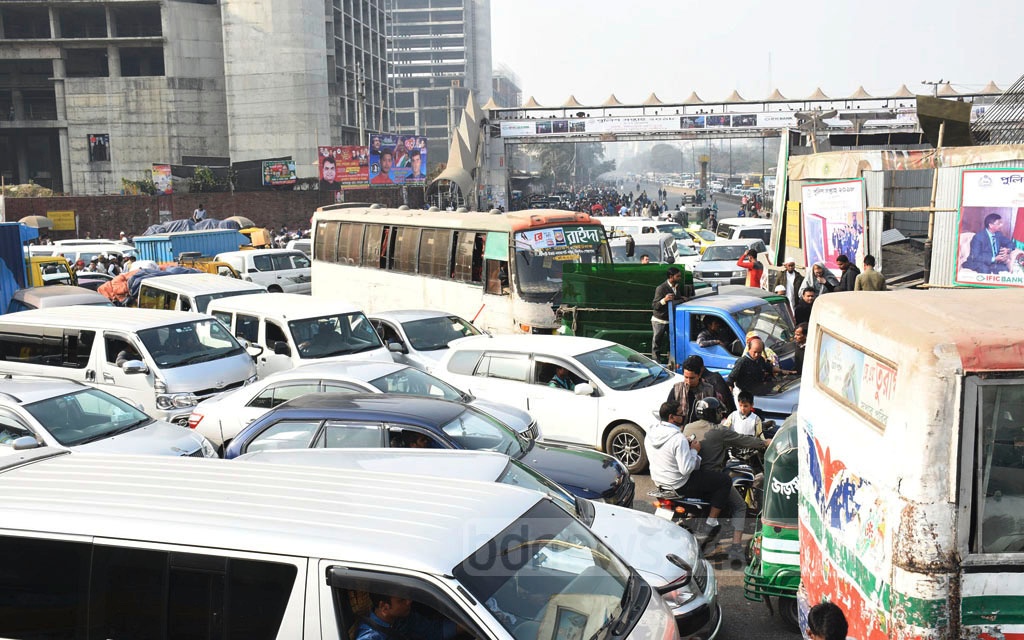 | Photo 2. Airport road traffic congestion during the morning of a weekday (source: BDNEWS24) |
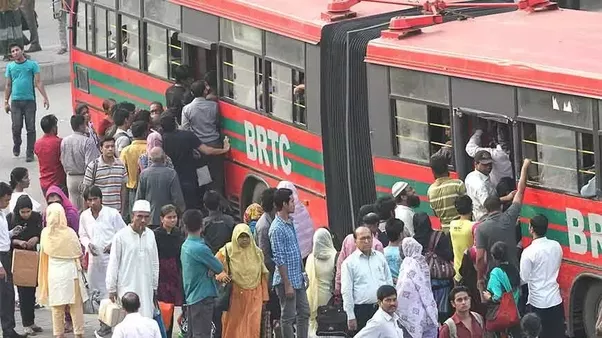 | Photo 3. Poor passenger pick up and drop at Uttara on a busy weekday (source: Quora) |
 | Photo 4. Poor traffic signal following at House Building signal of Uttara during a weekday evening (source: own archives) |
Appendix Table 1. Details of buses in Dhaka city (source: RSTP, 2015)
 |
| |
|
References
| [1] | Ahmed, S. (2004). A study of the performance of bus transport services in some selected routes of Dhaka City. Master's Thesis, Bangladesh University of Engineering and Technology, Department of Urban and Regional Planning. |
| [2] | Armstrong-Wright, A. (1993). Public Transport in Third World Cities. London, United Kingdom: HMSO Publications. |
| [3] | Gakenheimer, R. (1995). Motorization in China. Unpublished Manuscript, Massachusetts Institute of Technology, Cambridge, MA. |
| [4] | Haque, M. (2000). Road Planning and Engineering for Promoting Pedestrian Safety in Bangladesh. 10th REAAA Conference,. Tokyo. |
| [5] | Hossain, M. (2006). The issues and realities of BRT planning initiatives in developing Asian cities. Journal of Public Transportation, 69- 87. |
| [6] | Jackson, K. (1984). The Capital of Capitalism: the New York Metropolitan Region, 1890-1940. In A. Sutcliffe (Ed.), Metropolis 1890-1940 (pp. 319-354). Chicago, IL: University of Chicago Press. |
| [7] | Karim, M., & Mannan, M. (2008). Mass Transit Demand in Dhaka Metropolitan and Review of Alternative. Retrieved from http://www.eng-consult.com/envart/mass.html. |
| [8] | Louis Berger Group; Bangladesh Consultant Ltd. (2005). Strategic Transport Plan for Dhaka. Government of the People's Republic of Bangladesh, Dhaka Transport Coordination Board. |
| [9] | Mamun, S. (2017, August 22). What Dhaka’s transport system might be like in 2019. Dhaka Tribune. Retrieved from https://www.dhakatribune.com/bangladesh/dhaka/2017/08/22/dhakas-transport-system-might-like-2019/. |
| [10] | Olsson, L., & Thynell, M. (2004). Bangladesh road transport corporation (BRTC) bus project in Dhaka city. Sida, Department for Infrastructure and Economic Cooperation. Stockholm: Swedish International Development Cooperation Agency. |
| [11] | Rahman, M. S. (2009). Fuel consumption of transport sector: how the people of Dhaka city will be movingin the future? ECEEE 2009 Summer Study proceedings: Act! Innovate! Deliver! Reducing energy demand sustainably, (pp. 1409-1415). doi:978-91-633-4454-1. |
| [12] | RSTP (2015). Revised Strategic Transport Plan for Dhaka. |

 Abstract
 Reference
 Full-Text PDF
 Full-text HTML