-
Paper Information
- Next Paper
- Paper Submission
-
Journal Information
- About This Journal
- Editorial Board
- Current Issue
- Archive
- Author Guidelines
- Contact Us
International Journal of Traffic and Transportation Engineering
p-ISSN: 2325-0062 e-ISSN: 2325-0070
2018; 7(2): 28-31
doi:10.5923/j.ijtte.20180702.02

Accuracy of Crash Data for Wet Pavement Crash Analysis
 Abstract
 Reference
 Full-Text PDF
 Full-text HTML
Mohammad Shojaeshafiei1, Mehrnaz Doustmohammadi2, Michael Anderson2
1Department of Computer Science, University of Alabama in Huntsville, Huntsville, USA
2Department of Environmental and Civil Engineering, University of Alabama in Huntsville, Huntsville, USA
Correspondence to: Mohammad Shojaeshafiei, Department of Computer Science, University of Alabama in Huntsville, Huntsville, USA.
| Email: |  |
Copyright © 2018 The Author(s). Published by Scientific & Academic Publishing.
This work is licensed under the Creative Commons Attribution International License (CC BY).
http://creativecommons.org/licenses/by/4.0/

The impact of rainfall and wet pavement has the potential to influence the number of traffic crashes along a roadway as the reduction in pavement friction and visibility potentially lead to a greater number of crashes. To study this impact, researchers have used traffic crash records with reported roadway conditions to determine if there is a relationship between the rainfall event and the number of traffic crashes. This paper examines the accuracy of the reported roadway condition related to the presence of rainfall using a crash database and rainfall records from gauges throughout the state of Alabama. The results of this study indicate that there is a high likelihood, or almost 12 percent of the crashes in the database, where the pavement condition will be reported as wet when there is no rainfall occurring in the area and when there was not a report of rainfall in the recent timeframe. This high percentage of incorrect values might influence the results of statistical studies intended to evaluate the influence of rainfall on crashes.
Keywords: Accuracy, Validity, Crash, Pavement, Rainfall, Safety
Cite this paper: Mohammad Shojaeshafiei, Mehrnaz Doustmohammadi, Michael Anderson, Accuracy of Crash Data for Wet Pavement Crash Analysis, International Journal of Traffic and Transportation Engineering, Vol. 7 No. 2, 2018, pp. 28-31. doi: 10.5923/j.ijtte.20180702.02.
1. Introduction
- Traffic safety studies have been conducted related to the impact of rainfall on traffic crashes to determine if there is a relationship between rainfall and an increase in traffic crashes [1-4]. Statistical models have been developed by several researchers to attempt to understand the complex problem associated with modeling crashes during wet pavement, or rainfall events, with varying degree of success using various level of severity as the response variable and different independent variables as a means to predict the response [6-10]. Studies have focused on different roadway characteristics, rutting, friction and cracking, as well as operational characteristics of traffic volume and free-flow speed [11-22]. Obviously, the validity of traffic report on crash data evaluation plays a crucial role to lead us to have a more precise understanding of the impact of not only the rainfall but the intensity of rainfall on crash. Because when we are considering the influence of rainfall on crashes, it comes up with some other components such as the distance object detection, illumination level of area and raindrop size itself [23]. Moreover, the same rainfall condition at the time may cause a different reaction by different drivers, which usually cause to traffic jam especially if it happen with the inadequate winter maintenance [24, 25].However, with all the analysis on the relationship between rainfall and crashes that has been done in the past, there remains the difficulty associated with validation of the models that were developed. A paper by Lord and Mannering provides a comprehensive review of crash modeling methodologies and issues associated with the difficulty of modeling crashes, from under- and over- dispersion of the data, temporal and spatial issues, sample size limitations, reporting issues, and general errors on the data [26]. Overall, the ability to model wet pavement crashes relies on the use of crash reports that were generated on-site at the crash location and quality of the models developed are based solely on the accuracy of the officer reports as to the actual pavement condition, lightening condition or rainfall, during the time of the crash. Usually the investigator officer generates the police report to the request of call from the crash site for the consideration and assistance. Police report consist of facts (e.g. date and time), and opinions (e.g. weather condition and fault determination). In many situations, examining crash reports completed in the field often have questionable or missing data, especially for the opinion parts. This is not uncommon as the reports are collected in hectic environments with a combination of high speed passing traffic, potentially low visibility, inclement weather conditions, and drivers and passengers who might need medical attention or are shaken up, as a minimum. However, it is these crash reports that form the basis of crash analysis statistics and studies as these data records are the only source of information available about the crashes. This paper attempts to examine the validity of crash records for use in determining if there is a limitation in the data that is being used to support the analysis for determining differences in crashes and severity of crashes that occur on wet pavement versus crashes that occur when the pavement is dry. The benefit of this analysis is to validate the use of crash record data for modeling purposes, by using weather station data, to obtain an accurate determination of the pavement condition by examining if there was rain falling at nearby weather stations during the time when a record of a crash was made to test the validity of the traffic report. This paper presents a study of crashes from Alabama located near weather stations and a complex matching procedure to determine of the actual weather condition supported the recorded pavement condition on the crash report. The results of the study indicate that the crash reports are often likely to conclude that the pavement was wet when there is no evidence of rainfall in the area.
2. Data
- The analysis is performed using two datasets; the first data set is crash data from the Critical Analysis Reporting Environment (CARE) database maintained by the Center for Advance Public Safety at the University of Alabama. The CARE data contains crash report data collected by the responding officer for all roadway crashes in Alabama from 2010 through 2014. The data provides location of the crash as well as factors associated with the crash and the environment of the crash, i.e., the pavement condition (wet or dry) that will be used to determine if the presence of water on the roadway had an influence on the crash.
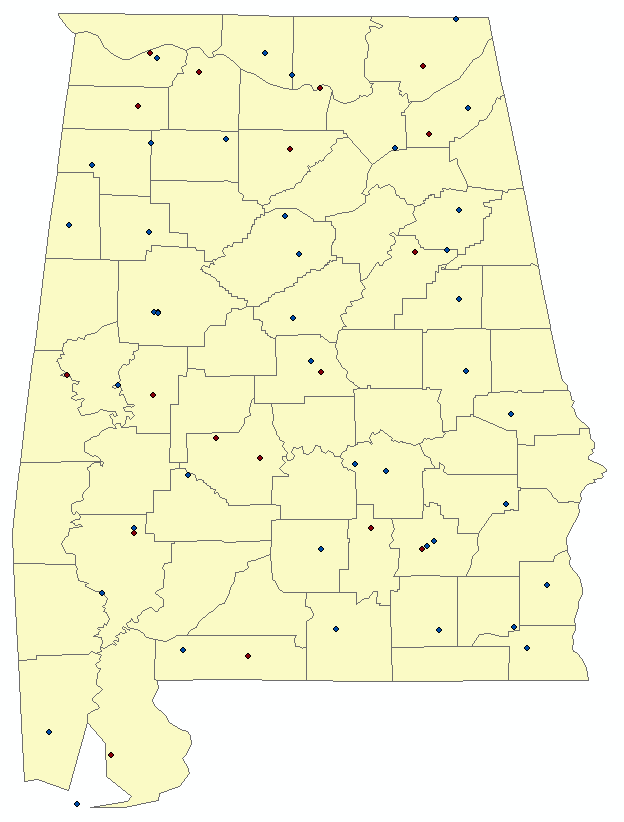 | Figure 1. Location of Rainfall Stations in Alabama |
3. Methodology
- The methodology for pairing the crashes and rainfall was performed in using a combination of Excel and ArcGIS. The initial step was to collect the rainfall data for each of the 59-gauge stations in Alabama. The rainfall data was stored in an Excel table containing Date, Time and Rainfall in millimeters for every hour of the day, with a different worksheet used for each station to avoid confusion. Next, the appropriate crash data records, which were spatially located in ArcGIS, were selected and extracted to database files that could be used in Excel. The crash records selected were only those that were within 2 miles of the rainfall gauge locations. This distance was selected to allow for the inclusion of enough crashes to make the analysis credible, but not so great that a significant amount of error might occur due to the difference in rainfall distribution, i.e., the situation where the rainfall is much localized. As the crash records exported contained the date and time of the crash along with an indication of the pavement condition, wet or dry, it was possible to match the rainfall data for each gauge with the crash records near each gauge using the data and time. Some issues that were encountered during the analysis were hours of the day where multiple crashes occurred near a rainfall gauge, essentially a many-to-one match analysis. The match scenario needed to be flexible to account for this situation. Additionally, the crash data record sometimes included a value of “other” for pavement condition, indicating there was no way to determine if the pavement was wet or dry as recorded by the officer. The data that were coded as “other” were not included in the analysis as these would not be used in any statistical study.
4. Data Analysis
- The data that were matched in Excel were grouped into four specific categories: 1. Road condition reported in the crash data as Wet when the rainfall is greater than zero.2. Road condition reported in the crash data as Dry when the rainfall is zero.3. Road condition reported in the crash data as Wet when the rainfall is zero.4. Road condition reported in the crash data as Dry when the rainfall is greater than zero.The first two categories indicate a correct assessment of the rainfall and crash. The second two are situations where an incorrect assessment was made as to the pavement condition at the time of the crash. For the data collected and reviewed in this study, Table 1 presents the results of the data classification.
|
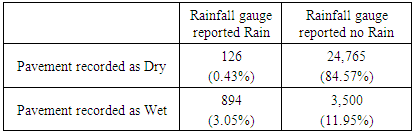
5. Conclusions
- This paper examined the recorded presence of rainfall on crash data records that are often used for statistical studies to determine the impact of rainfall on traffic crashes. A procedure was developed that matched traffic crashes and reported rainfall from NOAA weather collection gauges to determine if there was indeed rainfall in the vicinity of the crash at the time of the crash. While almost 88 percent of the time, the traffic officer reporting the details of the crash was correct in the assessment of the pavement condition and rainfall in the area; almost 12 percent of traffic crashes were incorrectly recorded as wet pavement when there was no evidence that any rainfall was present in the local area. These incorrectly reported crashes have a high degree of concern as these crashes would be entered into the category of wet pavement or rainfall event crashes that would be used in statistical analysis and modeling. From the data collected, there were almost four times the numbers of wet pavement crashes incorrectly reported as there were actual wet pavement crashes. This result indicated that using the reported crash database without validation of the rainfall might lead to inaccurate analyses.Many researchers have mentioned issues on modeling and validation of crash predictions. The issue mentioned and identified in this paper can be an answer to this problem. The future of automotive vehicle technology and advanced camera systems for these vehicles might allow for more accurate data collection efforts in the future [27]. Data collection of crashes is completed by officers who may not be trained for how to fill the crash report forms or who are completing the forms under such adverse conditions that the accuracy the data entered may suffer do to extraneous circumstances. It is very necessary and important for researchers to have access to accurate data to be able to predict the number of crashes correctly and hopefully reduce the number of crashes by identifying the impact of many variable contributing.