Hamid Athab Al-Jameel
Civil Engineering Dep., University of Kufa, Iraq
Correspondence to: Hamid Athab Al-Jameel, Civil Engineering Dep., University of Kufa, Iraq.
| Email: |  |
Copyright © 2018 The Author(s). Published by Scientific & Academic Publishing.
This work is licensed under the Creative Commons Attribution International License (CC BY).
http://creativecommons.org/licenses/by/4.0/

Abstract
Recently, simulation models have widely used across the world in terms of evaluation the performance of different traffic facilities, such as normal sections, intersections, roundabout, etc., the economic evaluation and safety evaluation. To examine the accuracy and versatility of micro simulation programmes such as S-Paramics when modelling highways is by calibrating and then validating the model against real life data taken from loop detectors. In this study, a merging section has been modelled using S-Paramics. Then, this modelled section was calibrated and validated by real data taken from loop detectors located in the merging area in the Manchester city. According to the statistical tests, the results of calibration and validation show acceptable behaviour between the simulation model and the reality. However, the graphical representation indicates that the S-Paramics could be replaced by developing specific simulation model to get more accurate behaviour for merging section.
Keywords:
Merging section, Calibration, Validation, Simulation, S-paramics
Cite this paper: Hamid Athab Al-Jameel, Calibration and Validation of Micro-simulation (S-Paramics) Model for Merging Sections, International Journal of Traffic and Transportation Engineering, Vol. 7 No. 2, 2018, pp. 19-27. doi: 10.5923/j.ijtte.20180702.01.
1. Introduction
Across the world the demand on the road networks is gradually increasing meaning that highway capacity is being pushed putting a strain on the country’s infrastructure. A functional and successful transport network is the key to a countries economic growth; however with any growth in the economy there is a direct effect on the demand on the transport network [1].Merging could be defined as combing two or more traffic streams travelling in the same direction. Merging area is recognized as the most congested section along the motorway [2]. Several researchers have studied the merging section and used the simulation model to deal with the management of this area [3].Recently, simulation models have been increasingly utilized into managing, controlling and evaluating traffic problems such as congestion. Kotsialos and Papageorgiou [4] reported that simulation models could be adopted for traffic process to estimate, predict and control related tasks for the analysis everyday traffic management and applying different design strategies without committing a lot of expensive resources [5]. Different simulation models have dealt with the merging and weaving sections such as VISSIM, ALIMSUN and PARAMICS [6]. However, these models still represent the reality to a certain value of accuracy. This attributes to ignore some important interactions between merge and motorway traffic. For example, no cooperative (decelerating) behavior is offered by the motorway drivers and priority to the motorway traffic is given by these models. Whereas this behavior is not observed from real data [7]. Different studies proved that S-Paramics could represent various traffic cases such as weaving, merging, work zone as reported by Al-Jameel [6], Alterawi [8] and Nassrullah [9]. Therefore, this study has been used S-Paramics that allows the user to model and test road networks simply and quickly. The model allows the user to either build a model from scratch or overlay a plan of an existing model and modify from within the software. With a defined model that is accurate in terms of layout and dimensions it is then possible to modify the setup by altering factors such as the flow of traffic, road restrictions such as speed, behaviour of the drivers such as aggressiveness and the ratio of vehicle types. Another plus with S-Paramics is the simplicity of which data can be extracted and analysed from the model. The ‘Data Analysis Tool’, a programme within S-Paramics, takes the results and figures from a run of the model and quickly and clearly displays them in most statistical graphics such as graphs and charts for easy analysis. The programme also offers a thorough economic assessment of the systems being modelled and will provide statistics on cost and environmental impact.It would be easy to assume when using the S-Paramics software that the coverage is so comprehensive that it realistically represents real life. However, when used as a comparison system it must first be calibrated to match current real data before it can be used to accurately predict any change. In this study the primary data will be taken from the M62-J11 and the model will be closely dimensioned on this junction. The calibration will be looking to match the flow of the traffic on the motorway and the effects of the merging traffic with relation to the speed, flow and capacity of the motorway.
2. Data Collection
The collection of raw data from major road networks can be a long and laborious process especially when it comes to determining driver behaviour. Currently the best method for viewing driver behaviour involves travelling to locations deemed suitable for analysis and filming the traffic for a number of hours [6]. Usually 4-5 hours is deemed a suitable amount of time to get a sufficient representation of the traffic behaviour. This process requires a lot of hours and can be quite tedious but it is currently the best way of attaining information on drivers’ behaviour when it comes to merging, weaving and overtaking.For this study the data that will be used to calibrate the S-Paramics model will be taken from a chosen location using data gathered from loop detectors by “Motorway Incident Detection and Automatic Signalling, (MIDAS)” data. This data is gathered every minute from loop detectors across the highway network and then sorted so as to be easily analysed and interpreted. The data collected covers speed, flow, vehicle type, occupancy and headway for each lane of the motorway. The data can then be simply extracted to an ‘Excel’ spread sheet where useful relationships such as Flow-Speed and Flow-Occupancy can be graphically represented for analysis.
2.1. Data Analysis
With the MIDAS data you have access to a map of the major road networks of the UK and located on this map are all the loop detectors that are in use on these roads. From this map one can select a location that is of interest and view the detectors that are placed on this location. Each detector is labelled based on its position on the motorway. Using this label the data recorded from the loop detector can easily be located from the MIDAS database. The loops gather information every one minute but for this study the data will be gathered into five minute intervals representing total flow and the average speed and vehicle type over the three lanes of carriageway and over the on ramp at the junction. The data is gathered from three loops, one upstream from the ramp, one downstream from the ramp and one located on the ramp. Data taken from a second upstream detector can be used to attain values of flow entering the location to be analysed. These values of flow can then be entered into S-Paramics as an initial value for calibrating the model.
3. Modelling with S-Paramics
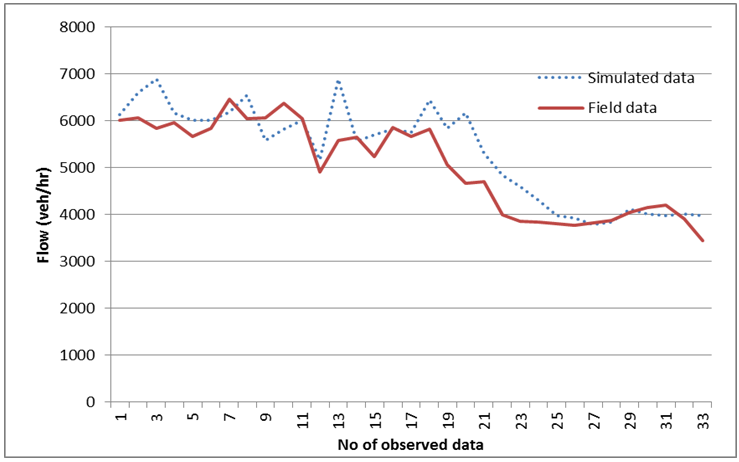
In order to establish whether traffic micro-simulations can accurately be used to model traffic flow it is first necessary to calibrate a model against real data. The simulation for this study was modelled on the M62-J11. Firstly, it is necessary to draw an accurate version of the junction with accurate placements of loops detectors. The model was drawn from scratch using measurements taken from satellite imagery (i.e. Google Earth). The position of the loop detectors was taken from the “MIDAS Maps” utility. Once the junction was complete the values of flow were entered into the model. Figure 1 represents the configuration of junction in reality which has been constructed in the S-Paramics. The building of such model is done by drawing each node and link in the S-Paramics. Then, the suitable loop detectors have been put in the same place for the real one as shown in Figure 2. After that the matrix of origin and destination also has been included according to the actual data obtained from the actual loop detectors as shown in Figure 3. Moreover, this simulation model could be used with more details of changing the origin and destination of the modelled data with field data as shown in Figure 4. Figure 5 demonstrates the stage of modelling the merge section.In this study, the merge section has been modelled using simulation model (S-Paramics) is M62-J11 as observed in the reality. The duration of the simulation in S-Paramics is set by the user but the simulation can only be separated into 32 phases, where the flow for each phase can be different. As the flow is to be defined over 5 minute intervals it restricts the user to a simulation time of 32 times the duration of the intervals, in this case 160 minutes. However, it is necessary when using S-Paramics to add in a warm up time for the simulation so as to acquire an element of stability to the traffic flow. In this case it was set at 10 minutes, effectively reducing the simulation by an interval. Once the flow has been inputted for the 31 intervals the vehicle proportions are edited to accurately represent the types of traffic. Within each interval the percentage of heavy goods vehicle is altered to represent the values given by the MIDAS data. This will lead to a more accurate representation of the location at the time of analysis. However, S-Paramics does not allow you to edit the vehicle proportion based on the source of the traffic. For example, if the proportion of heavy goods vehicles was set at 10% for a specific interval, this value would represent the proportion of heavy good vehicles entering the simulation from the ramp and on the motorway combined for the period and not just for the motorway. Therefore any values taken from the MIDAS data for the motorway if applied will be used for the ramp as well and therefore may not be accurate.Once the values have been entered for all the intervals an initial run of the simulation can be complete. This initial run should match the real data for flow and vehicle type proportions, it is necessary next to compare the results from the simulation and determine whether they accurately represent real life data. Figure 6 and 7 show the contrast between the flow and speed for the simulation and MIDAS data at both upstream and downstream locations.Initial inspection would suggest that the simulated flow is a relative representation of the real flow but the simulated values for speed fall some distance short of those represented from the real data, however a more accurate inspection of the data is needed. The GEH statistic is a formlar used in traffic modelling that compares two sets of data statistically [6, 8 and 9]. | (1) |
Where, M is the flow from the model and C is the flow from the real world.The value of the GEH statistic can be applied to each 5 minute interval. If the model is an accurate representation of the model then over 85% of the simulation should have a value under 5.0. If this value is between 5.0 and 10.0 then the model may need some further investigation and if the value is over 10.0 then it is considered inaccurate.The GEH factors for this initial run were largely over 10.0 signifying that the model needed some calibration.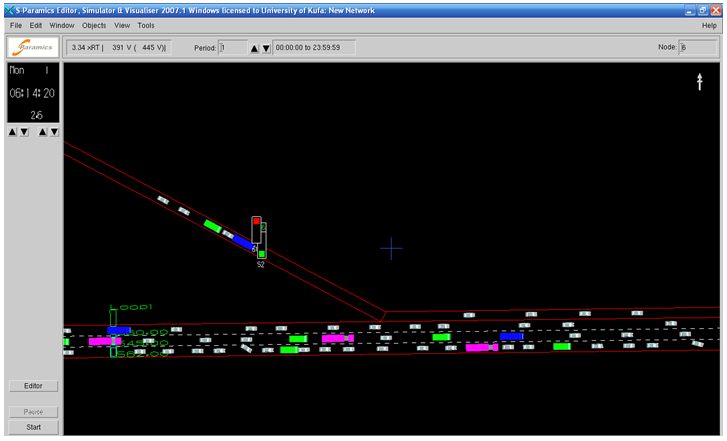 | Figure 1. Modelling M62 Junction 11 in the S-Paramics |
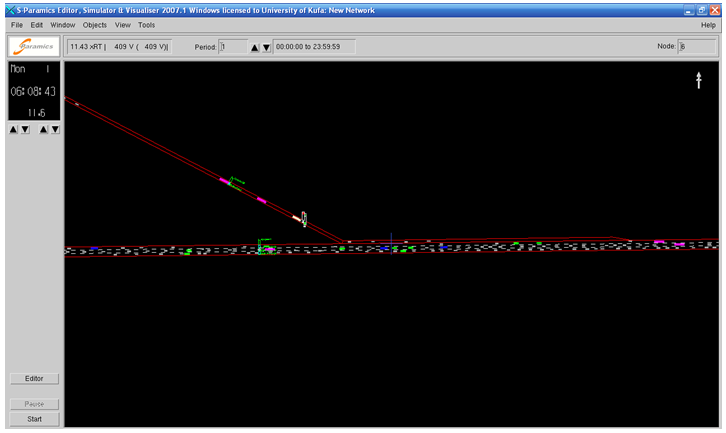 | Figure 2. Location of modelled loop detectors as in the reality (M62 J-11) |
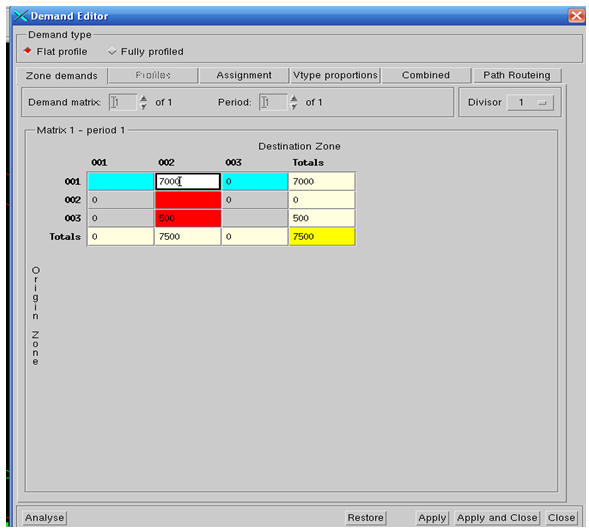 | Figure 3. Matrix of origin and destination for S-Paramics |
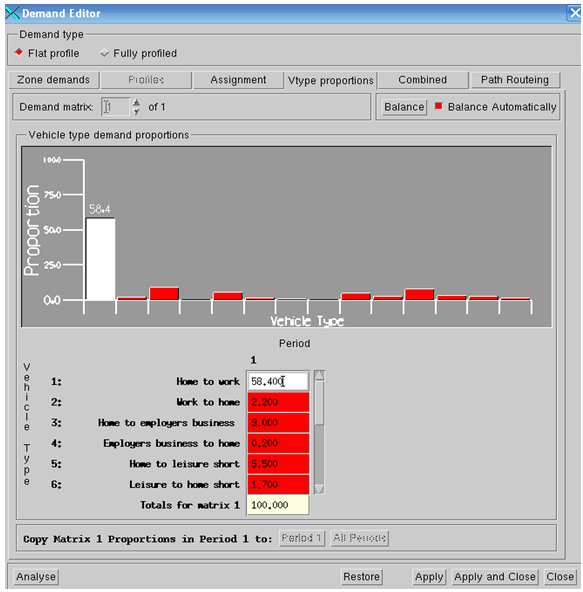 | Figure 4. Distribution of modelled vehicle types according to origin trip |
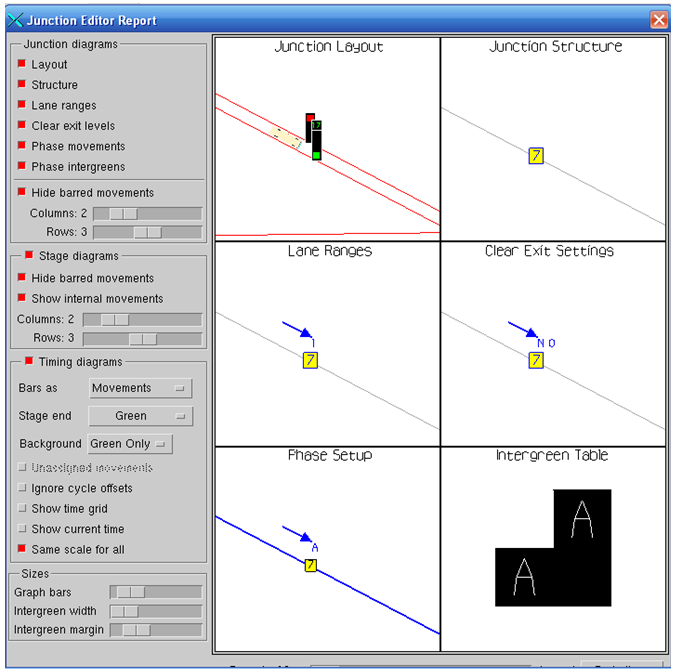 | Figure 5. Modelling merging section according to S-Paramics |
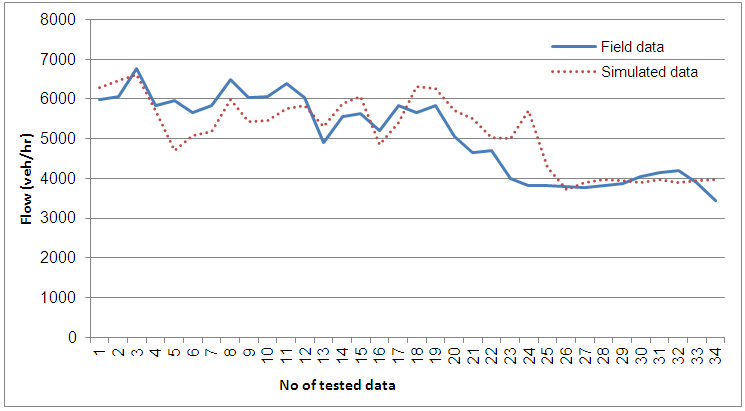 | Figure 6. Downstream Flow for simulated and field data (M62 –J11) |
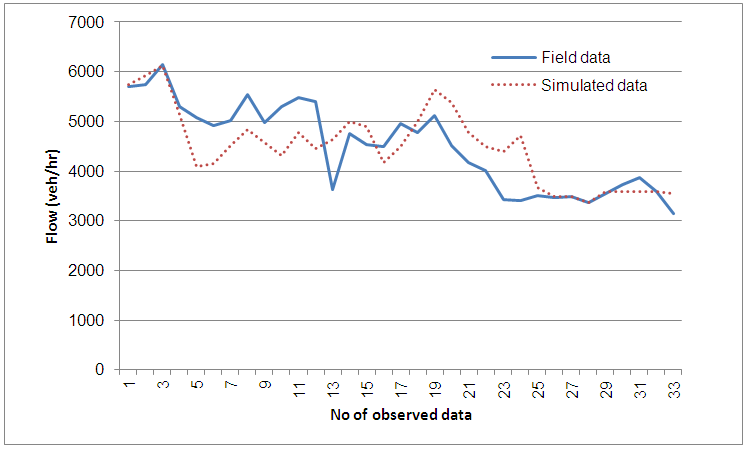 | Figure 7. Upstream Flow for both simulated and field data (M62-J11) |
4. Calibrating S-Paramics
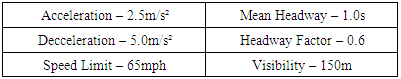
There are a number of factors within S-Paramics that can be altered that will have an effect on the outcome of the simulation. For the calibration of the model in this study the factors considered were the mean headway, the headway factor, the acceleration and decceleration limits, the motorway speed limits and the visibility limits of the drivers approaching the ramp. Each of these factors can have many values and the combinations of all the values with all the values is limitless, thus making the calibration of the model difficult. Initial values for headway, acceleration and decceleration were taken as 1.0secs, 2.5m/s² and 5m/s² respectively based on suggestions from Chu et al [10]. Values for headway factor and visibility were estimated at 0.5 and 150m respectivley and the speed limit was initially set at 70mph.From run to run of the simulation these values were marginally altered depending on the results of the GEH statistic from the previous run until a suitable GEH statistic value was achieved.
4.1. Calibration Results
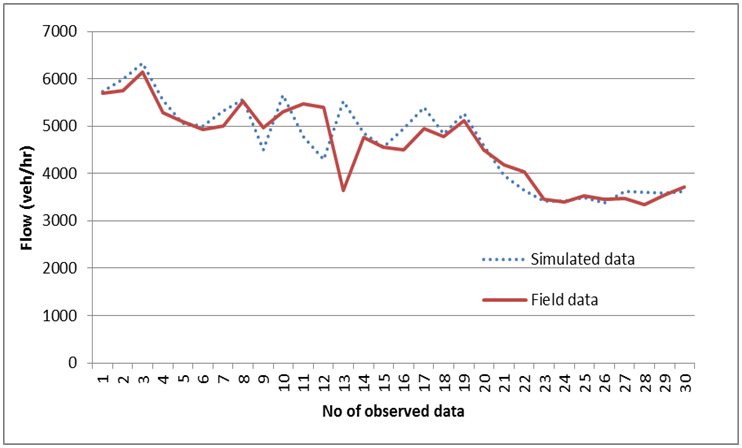
After close to 50 runs of the simulation the GEH statistic value was considered good enough to assume that the model was calibrated sufficiently. Defualt values are used in the develpoed model as indicated in Table 1. Figures 8 and 9 show the graphical results from the simulation run with field data for both downstream and upstream, respectively.The below results represent the most accurate achieved from the calibration of the S-Paramics model. For the values of speed recorded both upstream and downstream the GEH statistic had 100% of its values below 5.0 deeming the model a success. For the flow upstream and downstream the GEH statistic had 80% of its values below 5.0 and over 75% of its remaining values below 10.0. On a whole these values suggest that the model has been calibrated sufficiently to continue with further traffic analysis.Table 1. Assumptions of the developed model
 |
| |
|
 | Figure 8. Calibrated Downstream Flow (M62-J11) |
 | Figure 9. Calibrated Upstream Flow (M62-J11) |
5. Validation Model
Although the calibrated model produced data that accurately matched the real data it does not necessarily mean that the calibrated factors are correct for all models. It is possible that the factors that were altered just so happened to produce values that matched real data and were not necesarily definitive values for analysing this particular type of model. In order to validate these factors it is necessary to input them into a similar model that is dimensionally accurate to a real life junction with real data of flow and vehicle type inputted as with the calibration model. If this second model produces simulation values that accurately match the real life data then it can be assumed that the calibration factors are valid. For the validation the simulation is modelled on the M56 motorway, junction 2 as indicated in Figures 10 and 11. 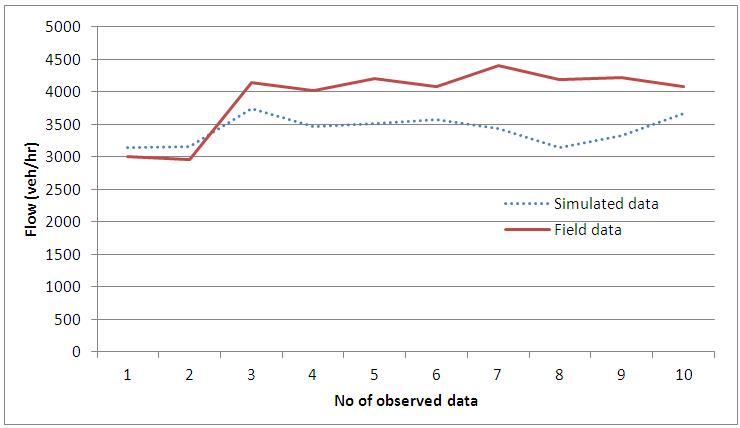 | Figure 10. Validation downstream flow |
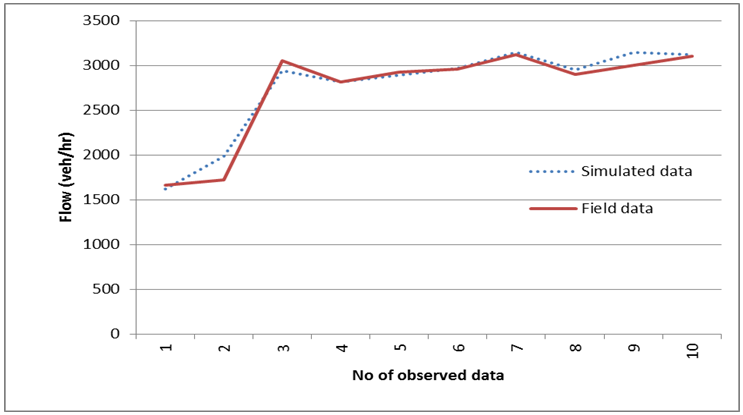 | Figure 11. Validation upstream Flow |
When applied to the validation results the GEH statistic suggests that for the upstream flow and speed and the downstream speed the results are accurate. However for the downstream flow there is only 20% of the results below 5.0. On a whole though, according to the GEH statistic the values given for the calibration of the model produce an accurate representation of real world traffic.
6. Discussion
Based on the results taken using the GEH statistic it would be fair to assume that the calibration of S-Paramics was a success. Although the GEH statistic provides a degree of accuracy to the data it does not in any way evaluate the true nature of the results. For example, based on the GEH statistic for the results for the simulation of the calibration model are accurate in comparison to the real data, but if you study the values from the downstream flow there are differences in values of over 1000 vehicles at times, in real life this is a significant number. Likewise, for the speed the real and simulated values differ by over 20 mph which is a too large a difference to neglect. It would be fair then to argue that the calibrated model is far from accurate and may need further calibration before it can be used to simulate real traffic flow.Further more, when analysing traffic flow it is impossible to predict human behaviour with total accuracy. Therefore there will always be a question mark over simulation models as no matter how finely calibrated the model may be there will always be a degree of guesswork when it comes to predicting human behaviour. Moreover, graphically the S-paramics mimics the reality at upstearm for both calibration and validation accurately. Whereas for the downstream there is a clear difference may be upto 1000veh/hr for both sets of data. This could be attributed to the limitations of S-paramics in represetning the reality as discussed before.
7. Conclusions
On a whole S-Paramics and similar micro-simulation programmes offer a great deal of flexibility and detail to the user. This allows for accurate models to be built and analysed that can confidently be used for traffic analysis. However, there are many changeable aspects and factors within the programme that may lead to differing results:1. The difference between the field and simulated data for the upstream section is less than the difference for downstream. This could be attributed to difficulty of represent the driver behaviour in reality such as coperative between drivers in the mainstream and ramp for downstream section. Whereas in the upstream the behvior approximately is close to the reality because the model deals with it as normal section. 2. There is a need for improving the S-paramics model by improving the code of this model which is unseen to the user.3. This study recommends to develop specific simulation model to represent merging behavior.
References
| [1] | Choudhury C. F. (2007). Modeling driving decisions with latent plans. (PhD thesis), Massachusetts Institute of Technology, USA. |
| [2] | Zheng, P. (2003). A microscopic simulation model of merging operation at motorway on-ramps. (PhD Thesis), University of Southampton, Southampton, UK. |
| [3] | Shen, J., Li, W., Qiu, F., and Zheng, S. (2015). Capacity of freeway merge areas with different on-ramp traffic flow. Traffic & Transportation, Vol. 27, 2015, No.3, pp-227-235. |
| [4] | Kotsialos, A. and Papageorgiou, M. (2001). The importance of traffic flow modelling for motorway traffic control. Networks and Spatial Economics, Netherlands, pp 179-203. |
| [5] | Clark, J. and Daigle, G. (1997). The importance of simulation techniques in ITS research and analysis. Proceedings of the 1997 Winter Simulation Conference. USA. |
| [6] | Al-Jameel, H. (2012). Developing a simulation model to evaluate the capacity of weaving sections. (PhD Thesis), University of Salford. |
| [7] | Hounsell, N. and McDonald, M. (1992). An investigation of flow breakdown and merge capacitv on motonrays. Contractor Report 338, Transport Research Laboratory, UK. |
| [8] | Alterawi, M. (2014). Development of a micro-simulation model to evaluate shuttle-lane roadwork operations. University of Salford. |
| [9] | Nassrullah, Z. (2016). Development of a micro-simulation model for motorway roadworks with the use of narrow lanes and lane closure schemes. (PhD), University of Salford. |
| [10] | Chu, L., Liu, H.X., Recker, W., and Zhang, H.M. (2001). Development of a simulation laboratory for evaluating ramp metering algorithms. Institute of Transportation Studies, University of California. |

 Abstract
 Reference
 Full-Text PDF
 Full-text HTML