Prithiviraj Raja, Mehrnaz Doustmohammadi, Michael D. Anderson
Department of Civil and Environmental Engineering, The University of Alabama in Huntsville, Huntsville, USA
Correspondence to: Mehrnaz Doustmohammadi, Department of Civil and Environmental Engineering, The University of Alabama in Huntsville, Huntsville, USA.
| Email: |  |
Copyright © 2018 Scientific & Academic Publishing. All Rights Reserved.
This work is licensed under the Creative Commons Attribution International License (CC BY).
http://creativecommons.org/licenses/by/4.0/

Abstract
Estimation of Annual Average Daily Traffic (AADT) is vital for departments of transportation (DOTs) work because AADT provides the basic information for planning new road construction, determination of roadway geometry, traffic control needs, congestion management strategies and safety considerations. AADT is used to determine state wide vehicle miles travelled on all roads and are used by transportation agencies to determine compliance with federal and state rules and regulations. DOTs spend heavily to collect traffic counts on state roads, but mostly traffic counts are not available for off-system, or low volume roads. Often estimates rely on a comparison with roads that are subjectively considered to be similar. Such comparisons are inherently subject to large errors, and also may not be repeated often enough to remain current. Therefore, a better method is needed for estimating AADT for off-system roads. This research developed a technique to estimate AADT for local roads in Alabama incorporating various facets from previous studies. A model has been developed using linear regression using known AADTs and collection of socio-economic and location variables as a means to estimate the AADT. The model relied upon five independent variables: nearby population, number of households in the area, employment in the area, population to job ratio and access to major roads. The model was used to generate AADT estimates on low-volume rural, local roads for 12 counties in Alabama. The model was developed using 70 percent of the collected data and validate to the remaining 30 percent of the data. Consistent with the recent literature on AADT estimation, a log transformation was attempted to determine if any improvements were determined. The paper concludes that a straight linear regression model can be used to predict the AADT for low-volumes roadways in Alabama for future applications.
Keywords:
Low-Volume Roads, Traffic Counts, Estimation
Cite this paper: Prithiviraj Raja, Mehrnaz Doustmohammadi, Michael D. Anderson, Estimation of Average Daily Traffic on Low Volume Roads in Alabama, International Journal of Traffic and Transportation Engineering, Vol. 7 No. 1, 2018, pp. 1-6. doi: 10.5923/j.ijtte.20180701.01.
1. Introduction
The Federal Highway Administration (FHWA) defines annual average daily traffic (AADT) as the “total volume of vehicle traffic of a highway or road for a year divided by 365 days”. AADT provides transportation planners and safety engineers with critical roadway information to estimate performance. Transportation planners and policy decision-makers mainly rely on AADT metrics to assess highway performance, guide their future planning and funding decisions. Furthermore, AADT serves as the framework for estimating other transportation planning factors including crash rate predictions, vehicle emissions, and forecasting future travel demand.While there are usually AADTs for major roads, minor roadways are generally not counted. This study focused on establishing a model for estimating AADT for low-volume roads in Alabama, including the important variables that contribute to AADT. As a result, a regression equation may be developed for predicting the AADT on other low-volume roadways across the state. The success of the model development effort depends not only on the modeling technique chosen, but also on the data availability and methods of data aggregation. The following issues are addressed in this paper: availability of data and processing, suitability of various data for model development, choice of modeling techniques, model accuracy, model application and model improvements. This paper presents the results of the research efforts addressing these issues.
2. Literature Review
The motivation behind the study of AADT estimation is to develop an effective data collection plan, to reduce the data collection cost, and to produce AADT estimation with high level of accuracy. The overall concept of estimating AADT is not novel. For higher volume roadways, the concept of estimating AADT has been attempted an evaluated several times (1, 2, 3, 4, 5, 6, 7, 8 and 9). The predictors include population size, employment, total number of lanes, location type (urban/rural), personal income, vehicle registrations. Attempts have been made to forecast AADT on lower volume roadways as well (10, 11, 12, 13, 14 and 15).Ordinary linear regression (OLR) is used to identify the statistical relationship between a dependent variable and one or more independent variables (16). In this case, OLR describes the relationship between AADT and its explanatory factors. OLR minimizes the sum of prediction errors between predicted values and known values. The equation is as follows (16): | (1) |
Where• Y is the dependent variable- AADT•  are the selected explanatory variables•
  are the coefficients estimated from the modelFrom Literature review it is identified that OLR is the most frequently used method to estimate AADT due to its proven ability to assess relationships in multiple situations while maintaining simplicity and ease of use. Two examples of OLR models are presented for review. The model estimated AADTs for Florida “off-system” roadways lacking them (17). The research authors developed various regression models to assess different types of areas in Florida. In each model, AADT served as the dependent variable. The regression models examined included:• Statewide model• Rural model• Small-medium urban model• Large metropolitan area modelIn particular, this “rural” based model incorporated data from eight counties. The final regression equation was (17):
 | (2) |
Where• Pop is a county’s total population;• Labor is a county’s total labor force;• Lane mile is the total lane miles of county roads in a county;• Vehicles is the number of automobiles registered in a county;Similarly, Zhao and Chung used regression modelling to assess various factors and their ability to predict AADTs (14).The researchers examined four unique regression models to determine AADTs in Broward County, Florida. This yielded the following regression equations (14): | (3) |
 | (4) |
 | (5) |
 | (6) |
Where• FCLASS is functional class of roadway• LANE is the number of lanes in both directions• REACCESS is the access to regional employment• DIRECTAC is direct access (or connection) to an expressway• EMPBUFF is the number of people employed along a roadway segment• DPOPCNTR is the distance to a population center• POPBUFF is the number of people living along a roadway segmentIn addition, these models examined a larger set of variables than regression models developed by other researchers, thus leading to a more comprehensive approach in determining AADT. For these reasons, these regression models exhibited the greatest initial promise for inclusion into this research. In this research, Shen et al. AADTs for Florida “off-system” roadways OLR method is the better modelling approach for identifying local roadway AADT due to: availability of data, ability to replicate the process, and availability of resources (chiefly time). The research team selected this model for several reasons. First, it displayed positive results in predicting local roadway AADT within Broward County, Florida. Second, it was compatible with existing data and county databases, thereby eliminating additional time and resource demands needed in data collection. Finally, based on the Florida model the research team developed the linear regression model to improve the accuracy and for forecasting AADT.
3. Data Collection
The researchers used several data types as potential variable to predict AADT for the low-volume roadways. The data collected included: traffic counts (for model development and validation purposes), population in the census blocks near the count location, number of households in the census blocks near the count location, employment in the census blocks near the count location and the location of state routes in Alabama.The traffic counts were collected explicitly for this study as additional counts that were being collected by the state to support the needs of the Highway Performance Monitoring System (HPMS). For this study, 205 low-volume counts were collected from several rural counties in Alabama. The counts ranged from 1 to 1,163 with an average traffic count of 151 vehicles per day. The location of the counts is shown in Figure 1. The count locations were selected as to identify a collection of households and businesses that would be likely to use the roadway, therefore attempting to eliminate the number of pass-by trips that would impact the count, but not necessarily be based on the local socio-economic data.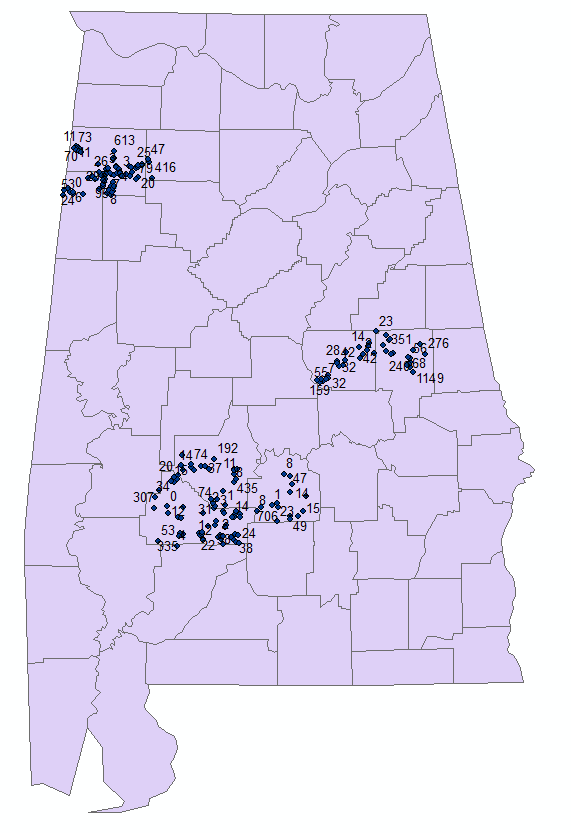 | Figure 1. Traffic Count Locations |
The data for the population, number of households and number of employees in the census blocks near the count locations was obtained from the Census Department. The data were downloaded as ArcGIS shape files. The count locations and census data are shown in Figure 2.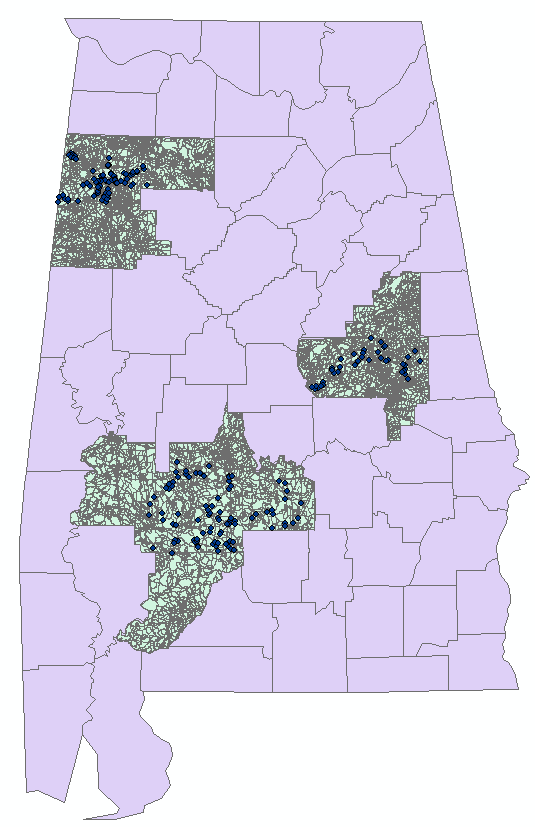 | Figure 2. Count Locations and Census Demographic Data |
The state routes in Alabama were obtained from the Alabama Department of Transportation and were used to identify key locations that the low-volume roadway would potentially connect. This data was collected to reflect other studies in the literature (14). The routes included all interstates, U.S. Highways and state highways as shown in Figure 3.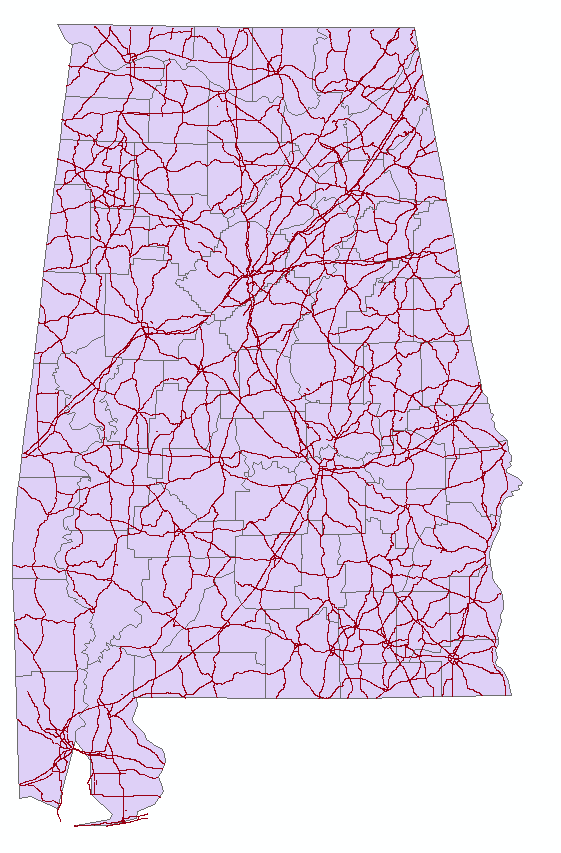 | Figure 3. Alabama State Road System |
4. Model Development
The research team developed ordinary linear regression models to predict local roadway traffic volumes in Alabama. To increase the potential accuracy of the OLR models, data transformations were made to test different options (18). The OLR models and associated transformations that were considered are:• Linear: Y = a + b X• Quadratic: Y = (a + b X) ^2• Logarithmic: Y = a + b LN (X)Based on low-volume roadway traffic count availability, 12 counties in Alabama were included in this research. The researchers developed the OLR model using the transformation identified and variable presented previously. The models were developed following standard statistical techniques (16). The models developed for estimating low-volume roadway AADT using the randomly assigned 150 traffic counts are: | (7) |
 | (8) |
 | (9) |
Where,• Count is the predicted traffic count,• Population is the block population for blocks near the count location (0.25 miles),• Households is the number of households in the blocks near the count location (0.25 miles),• Employment is the block employment for blocks near the count location (0.25 miles),• POPtoJOB is the ratio of block population to employment. The quality of the models was determined using statistical methods and visualizations. The R-squared coefficient between the observed data and the model predictions for the three models developed are 0.84 for the linear model, 0.82 for the quadratic model and 0.53 for the logarithmic model. Figure 4-6 show a scatter plot of the actual traffic counts versus the predicted counts for the three models. As can be interpreted from the original model development activities, the linear and quadratic models seem to have the most applicability for predicting traffic counts on low-volumes roadways.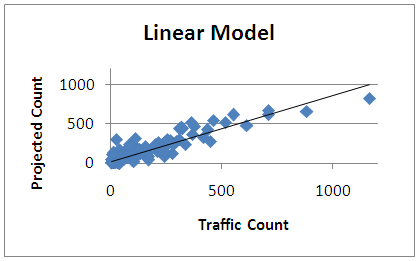 | Figure 4. Comparison plot of the linear model development data |
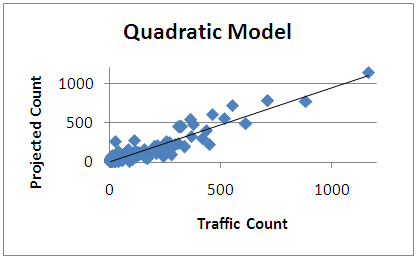 | Figure 5. Comparison plot of the quadratic model development data |
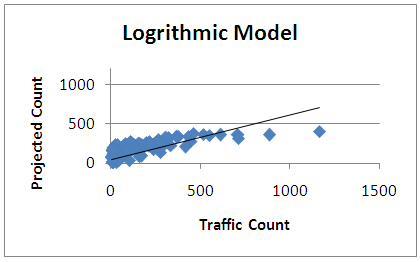 | Figure 6. Comparison plot of the logarithmic model development data |
5. Model Validation
The validation of the models was performed using 55 traffic counts from the original data collection effort. Figure 7-9 show the scatter plot of the three models to the validation dataset. The R-squared coefficient between the observed data and the model predictions for the three models are 0.78 for the linear model, 0.80 for the quadratic model and 0.60 for the logarithmic model.To further the analysis and validation of the models, a Nash-Sutcliffe statistic was calculates to test the model ability to accurately predict the traffic. The N-S statistic is calculated as (19): | (10) |
E is the Test StatisticQo is the value of actual countQm is the predicted count Qave is the average value of all the actual counts.The Nash-Sutcliffe coefficient ranges from 1 to –infinity and measure the accuracy of the model to the actual values and compares the results to using the average of the traffic counts. For comparing multiple models, the model with the highest calculated coefficient is the model that provides the most accurate estimate of the actual data. The calculated coefficients for the different models are 0.75 for the linear model, 0.75 for the quadratic model and 0.44 for the logarithmic model.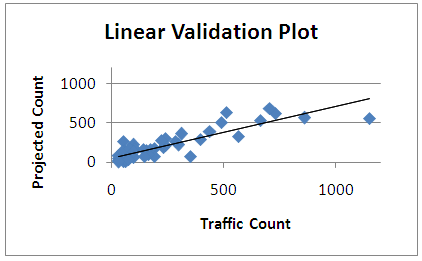 | Figure 7. Comparison plot of the linear model validation data |
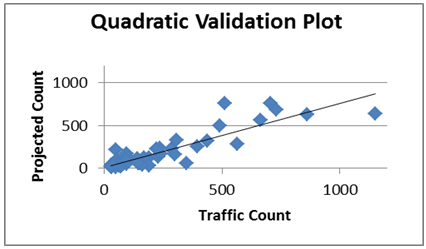 | Figure 8. Comparison plot of the quadratic model validation data |
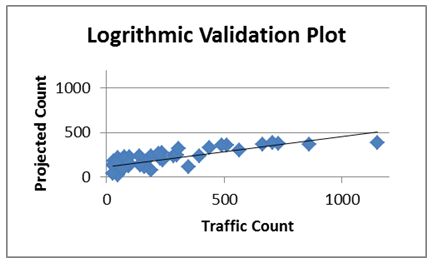 | Figure 9. Comparison plot of the logarithmic model validation data |
6. Conclusions
This paper examined the development and testing of three models for predicting traffic count volumes for low-volumes roadways in Alabama. The models were developed using statistical approaches and demographic variables near the count locations. From the validation of the models, the linear model and the quadratic model performed at the same level. Therefore, the decision on the optimal model for use between the two alternatives is left to the end user.The overall contribution to this paper is a model that can be used to specifically predict AADT values for low-volume roadways. The volume range that the equations presented in this work are generally for roadways with an anticipated traffic volume of less than 1,000 vehicles per day. The equations have the validity to determine traffic counts for roadways during the current year and also have the benefit, due to the use of demographic variables, to forecast a traffic count in the future, to continue to support safety analysis and maintenance scheduling.
ACKNOWLEDGEMENTS
This paper was made possible by funding provided by the Alabama Department of Transportation, SPR-0001(058) 2015-533.
References
| [1] | Gecchele, G., Rossi, R., Gastaldi, M., and Caprini, A. (2011). "Data Mining Methods for Traffic Monitoring Data Analysis: A case study." Procedia - Social and Behavioral Sciences, 10.1016/j.sbspro.2011.08.052, 455-464. |
| [2] | Lowry, Michael; Dixon, Michael. “GIS Tools to Estimate Average Annual Daily Traffic.” National Institute for Advanced Transportation Technology. University of Idaho. 2012. |
| [3] | Sharma, Satish C., Brij M. Gulati, and Samantha N. Rizak. "Statewide traffic volume studies and precision of AADT estimates." Journal of Transportation Engineering 122.6 (1996): 430-439. |
| [4] | Tao Pan. “Assignment of estimated average annual daily traffic on all roads in Florida” University of South Florida, 2008. |
| [5] | Zhao, Fang, and Nokil Park. "Using geographically weighted regression models to estimate annual average daily traffic." Transportation Research Record: Journal of the Transportation Research Board 1879 (2004): 99-107. |
| [6] | Zhong, M. and Liu, G. (2007). "Establishing and Managing Jurisdiction-wide Traffic Monitoring Systems: North American Experiences." Journal of Transportation Systems Engineering and Information Technology, 10.1016/S1570-6672(08)60002-1, 25-38. |
| [7] | Doustmohammadi, M. and Anderson, M.D. “Developing Direct Demand AADT Forecasting Models for Small and Medium Sized Urban Communities” International Journal of Traffic and Transportation Engineering. Vol 5, No. 2. pp 27-31. 2016. |
| [8] | Zhao, Fang and Soon Chung; “Contributing Factors of Annual Average Daily Traffic in a Florida County”, Transportation Research Board, 2001. |
| [9] | Zhao, Fang, and Nokil Park. "Using geographically weighted regression models to estimate annual average daily traffic." Transportation Research Record: Journal of the Transportation Research Board 1879 (2004): 99-107. |
| [10] | Anderson, Michael, Khalid Sharfi, and Sampson Gholston. "Direct demand forecasting model for small urban communities using multiple linear regression." Transportation Research Record: Journal of the Transportation Research Board 1981 (2006): 114-117. |
| [11] | Dadang Mohamad, Kumares C. Sinha, Thomas Kuczek, Charles F. Scholer. “Annual Average Daily Traffic Prediction Model for County Roads, Transportation Research Board 2013 Annual Meeting. 1998. |
| [12] | Garber, Nicholas J. “A Methodology for Estimating AADT Volumes from Short-Duration Counts.” Virginia Highway & Transportation Research Council. 1984. |
| [13] | Wang, Tao; Gan, Albert; Alluri, Priyanka. “Estimating Annual Average Daily Traffic (AADT) for Local Roads for Highway Safety Analysis.” Transportation Research Board 2013 Annual Meeting. 2012. |
| [14] | Zhao, Fang and Soon Chung; “Contributing Factors of Annual Average Daily Traffic in a Florida County”, Transportation Research Board, 2001. |
| [15] | Sharma, S., Lingras, P., Xu, F., and Kilburn, P. (2001). "Application of Neural Networks to Estimate AADT on Low-Volume Roads." Journal of Transportation Engineering, 10.1061/(ASCE)0733-947X(2001)127: 5(426), 426-432. |
| [16] | Montgomery, Douglas, Elizabeth A. Peck, G. Geoffrey Vining. Introduction to Linear Regression Analysis. Wiley ISBN-1119180171. 2012. |
| [17] | Estimation of annual average daily traffic for off-system roads in Florida. No. Final Report. Florida Department of Transportation, 1999. |
| [18] | Doustmohammadi, Mehrnaz, Michael Anderson, and Ehsan Doustmohammadi. "Using Log Transformations to Improve AADT Forecasting Models in Small and Medium Sized Communities." International Journal of Traffic and Transportation Engineering 6.2 (2017): 23-27. |
| [19] | Nash, J. Eamonn, and Jonh V. Sutcliffe. "River flow forecasting through conceptual models part I—A discussion of principles." Journal of hydrology 10.3 (1970): 282-290. |


 are the selected explanatory variables•
  are the coefficients estimated from the modelFrom Literature review it is identified that OLR is the most frequently used method to estimate AADT due to its proven ability to assess relationships in multiple situations while maintaining simplicity and ease of use. Two examples of OLR models are presented for review. The model estimated AADTs for Florida “off-system” roadways lacking them (17). The research authors developed various regression models to assess different types of areas in Florida. In each model, AADT served as the dependent variable. The regression models examined included:• Statewide model• Rural model• Small-medium urban model• Large metropolitan area modelIn particular, this “rural” based model incorporated data from eight counties. The final regression equation was (17):


 Abstract
 Reference
 Full-Text PDF
 Full-text HTML