-
Paper Information
- Paper Submission
-
Journal Information
- About This Journal
- Editorial Board
- Current Issue
- Archive
- Author Guidelines
- Contact Us
International Journal of Traffic and Transportation Engineering
p-ISSN: 2325-0062 e-ISSN: 2325-0070
2017; 6(3): 43-52
doi:10.5923/j.ijtte.20170603.01

Impact of Reshoring Phenomenon on Freight Flow in the U.S
 Abstract
 Reference
 Full-Text PDF
 Full-text HTML
Jaehoon Kim1, Michael Anderson2, MD Sarder3
1Tennessee Department of Transportation, Nashville, USA
2Civil & Environmental Engineering, University of Alabama in Huntsville, Huntsville, USA
3Industrial Engineering Technology, University of Southern Mississippi, Long Beach, USA
Correspondence to: Jaehoon Kim, Tennessee Department of Transportation, Nashville, USA.
| Email: |  |
Copyright © 2017 Scientific & Academic Publishing. All Rights Reserved.
This work is licensed under the Creative Commons Attribution International License (CC BY).
http://creativecommons.org/licenses/by/4.0/

Over the several decades, China became attractive to many multi-national enterprises (MNEs) to relocate their manufacturing facilities for several reasons: the average hourly compensation costs of China was less than 10 percent of the costs of the United States (U.S.) in the early 2000s. However, the advantage of lower labor costs in China is gradually decreasing as labor costs are rapidly increasing, which will eventually negate the saving for companies that chose to offshore their manufacturing. Moreover, the issue of quality is becoming more important to consumers in the U.S., and federal and state governments have initiated tax benefits for MNEs to encourage returning manufacturing to the U.S. as well as keeping or expanding their current facilities. Due to these reasons, many MNEs started returning or expanding their manufacturing facilities in the U.S. These economic activities are referred to as ‘Reshoring’. According to the Reshoring Initiative, more than 50,000 jobs and approximately 300 companies already have been reshored. In addition, the reshoring activities in the U.S. are expected to increase in the near future. Therefore, this study aims to analyze the impact of the reshoring activities to the transportation system in the near future. This study examines the expected commodities and locations of manufacturing facilities which will be reshored, and estimates the freight flow which will be reallocated in the U.S.
Keywords: Reshoring, International Freight, Freight Modelling
Cite this paper: Jaehoon Kim, Michael Anderson, MD Sarder, Impact of Reshoring Phenomenon on Freight Flow in the U.S, International Journal of Traffic and Transportation Engineering, Vol. 6 No. 3, 2017, pp. 43-52. doi: 10.5923/j.ijtte.20170603.01.
Article Outline
1. Introduction
- Over the several decades, China became attractive to many multi-national enterprises (MNEs) to relocate their manufacturing facilities for several reasons: the average hourly compensation costs of China was less than 10 percent of costs of the United States (U.S.) in the early 2000s [1]; China has a large educated work force [2]; the overall combination of lower labor costs offset the higher logistics costs and resulted in overall saving for the MNEs [3]. However, the advantage of lower labor costs in China is gradually decreasing as labor costs are rapidly increasing, which will eventually negate the saving for companies that chose to offshore their manufacturing [4]. Moreover, the issue of quality is becoming more important to consumers in the U.S., and federal and state governments have initiated tax benefits for MNEs to encourage returning manufacturing to the U.S. as well as keeping or expanding their current facilities [5, 6]. Due to these reasons, many MNEs started returning or expanding their manufacturing facilities in the U.S. Examples include Apple Corporation that has one of their computer production lines being produced in the U.S. [7], and General Electric which has expanded their manufacturing in Kentucky in response to customers demanding higher quality products made in U.S. [8].These economic activities are referred to as ‘Reshoring’. According to the Reshoring Initiative, more than 50,000 jobs and approximately 300 companies already have been reshored [9]. In addition, the reshoring activities in the U.S. are expected to increase in the near future [10]. Therefore, in order to establish a future freight plan, it is necessary to predict the changes of freight flow due to reshoring. This study aims to analyse the impact of the reshoring activities on the transportation system in the near future. However, it is not easy to predict new manufacturing facility location because it depends on various factors. Therefore, this study selects 10 potential new locations where manufacturing facilities based on the current reshoring statistics collected by Reshoring Initiative. This study is divided into two parts: 1) to examine the expected commodities and locations of manufacturing facilities which will be relocated in the U.S. 2) to estimate the freight flow after relocating of manufacturing facilities in the U.S.
2. Literature Review
- The term of ‘Reshoring’ is defined as “The practice of transferring a business operation that was moved overseas back to the country from which is originally relocated” by Oxford Dictionaries [11]. Moreover, many scholars also define the term of reshoring through the literature. Fratocchi et al. define the reshoring as the decision of relocating the offshored manufacturing in company’s home country or other countries depending on the strategy of the firm [12]. According to Kinkel and Maloca, the term reshoring refers to “activities of once offshored manufacturing capacities from foreign locations back to the domestic location” and “re-concentration of parts of production from own foreign locations as well as from foreign suppliers to the domestic production site of the company” [13]. Tate et al also defines the reshoring as “the relocation of manufacturing facilities from traditional offshore locations to more attractive offshore locations or even home to the United States” [14]. In this study, ‘Reshoring’ is defined as relocating and/or bringing back once-offshored manufacturing facilities to the home countries of the business firms including the activity of the re-concentration of parts of production and the activity of creating of production.The one of the most important motives for offshoring activities was the cost saving due to the lower average labor costs of the developing countries, such as China or India. In contrast to the labor costs saving, the logistics costs and hidden costs had to be increased because of the longer transport distance. However, the labor costs saving is much greater than the increased logistics costs, therefore, MNEs have kept bringing their manufacturing facilities out of their home countries [2]. According to Holz, for example, the labor costs of Czech Republic are approximately one third of the labor costs of Germany. Even though the hidden costs such as rebate, higher logistics costs, and quality assurance have to be required, the total cost of productions is 7.7 percent cheaper than domestic production cost made in Germany [15]. According to the report of Boston Consulting Group, the proportion of labor saving costs was 65 percent, and the proportion of total saving costs before considering transportation, duties and other costs was 16 percent comparing with U.S.-based productivity in 2000 [16]. However, they forecasted the expected labor costs saving proportion of offshoring would be 39 percent, and the total cost saving would be only 10 percent in 2015 [16]. Besides, higher quality assurance is being demanded by domestic customers, and federal and state governments announced the policies of tax benefits for the MNEs which will bring back, keep, or expand their manufacturing plants to the U.S. to promote economic growth [5, 6].
3. Data Preparation
- The Freight Analysis Framework (FAF) database is the publicly released freight database developed by BTS and FHWA. The FAF data integrates various database such as Commodity Flow Survey (CFS), International trade data from U.S. Census, USDA agriculture, forest service data, state reports, and Census report, to present a comprehensive freight movement within, out of, and into the U.S. [17] The FAF4, which is the latest version, was released in 2015. The FAF4 consists of 8 international trade regions and 132 domestic zones based on the CFS regions [18]. The FAF4 also includes modes of transportation, commodity types by Standard Classification of Transported Goods (SCTG) code, freight tonnage and value by each origin-destination pair. One of the strength of the FAF data is that the FAF is the only public data which includes commodity-based Origin-Destination (O/D) data, international freight flow, and major transportation mode share. The FAF4 is used in order to estimate new freight distribution after the reshoring. In addition, for this study, researchers have to consider international trade volume and foreign transportation mode. Therefore, the FAF4 is disaggregated as import, export, and domestic flow. Secondly, the reshoring freight volume is extracted from the imported freight volume from the East Asia, and then the extracted volume is redistributed on the domestic zones.
3.1. Select Commodities
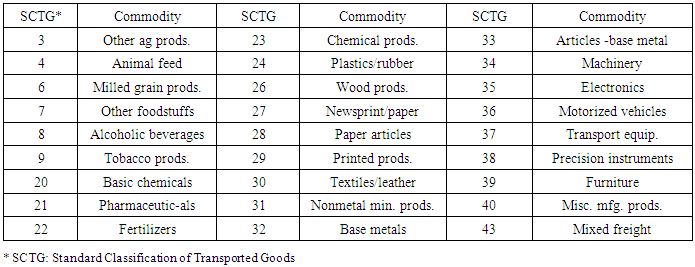
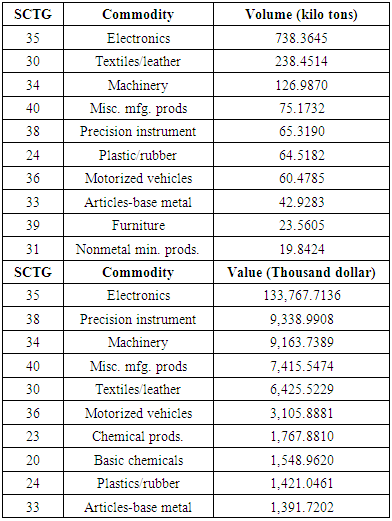
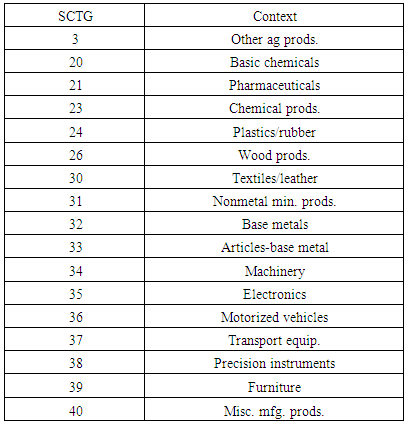
- The FAF4 consists of the freight flows of 43 commodities classified by SCTG code. It is necessary to select commodities which will be reallocated. This study focuses on only manufactured commodities because the definition of reshoring in this study is relocating and/or bringing back once-offshored manufacturing facilities to the home countries of the business firms including the activity of the re-concentration of parts of production and the activity of creating of production. Thus, the manufacturing commodities are selected out of 43 SCTG commodities. To develop a list of potentially reshoring commodities, a series of steps was undertaken. First, raw materials such as grains, live animals, crude petroleum, or coal were excluded from the possible reshoring commodities. Only manufacturing product commodities are targeted for this study. As a result, 27 commodities are remained as shown below table (see Table 1). Secondly, the top 10 highest volume of the imported freight and highest value of the imported freight were identified (see Table 2). It is assumed that highest volume and highest value commodities preferentially will be reshored because these commodities tend to increase logistics costs. Increased cargo volume causes more trips, and more delivery trips increase the total travel distance, total fuel consumption, and other variable costs [19]. High value commodities also increase shipping costs. For example, insurance costs commonly are estimated by a function of the commodity value to weight ratio [20]. Therefore, it can be assumed that these high volume or high value commodities are reshored to reduce total logistics costs.
|
|
|
|
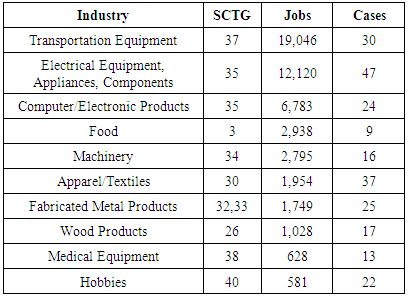
3.2. Select Reshoring Regions
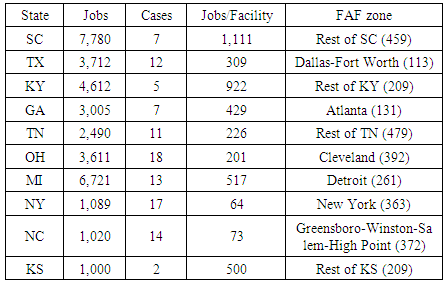
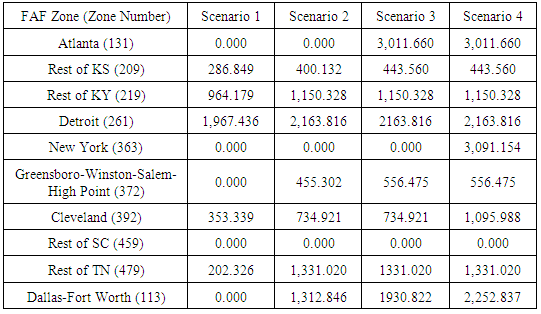
- The next step is to identify the target regions where the already offshored manufacturing will be relocated. According to the Reshoring Initiative, more than 280 companies brought back their off-shored manufacturing to U.S. or expand their manufacturing, and it generated new more than 50,000 jobs at 39 states [9]. For the first option to build the reshoring scenarios, current reshoring trends were used. 12 states where the number of jobs created was more than 1,000 are selected as the regions where the reshoring manufacturing activities are to be performed [9]. Another option to build the scenarios is that the reshoring manufacturing facilities will be located to the areas of the East of Mississippi river regions including all of Gulf coast regions. Therefore, 10 target states, which are SC, TX, KY, GA, TN, OH, MI, NY, NC, and KS, are selected. As mentioned before, this study uses FAF4 commodity data, and FAF 4 consists of CFS level zones. This study assumes the reshoring manufacturing facilities will be relocated in one of FAF zones in each state which has the highest number of employment. The FAF zones of 10 selected states are listed on the table shown below.
|
4. Sensitivity Analysis
- It is not easy to estimate how much manufacturing activities will be brought back to U.S. In this study, therefore, a sensitivity analysis is conducted on the assumption of the various reshoring proportion of the 17 manufacturing commodities. The assumed proportions are taken to be from 5 percent up to 20 percent incrementally by 5 percent. The sensitivity analysis with these four scenarios will show changes in the international freight flow, specifically imported freight flow, and changes in reshoring volumes of the target regions. - Scenario 1: 5% of the imported manufacturing commodity volume will be reallocated to the U.S.- Scenario 2: 10% of the imported manufacturing commodity volume will be reallocated to the U.S.- Scenario 3: 15% of the imported manufacturing commodity volume will be reallocated to the U.S.- Scenario 4: 20% of the imported manufacturing commodity volume will be reallocated to the U.S.
5. Estimation of the Reshoring Freight OD Matrices
- For the last step, the estimation methodologies of the freight flow matrices were selected. It was assumed that consumers will select suppliers with lowest transportation costs, and develop a transportation optimization model to estimate the expected O/D matrix after the reshoring. A transportation optimization model is developed to estimate the minimum total transportation costs. Consider a directed graph, G(N,A) comprised of a set N of nodes and a set of directed arcs connecting a pair of nodes. The set of nodes N consists of four categories of the nodes; 1) the set of international ports i, 2) the set of reshoring target nodes j, 3) the set of final destination nodes k and international trade partner Asia A. The OceanCost denotes shipment costs from Asia to port i, and is calculated using the shipping distance and the unit cost of freight in this study. The distance is referred to the webpage of ‘SEA-DISTANCE.ORG’ and the unit cost dollar/ton/mile is referred to the literature [21]. The InlandCost represents truck cost from ith origin to kth destination or from jth origin kth destination. The inland costs consists of the nationwide U.S interstate network developed in the previous research and unit cost of inland transportation referred to the literature [21, 22]. The imported volume via ith port to kth destination is denoted as xik, the reshored freight volume from jth origin to kth destination is represented as yjk. The both imported and reshoring volume includes all of 17 commodities volume. The objective function and the constraints for the linear optimization procedure are described as below.
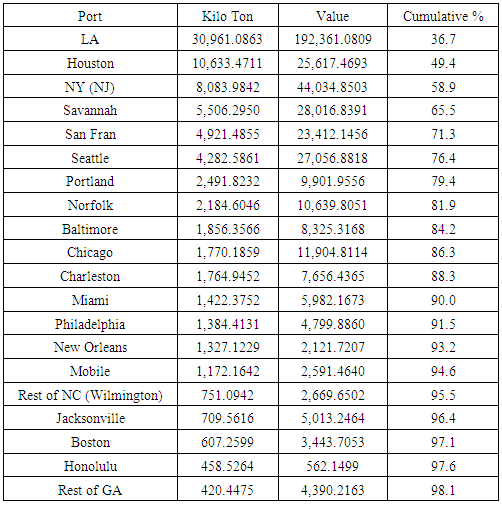
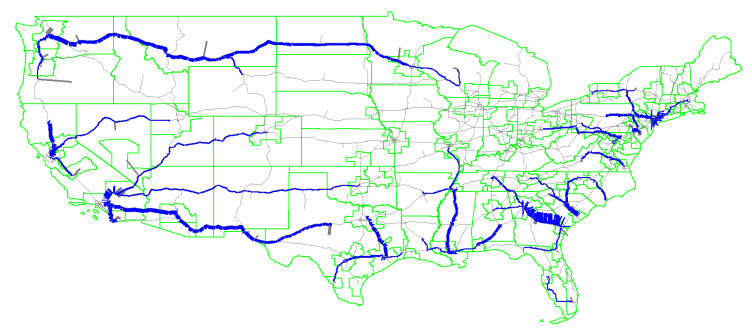
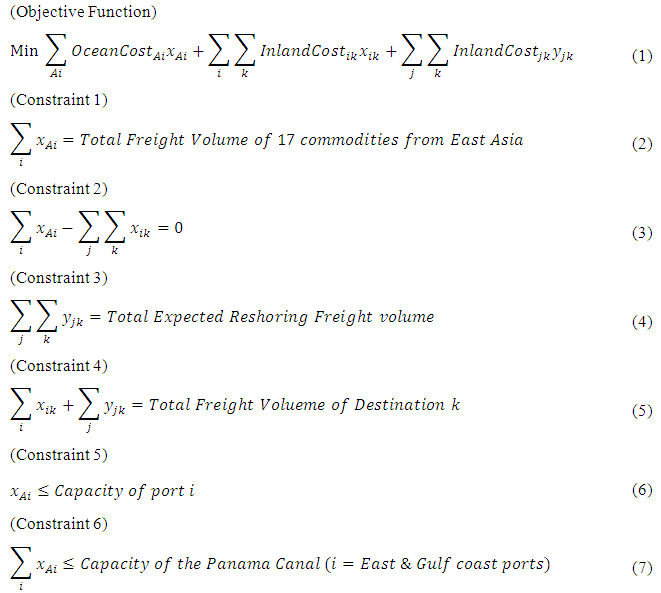 Constraint 1 specifies the total imported freight volume from East Asia to port i. Constraint 2 ensures that all of the imported volume must be distributed to destination k. Constraint 3 specifies the total reshored commodity volume on the 10 target regions. Constraint 4 ensure the total consumption of the destination k. Constraint 5 guarantee that the imported volume via port i should not exceed its capacity. Constraint 6 specifies that the total imported volume of East & Gulf Coast ports should not exceed the Panama Canal capacity. The port capacities are referred to MARAD data. The biggest import metric tons are selected from 2000 to 2015 of the MARAD statistics [23], then the metric tons are converted to short tons. The calculated results are used as the port capacities. The Panama Canal capacity is referred to the literature, and the capacity is doubled because of the Panama Canal expansion [21, 24]. According to the FAF4, the imported freight volume from East Asia and major international trade ports are listed in Table 6. The ports selected for this study are highlighted. Top 16 ports receive more than 95% of the imported volume and the top 15 ports, excluding Chicago because of lack of port capacity data, were selected. The regions highlighted in blue in Figure 1 show the geography of FAF zones that present the selected trade ports. The regions highlighted in red in Figure 1 represent the location of FAF zones that present the selected reshoring target regions.
|
6. Results
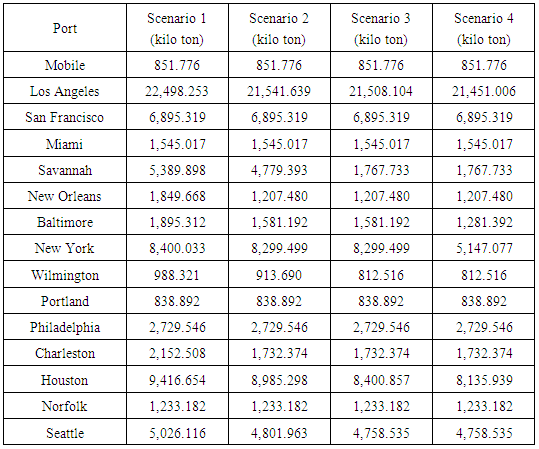
- The results of the optimization are summarized in the Table 7 and 8. The scenarios prepared before are analyzed by the developed optimization model. The Table 7 denotes changes of imported volume at port i and the Table 8 represents the target reshoring regions. These analyses focus 17 target reshoring commodities, and other imported commodities are not considered in this optimization.
|
|
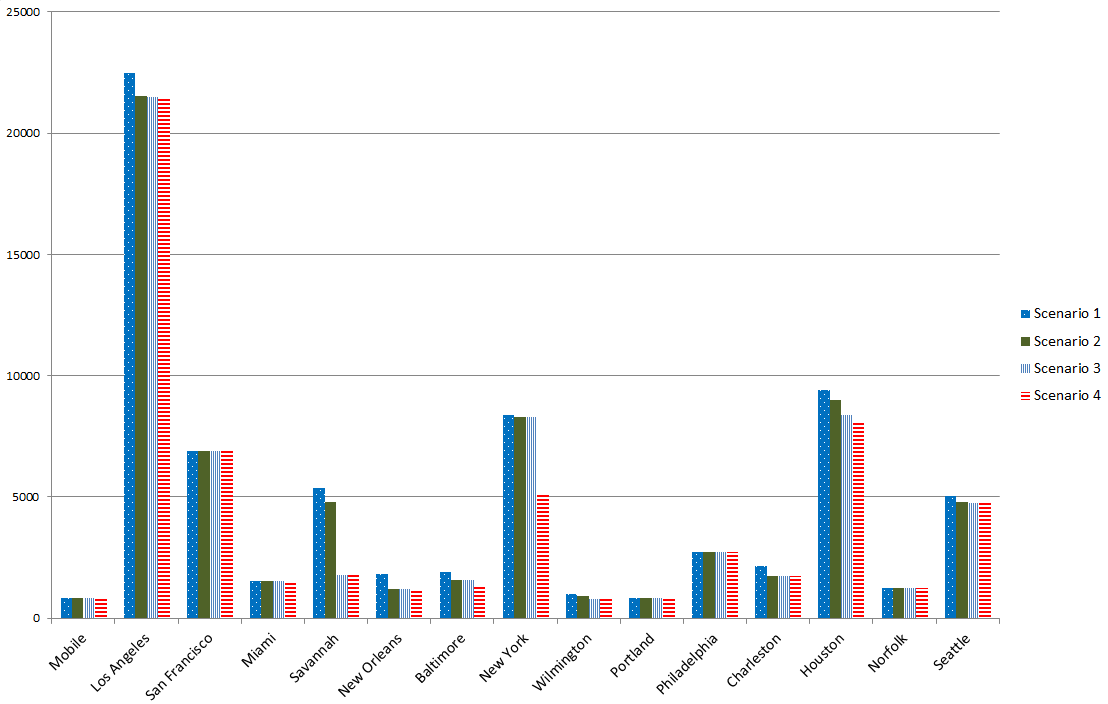
6.1. Changes of Imported Volume via the Ports
- As shown in Table 7, some of ports will be significantly affected by reshoring. For example, the imported target commodities through the port of Savannah of scenario 4 will be decreased almost 70 percent compared to scenario 1, and the imported volume through New Orleans, Baltimore, and New York ports will be decreased more than 30 percent comparing scenario 1 with scenario 4. On the other hand, it is estimated that no changes of imported volume through the port of Mobile, San Francisco, Miami, Portland, Philadelphia, and Norfolk will be in 2020 after the reshoring. It is also expected that import volume via LA/LB port and Seattle/Tacoma port will be slightly decreased after the reshoring. The results of the imported freight flow via the ports to domestic destinations are shown at the Figure 1 to 4. Comparably, the East and Gulf Coast ports will receive much less volume from East Asia after the reshoring. When 5 percent of the commodities will be reshored, East and Gulf coast ports will be major gateways for import volume consumed by Midwest area. The reason can be that the West coast ports’ market share will be pulled back to the East of Mississippi regions whereas East and Gulf coast ports’ market share will be expanded over the Midwest regions. As mentioned before, the port of Savannah is expected to be one of the biggest import ports at the East coast. The port will cover statewide of Georgia, Birmingham, AL and Nashville, TN when 5 percent of imported volume will be reshored. However, in the scenario 4, the port of Savannah will receive only 33 percent compared to scenario 1. The reason is that the transportation cost from reshoring target regions to Southeast regions is much cheaper than the costs from East Asia.
6.2. Distribution of Reshoring Commodities
- According to the results of estimation, Detroit and Rest of Kentucky will be major reshoring regions. Those two zones are located in inland area, thus amount of reshoring volume is allocated in these two regions comparably more than other regions. However, the reshoring volume of those two regions is not significantly increased while the ratio of reshoring volume is increased. On the contrary, the reallocated freight volume at Dallas-Fort Worth, TX, Atlanta, GA, and New York, NY regions is increased while the reshoring volume is increased. The reason can be deduced from the geographical position. Detroit, Kentucky, and their adjacent regions are comparably far from the East and Gulf coast ports. Therefore, we can be explained that the transportation costs from those two regions are much cheaper than the costs of imported commodities. Moreover, more manufacturing facilities will be relocated in the U.S., Dallas-Fort Worth, TX, Atlanta, GA, and New York, NY regions can be considered as the reshoring target regions because these zones are located inland area or demands of the regions and/or adjacent regions are relatively higher than other regions.
6.3. Total Transportation Cost Saving
- When 5 percent of commodities will be reshored, 6.3 percent of the total transportation costs will be decreased. The next 5 percent of reshoring commodities will lead to reduce additional 5.9 percent of total transportation costs. 5.7 percent of cost saving will be in the scenario 3 and 4. The amount of saving will be decreased while the reshoring volume will be increased.
 | Figure 1. Changes in Imported Volume on the International Ports |
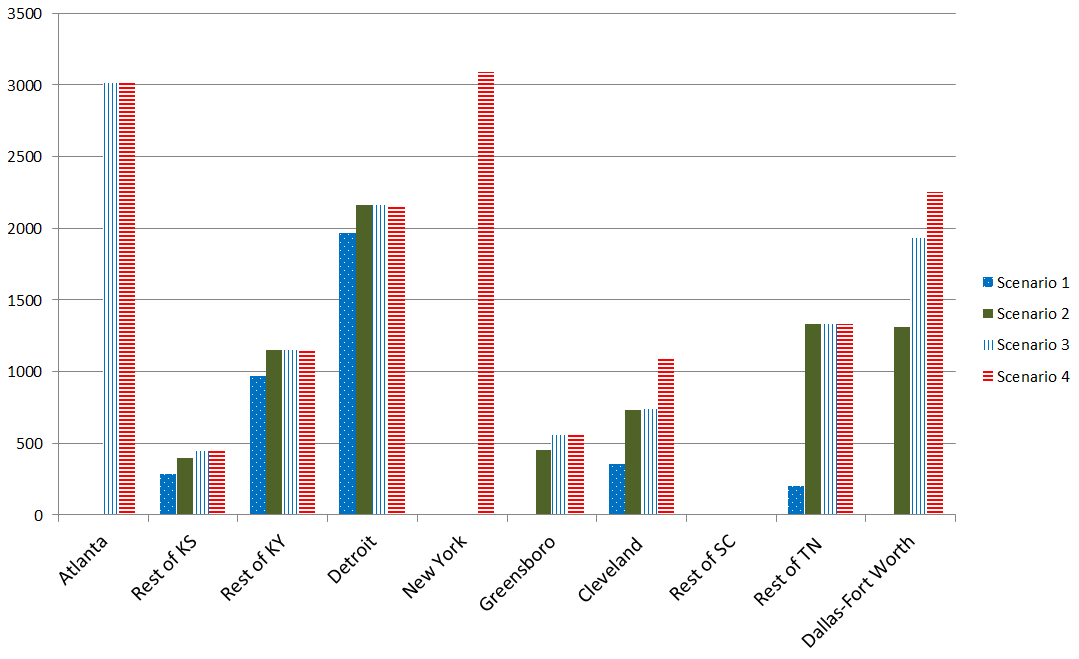 | Figure 2. Changes in Reshoring Volume at Target Zones |
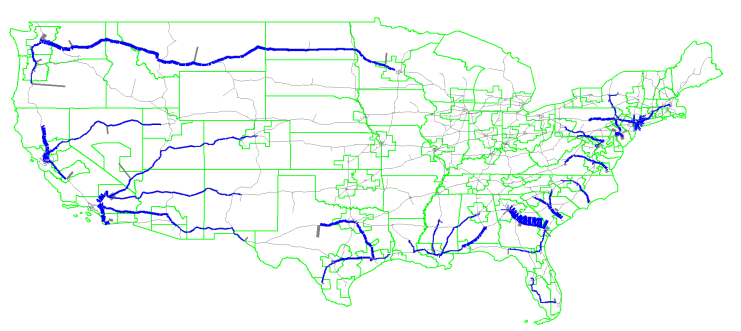
 | Figure 3. Assignment Result of Scenario 1 |
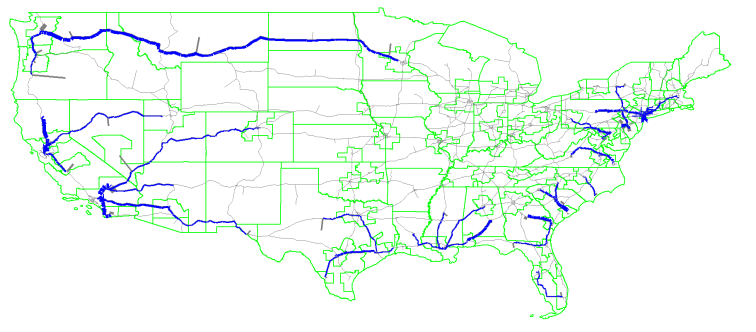
 | Figure 4. Assignment Result of Scenario 2 |
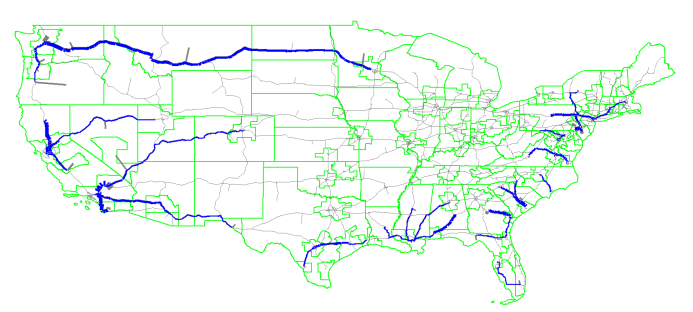
 | Figure 5. Assignment Result of Scenario 3 |
 | Figure 6. Assignment Result of Scenario 4 |
7. Conclusions
- Four reshoring scenarios are considered in this study in order to estimate freight flow after the reshoring. As reshoring volume is increased, the imported volume through the ports is decreased. Especially the volume via East Coast and Gulf Coast ports are decreased more than West Coast ports. In this study, LA/LB port, San Francisco port, Portland port, and Seattle-Tacoma port are considered. Only around 5 percent volume at LA/LB and Seattle-Tacoma ports is decreased, the other imported freight volume via San Francisco and Portland is not decreased in scenario 4 compared to scenario 1. On the other hand, East Coast ports have less than 30 percent of imported volume in scenario 4 compared to scenario 1. The total transportation cost is gradually decreased in the each scenario. It means the truck transportation cost from reshoring target regions to closer consumption regions is cheaper than the import transportation cost via East Coast ports. Moreover, the volume of target commodities consumption in the East of Mississippi river regions is higher than the West of Mississippi regions, therefore, it is expected that the reshoring volume will be highly supplied to the Midwest or Southeast regions compared to the West of Mississippi regions. However, it cannot be concluded that the reshoring will always save the costs because the amount of cost saving will be decreased while reshoring ratio will be increased. In addition, the fixed cost such as facility construction cost is not considered in this study. Therefore, it is necessary to estimate the threshold of the reshoring ratio to maximize transportation cost saving in the further research.