Jaehoon Kim1, Mehrnaz Doustmohammadi2, Michael Anderson2
1Tennessee Department of Transportation, Nashville, USA
2Civil & Environmental Engineering, University of Alabama in Huntsville, Huntsville, USA
Correspondence to: Jaehoon Kim, Tennessee Department of Transportation, Nashville, USA.
| Email: |  |
Copyright © 2017 Scientific & Academic Publishing. All Rights Reserved.
This work is licensed under the Creative Commons Attribution International License (CC BY).
http://creativecommons.org/licenses/by/4.0/

Abstract
Truck crashes are a major concern on our highway system. The ability to keep freight moving is vital to the national economy and the safety of our roadways is necessary to ensure growth. There have been several studies that have focused on truck crashes in many different states and using many different factors. The unique aspect of this paper is the focus on truck crashes where the truck is not at-fault, essentially, vehicles running into trucks and causing serious injuries or fatalities. This paper includes a review of truck crashes in Alabama divided by urban and rural, daytime and nighttime, at-fault and not at-fault. Also included are descriptive statistics for truck not at-fault crashes and a model to evaluate crash variables for truck crashes. A binary logit model and ordered logit model were developed to test the importance of specific crash variables to truck not at-fault crashes in Alabama. The paper contains the analysis and variables that were identified as significantly contributing to higher crash severity.
Keywords:
Truck Crashes, Not At-Fault Crashes, Statistical Analysis
Cite this paper: Jaehoon Kim, Mehrnaz Doustmohammadi, Michael Anderson, Analysis of Not At-Fault Truck Crashes in Alabama, International Journal of Traffic and Transportation Engineering, Vol. 6 No. 2, 2017, pp. 28-35. doi: 10.5923/j.ijtte.20170602.02.
1. Introduction and Background
Trucks on the nation’s highway system are the responsible for carrying 70% of the freight and represent the backbone of the nation’s logistic system [1]. Therefore, the safety of these vehicles on the highway system is essential for keeping the economy thriving. The study of truck crashes is not a novel concept, and the literature is dense with previous research evaluating the contribution to truck crashes using several driver, roadway and environmental factors [1-14]. From the studies reviewed, two were deemed to provide more interesting results as they relate to the objective of this paper. One study concluded that higher severity truck crashes was a function of distraction on the truck drivers part and alcohol use on the passenger car driver [2]. Another interesting study conclusion identified that fatal truck crashes were often caused by other drivers [14]. To that end, this paper examines crashes involving single unit and semi-trucks in Alabama where the truck driver was not at-fault for the crash. The data used are from the Critical Analysis Reporting Environment (CARE) maintained by the Center for Advanced Public Safety (CAPS) at the University of Alabama. The data exported include all crashes between 2010 and 2014 where the type of vehicle that caused the crash or the second vehicle involved in the crash was identified as a single unit truck or a semi-truck. Crash variable from the CARE database include: severity, whether the crash was at an intersection, lighting conditions, weather, curve and grade of the roadway, road type, road condition, traffic control, speed limits, median division, number of lanes, workzone locations, driver age, and driver condition.The focus of the paper is to analyze not at-fault truck crashes by severity and time of day as determine the contributing issues and circumstances associated with these crashes. From the data, a more detailed objective is defined and a further descriptive analysis and modelling process is completed to examine not at-fault truck crashes. The paper presents a series of descriptive statistics to support the issues presented in this work and identify the possible variables that are contributing to higher severity in truck not at-fault crashes. The paper then develops models of variables associating severity and truck not at- fault crashes.
2. Overall Truck Crash Statistics
The paper examines a collection of descriptive statistics from the crash database contained in the following sections. This initial analysis of the crashes is intended to support the need of the study.
2.1. Crash Severity
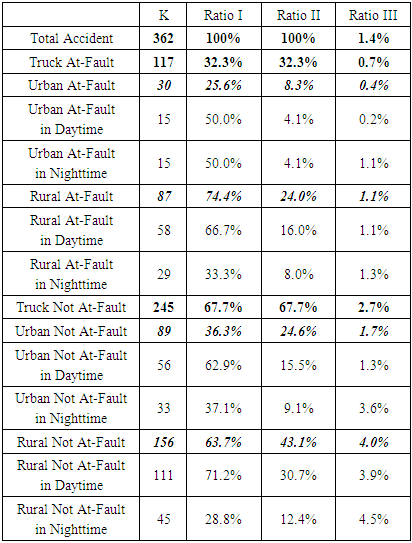
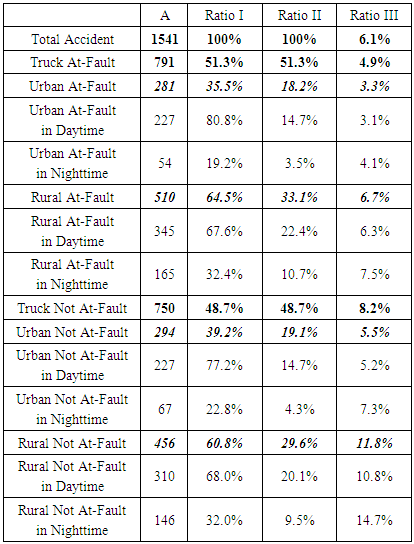
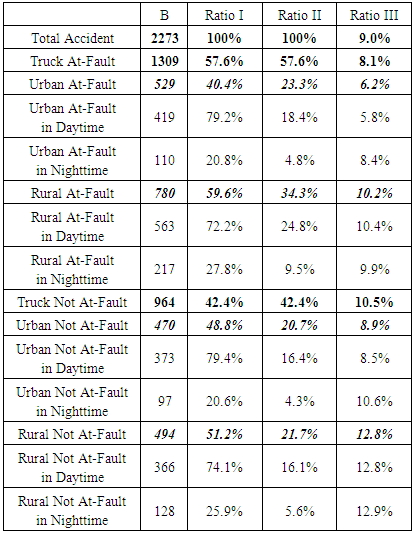
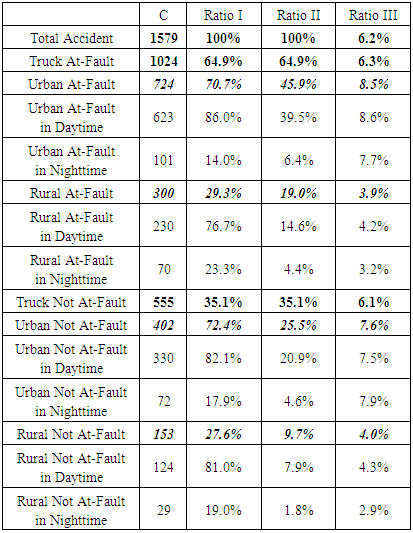
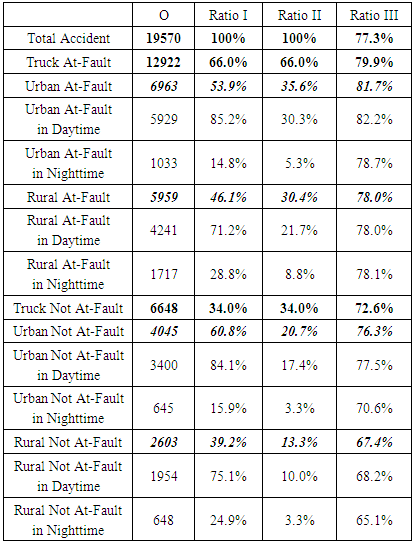
Initially, severity of truck crashes, both at-fault and not at-fault, were examined to determine the proportion of higher severity crashes, those with a fatality or incapacitating injury, versus lower severity crashes, those with no incapacitating injury, possible injury or property damage only (using the KABCO scale K: Fatal, A: Incapacitating, B: Non-Incapacitating, C: Possible, O: PDO). The crash severity analysis was performed for all truck crashes. Examining the database, there were a total of 16,163 crashes where the vehicle that caused the crash was a truck and 10,393 crashes where the second vehicle involved was a truck (Truck hit by another vehicles). For the crashes where the causal unit was a truck, 908 crashes (5.6%) involved a fatality or incapacitating injury while the remaining 15,255 crashes (94.4%) did not include a serious injury. For crashes where the second vehicle was a truck, 1,069 (10.3%) involved a fatality or incapacitating injury while the remaining 9,324 crashes (89.7%) did not include a serious injury. Examining truck-truck crashes, there were 74 high severity crashes and 1157 low severity crashes.Truck crashes that occurred in urban areas was 52.7% of the total while 47.3% occurred in the rural portion of the state. In the urban portion of the state, 3.8% of the crashes caused by trucks and 7.4% of the crashes where truck was the second vehicle resulted in high crash severity; while in the rural portion of the state, 8.5% of the crashes caused by trucks and 17.1% of the crashes where truck was the second vehicle resulted in high crash severity.The time of day characteristics examined in this paper focused on day versus night crashes. For this paper, daytime is considered to occur between 7:00 am and 7:00 pm while nighttime is considered to occur between 7:00 pm and 7:00 am, equal intervals. While the traffic volumes are different during the time periods, the number of severe crashes and the percent of total truck crashes by time of day are displayed in Table 1 to 5. There are thee ratios included in the table to address the uniqueness of the different time periods. Ÿ Ratio I: Ratio between higher level group and lower subgroup. For example, the percentages of Truck At-Fault and Truck Not At-Fault Ratio mean that the ratio of Truck At-Fault to Total and Truck Not At-Fault to Total. The percentage of Urban At-Fault means that the ratio of Urban At-Fault to Truck At-Fault. Ÿ Ratio II: Ratio of each number of crashes by classification to total number of crashes. For example, number of Urban Not At-Fault fatality is 56. And the Ratio II means that the ratio of Urban Not At-Fault fatality to number of all fatalities. Ÿ Ratio III: The ratio of each number of crashes by severity to total number of crashes by classification. For example, number of Urban Not At-Fault fatality is 56. And the Ratio III means that the ratio of Urban Not At-Fault fatality to all number of Urban Not At-Fault crashes.Table 1. Statistics of Fatality Truck Involved Crashes
 |
| |
|
Table 2. Statistics of Incapacitating Truck Involved Crashes
 |
| |
|
Table 3. Statistics of Non-Incapacitating Truck Involved Crashes
 |
| |
|
Table 4. Statistics of Possible Injury Truck Involved Crashes
 |
| |
|
Table 5. Statistics of PDO Truck Involved Crashes
 |
| |
|
Examining Tables 1 to 5, the highest percentage of severe crashes were associated with truck not at-fault crashes, especially rural truck not at-fault crashes. This result, that truck no at-fault crashes were severe, is surprising because it goes against the notion that truck cause severe crashes on the roadways, when in actuality, other cars tend to hit trucks and have more severe crashes. For property damage only crashes, trucks tend to have the highest percentage of at-fault crashes, especially in urban areas where trucks have issues turning and negotiating congested intersection.
2.2. Paper Objective
The objective of this paper is to focus the analysis on Not At-Fault truck crashes as these crashes represent a significant proportion of crashes, especially severe crashes, and while these crashes have been shown to represent a significant number of fatal crashes [14] these crashes have not been fully addressed in the literature. This study determines the factors affecting crash severity of Not At-Fault truck crashes. For this study, we separate the models by three levels of severity, urban and rural, and daytime and nighttime. To overcome the limitation of number of fatalities and possible injuries, we categorize the KABCO scale into three level of classification. K and A, B, C and O [1]. Lastly, this study compares the results of the previous study [1] and the results of this study. The study by Islam et al. considered only truck at-fault crashes and they found relevant factors influencing injury severity [1]. This study focuses on the not at-fault crashes, so it can lead to find differences of significant factors affecting truck crash severity between control targets.
3. Focused Descriptive Statistics
The paper continues by examining specific not at-fault crashes with data from the CARE database using the different crash severities previously identified yields the following tables and charts. The locations of the crash with respect to severity whether at an intersection or along a roadway segment are shown in Figure 1. From Figure 1, nighttime intersection crashes are underrepresented in the data, due to the combination of limited travel during the nighttime hours and the isolated intersection locations.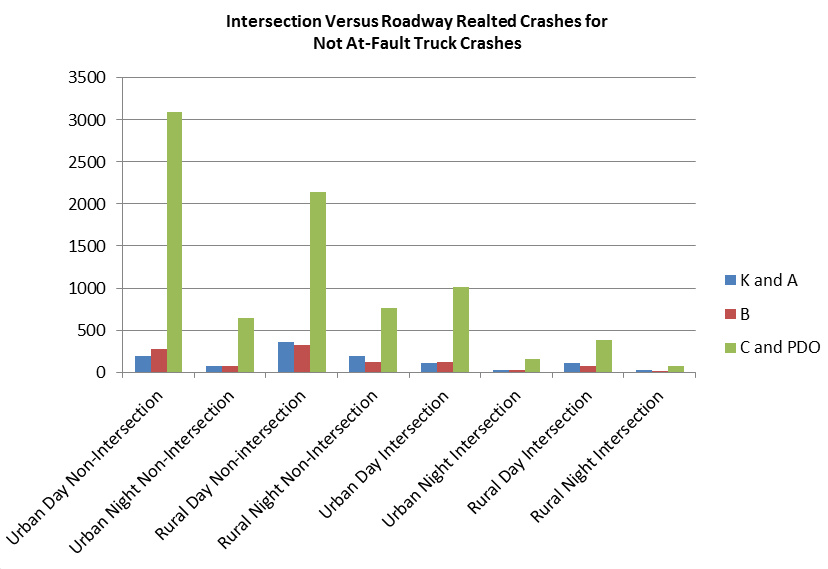 | Figure 1. Intersection Crash Severity for Not at-Fault Truck Crashes |
Another examination from the data was the weather condition at the time of the crash. The options in the database are wet and dry pavement, with the hypothesis that wet pavement will lead to not only more crashes, but more severe crashes than dry pavement. Figure 2 shows the severity of crashes based on pavement condition at the time of the crash. However, as can be seen from Figure 2, there was not a great difference between dry pavement and wet pavement crashes experienced in not at-fault truck crashes on any of the roadway area and time of day conditions.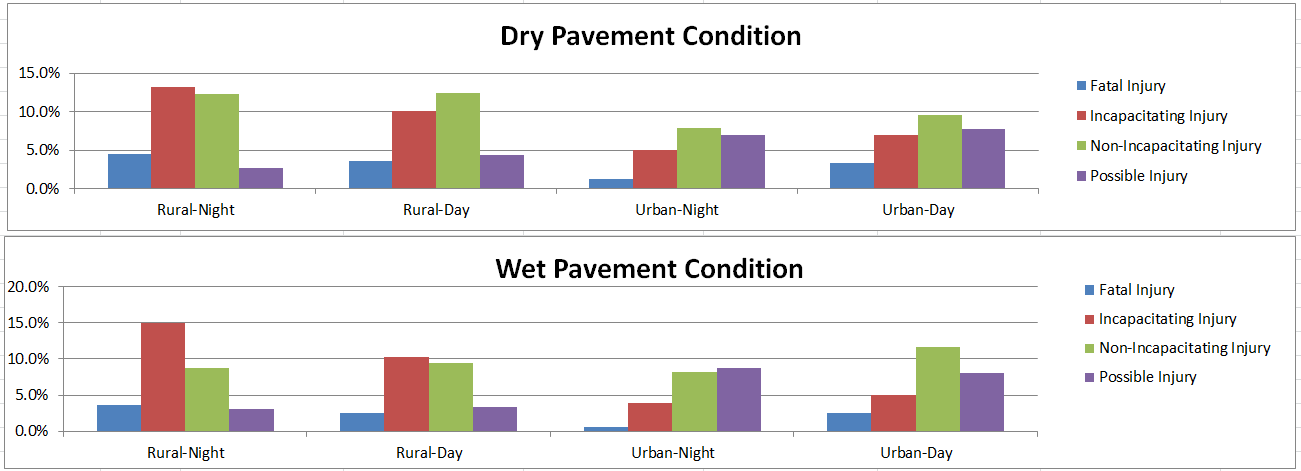 | Figure 2. Pavement Condition and Crash Severity for Not at-Fault Truck Crashes |
A further examination of fatal and incapacitating injury for not at-fault truck crashes was performed to examine the impact of the number of lanes. The hypothesis was that there would be a greater number of severe crashes on two-lane versus 4-lane roadways as the close proximity of vehicles and smaller pavement area pavement would limit a driver’s ability to avoid a serious crash. As can be seen from Figure 3 and 4, the highest percentage of fatalities and incapacitating injury crashes occurred on rural roadways, with a greater likelihood being in the nighttime hours. This is especially troubling when considering the lower traffic volumes on rural roadways; and particularly lower traffic volumes in the nighttime hours.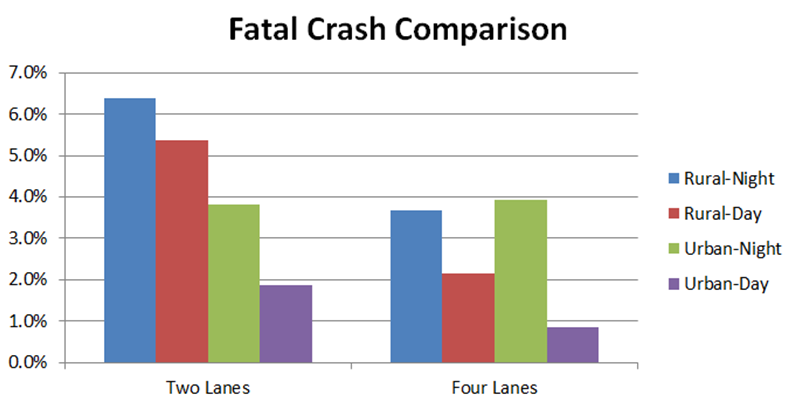 | Figure 3. Number of Lanes for Not at-Fault Fatal Truck Crashes |
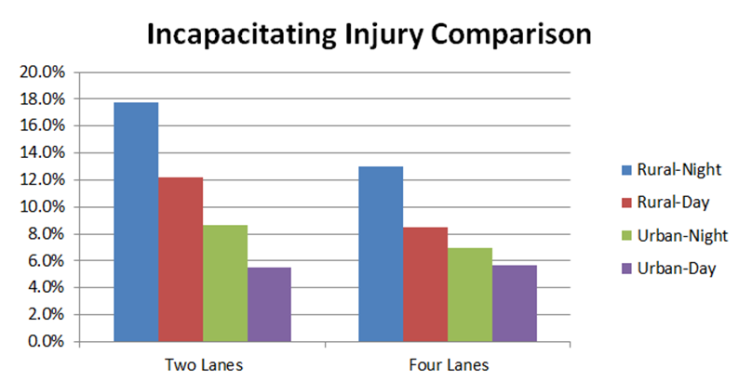 | Figure 4. Number of Lanes for Not at-Fault Truck Crashes |
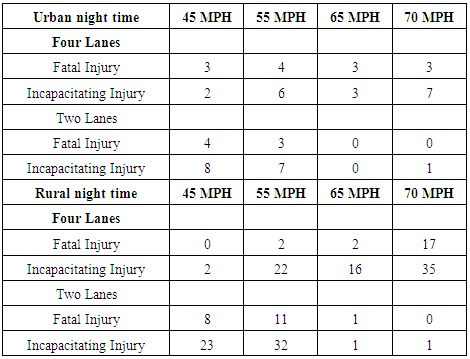
The last analysis preformed was to examine the impact of speed on high severity not at-fault truck crashes. Table 6 shows the number of fatalities and incapacitating injury crashes versus posted speed limit for both rural and urban nighttime crashes. As can be seen in Table 6, there is a significant increase in crash severity for rural, high speed, four-lane roadways, versus the urban and two-lane roadways. When examining the type of crash on these roadways that was most likely to lead to a fatality or incapacitating injury, the most likely type of crash was a rear-end crash in which a non-truck (passenger car, van or SUV) hit the back of a truck.Table 6. Number of Fatalities and Incapacitating Injury
 |
| |
|
The focused descriptive statistics were intended to provide some insight into the crashes in which there was a crash caused by a vehicle not a truck that was driven into a truck.
4. Statistical Model Analysis
The detailed model analysis is intended to focus on the variables related to truck crashes through a developed statistical model. To build the model, the crash severity is categorized as ordered discrete data using the KABCO injury scale, which aligns well with the CARE data: K, fatality; A, incapacitating injury; B, non-incapacitating injury; C, possible injury; O, property damage only. For this study, crash severity level is divided into three levels, fatality and incapacitating injury are classified as level 1, non-incapacitating injury is classified as level 2, and possible injury and property damage only are classified as level 3. In this study, a traditional logit model and an ordered logit model are applied to find significant factors influencing higher severity crashes for truck not at-fault crashes using discrete outcome data.
4.1. Estimation of Binary Logit Model
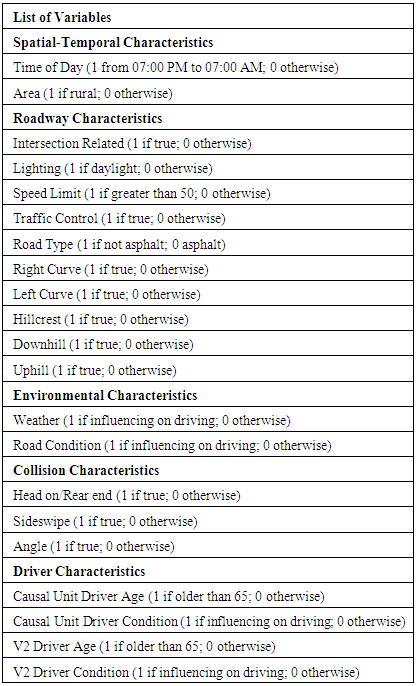
The binary logit model is estimated for truck not at-fault accidents. For this estimation, the crash severity level is categorized into two levels. Fatality and incapacitating injury is classified as 1 and otherwise is classified as 0. In addition, various factors likely to influence crash severity were collected and these factors were converted to indicator variables. The variables are listed in Table 7. The variables are also categorized by specific characteristics. Table 7. List of Variables
 |
| |
|
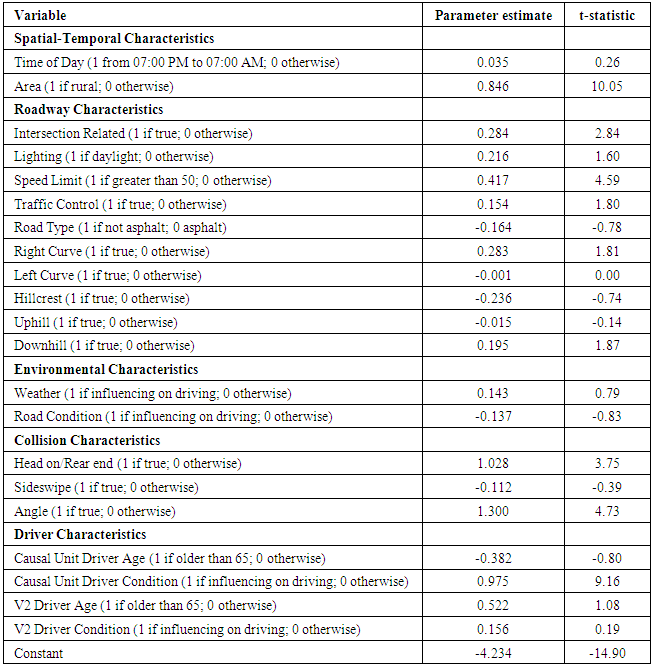
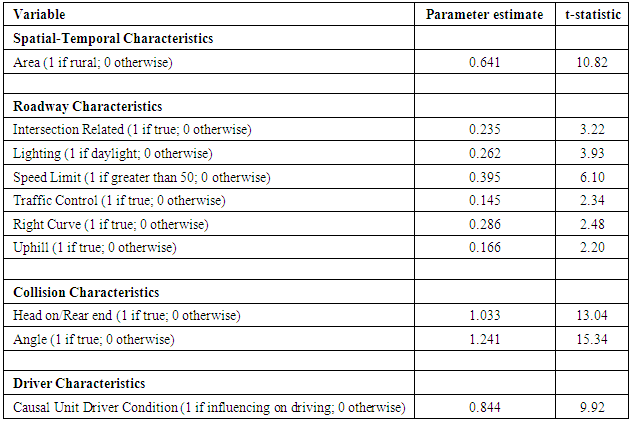
An all, 8,644 observations are used to estimate the binary logit model; the results of the model are shown in Table 8. The type of area, urban and rural, is significantly associated with the higher severity crashes whereas time of day, surprisingly, does not show significance. In the roadway characteristics: intersection related, speed limit, traffic control, right curvature, and downhill are significantly associated with the higher severity. Weather condition, such as rain, snow, severe wind, or fog, does not significantly affect the higher severity. Sideswipe crashes do not significantly influence higher severity, whereas head on/rear end and angle crashes show statistical significance. The factor of causal unit driver condition is significantly related to the higher severity, but otherwise do not show the statistical significance. To further the analysis, an ordered logit model was developed; the results of an ordered logit model are shown in Table 5.Table 8. Result of Estimation of the Binary Logit Model
 |
| |
|
4.2. Estimation of Ordered Logit Model
The ordered discrete probability model is broadly used to estimate ordinal discrete responses. The ordered probability models, both logit and probit, are derived by specifying an unobserved variable (or latent variable). The latent variable is generally specified as a linear function for each observation that is a crash observation in this study [15]. The ordered logit model can be formulated as follow.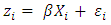 | (1) |
where X is a vector of independent variables determining the discrete ordering for the crash observation i, β is a vector of estimable parameters, and ε is a random error term (15). With the formulation, the ordinal observation data, y, for each crash, are defined as 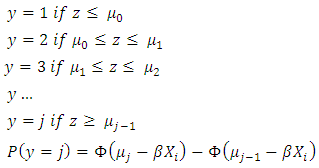 | (2) |
where N is the highest number of the ordered response representing three level of injury severity in this study.  are threshold values (referred to as estimable parameters), to define the y corresponding to the discrete ordering. P(y) is the probability of the ordinal response y, and
  represents normal distribution density function [15].All of the variables selected through the binary logit model have statistical significance and positive effects on the crash severity in this ordered discrete outcome model estimation. Rural area is significantly associated with higher severity (Odds Ratio (OR)=1.90). In comparison with urban area, rural area increases the probability of higher severity. In other word, the risk of higher severity in rural area is 1.90 times greater than urban area. Intersection related crash also shows higher probability of serious injury including fatality than other crashes (OR=1.27). The t-statistic of lighting variable in the binary logit model is not significant in alpha level to 0.10, has statistical significance with alpha level 0.15. However, lighting is significantly associated with the higher severity in this model estimation. If traffic control is installed at a roadway segment, it will result in more severe crash injury than no traffic control (OR=1.16). The result of the variable of speed limit is obvious, higher speed results in higher severity (OR=1.48). Right curvature increases the likelihood of higher severity crashes than straight or left curvature (OR=1.33), whereas downhill grade also increases the likelihood compared with uphill or hillcrest (OR=1.18). Even though sideswipe collision type is excluded in this estimation based on the result of previous step, collision type is also significant factor of the crash severity. Head on/Rear end collision is significantly related to the higher severity (OR=2.81). The OR is approximately two times higher than the factors of roadway segment. In addition, angle crash has the highest OR (OR=3.46). Driver condition is also significant factor of higher severity crash for only causal unit driver whereas second vehicle driver’s condition does not show statistical significance (OR=2.33).
 Table 9. Result of Ordered Logit Model
 |
| |
|
5. Conclusions
This study focuses on the crashes of truck not at-fault. Previous study conducted analyzed the factors affecting injury severity of single- and multi-vehicle large truck at-fault crashes on rural and urban roadways in Alabama (1). The study also implemented the CARE data and it focused on the single and multi-vehicle truck not at-fault crashes. Since the studies are similar, we will present the conclusions in a way that compares the two studies and identify the factors affecting both of types of truck crashes. The previous study used the unordered discrete outcome model in order to identify the factors affecting injury severity whereas this study used the ordered discrete outcome model in order to determine the factors influencing higher severity crashes. Therefore, it is not possible to directly compare the coefficients, elasticity, or odds ratios of both of results. However, this study can compare the significant factors of this study with the previous study results. Previous results show that the driver age and driver`s fatigue increase the probability of higher severity injury of single vehicle accident at rural area. The gender of driver and the fatigue increase the probability of fatal and serious injury of multi vehicle accident at rural. However, the drivers` age of both causal unit and second vehicle does not affect significantly injury severity in this study. Driver condition has statistical significance in only the multi vehicle collision at urban area. The statistically significant factors of roadway characteristics vary in the literature. Traffic control factor of SV-rural model is significant, and number of lanes and county road are the significant factors of MV-rural model. Curvature is the factor of SV-urban model, and no factor of roadway characteristics is significant in MV-urban model. However, this study finds different results of statistical analysis. The results of this study show that intersection, lighting, speed limit, traffic control, one type of curvature, and downhill grade are statistically significant factors. This study finds that most of significant factors in this study are different with the significant factors of the literature. The literature developed four types of mixed logit model and each model estimated different significant factors. It shows the different conditions may have different significant factors, and the model in this study uses the indicator variables classified roughly. For example, the models of the literature clearly show that off-peak time period affects more severe injury. However, this study classify the time period into two level, daytime and nighttime. It may affect the significance of the factor. Therefore, the ordinal variables of the CARE data have to be classified into more disaggregated level, and it is required to consider the unobserved heterogeneity for the next study.
References
| [1] | Islam, Samantha, Steven L. Jones, and Daniel Dye. "Comprehensive analysis of single-and multi-vehicle large truck at-fault crashes on rural and urban roadways in Alabama." Accident Analysis & Prevention 67 (2014): 148-158. |
| [2] | Zhu, Xiaoyu, and Sivaramakrishnan Srinivasan. "A comprehensive analysis of factors influencing the injury severity of large-truck crashes." Accident Analysis & Prevention 43.1 (2011): 49-57. |
| [3] | Blower, Daniel. "The relative contribution of truck drivers and passenger-vehicle drivers to truck/passenger-vehicle traffic crashes." The UMTRI Research Review 30.2 (1999): 1. |
| [4] | Spainhour, Lisa K., et al. "Evaluation of traffic crash fatality causes and effects: A study of fatal traffic crashes in Florida from 1998-2000 focusing on heavy truck crashes." (2005). |
| [5] | Harkey, David. "Evaluation of truck crashes using a GIS-based crash referencing and analysis system." Transportation Research Record: Journal of the Transportation Research Board 1686 (1999): 13-21. |
| [6] | Chen, Feng, and Suren Chen. "Injury severities of truck drivers in single-and multi-vehicle accidents on rural highways." Accident Analysis & Prevention43.5 (2011): 1677-1688. |
| [7] | Moonesinghe, Ramal, et al. An analysis of fatal large truck crashes. No. HS-809 569,. 2003. |
| [8] | Garber, Nicholas J., and Sarath Joshua. "Characteristics of large-truck crashes in Virginia." Transportation Quarterly 43.1 (1989). |
| [9] | Daniel, Janice, Chuck Tsai, and Steven Chien. "Factors in truck crashes on roadways with intersections." Transportation Research Record: Journal of the Transportation Research Board 1818 (2002): 54-59. |
| [10] | Islam, Mouyid, and Salvador Hernandez. "Large truck–involved crashes: exploratory injury severity analysis." Journal of Transportation Engineering139.6 (2013): 596-604. |
| [11] | Cantor, David E., et al. "A driver focused truck crash prediction model." Transportation Research Part E: Logistics and Transportation Review 46.5 (2010): 683-692. |
| [12] | Zhu, Xiaoyu, and Sivaramakrishnan Srinivasan. "Modeling occupant-level injury severity: An application to large-truck crashes." Accident Analysis & Prevention 43.4 (2011): 1427-1437. |
| [13] | Chang, Li-Yen, and Fred Mannering. "Analysis of injury severity and vehicle occupancy in truck-and non-truck-involved accidents." Accident Analysis & Prevention 31.5 (1999): 579-592. |
| [14] | Summala, Heikki, and Timo Mikkola. "Fatal accidents among car and truck drivers: effects of fatigue, age, and alcohol consumption." Human Factors: The Journal of the Human Factors and Ergonomics Society 36.2 (1994): 315-326. |
| [15] | Washington, S. P., Karlaftis, M. G., and Mannering, F. L. Statistical and Econometric Methods for Transportation Data Analysis, 2nd ed. CRC Press (2011). |

 Abstract
 Reference
 Full-Text PDF
 Full-text HTML