-
Paper Information
- Paper Submission
-
Journal Information
- About This Journal
- Editorial Board
- Current Issue
- Archive
- Author Guidelines
- Contact Us
International Journal of Traffic and Transportation Engineering
p-ISSN: 2325-0062 e-ISSN: 2325-0070
2017; 6(2): 23-27
doi:10.5923/j.ijtte.20170602.01

Using Log Transformations to Improve AADT Forecasting Models in Small and Medium Sized Communities
 Abstract
 Reference
 Full-Text PDF
 Full-text HTML
Mehrnaz Doustmohammadi1, Michael Anderson1, Ehsan Doustmohammadi2
1Department of Civil Engineering, University of Alabama in Huntsville, USA
2Department of Civil Engineering, University of Alabama at Birmingham, USA
Correspondence to: Mehrnaz Doustmohammadi, Department of Civil Engineering, University of Alabama in Huntsville, USA.
| Email: |  |
Copyright © 2017 Scientific & Academic Publishing. All Rights Reserved.
This work is licensed under the Creative Commons Attribution International License (CC BY).
http://creativecommons.org/licenses/by/4.0/

Due to cost limitations, Annual Average Daily Traffic (AADT) data is not typically collected for every roadway segment, therefore, it is necessary to have a means to estimate the AADT value when the need arises for an uncounted roadway or roadway segment. Often, the methodology used to develop an estimate of the AADT is through a regression based, linear model. This research examines the use logarithmic transformations to improve the relationship between key socio-economic, roadway variables and the estimated AADT. In the study, traffic count, socio-economic, and roadway data were collected and different regression based models were developed and tested to determine if the use of logarithmic transformations improves the model accuracy and the model transferability to other communities of similar size. The results of the paper indicate that a linear-log model produced the best results of the logarithmic transformations, and was an improvement over a traditional linear regression model.
Keywords: Annual Average Daily Traffic, Statistical Analysis, Urban Communities, Logarithmic Transformations
Cite this paper: Mehrnaz Doustmohammadi, Michael Anderson, Ehsan Doustmohammadi, Using Log Transformations to Improve AADT Forecasting Models in Small and Medium Sized Communities, International Journal of Traffic and Transportation Engineering, Vol. 6 No. 2, 2017, pp. 23-27. doi: 10.5923/j.ijtte.20170602.01.
Article Outline
1. Introduction and Background
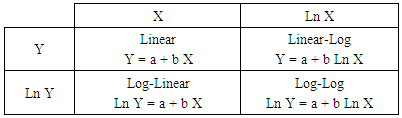
- Annual Average Daily Traffic (AADT) is a critical input to many transportation analyses including but not limited to safety assessments, maintenance schedules, and capacity improvements [1, 2]. The amount of effort, both time and cost, necessary to collect actual AADT data for every roadway in a community limit a community’s ability to obtain data for each unique roadway and roadway segment [3]. The demand for quality AADT data on local roads, coupled with the lack of available accurate data, has prompted previous research to examine and develop models that can accurately estimate AADTs within a small or medium sized community based on socio-economic variables [4-15]. The models use a combination of roadway and socio-economic factors within a given distance of the roadway segment and linear equations to convert the factors into AADT estimates. The linear equations provide a basis for estimating the AADT; however, linear models are not the only possible models that can be used. Logarithmic transformations are often used to improve the linear models [16]. The transformations are especially useful when it is unlikely that the data will follow a continuous trend, as with the case for traffic volumes which tend to limit themselves at capacity of the roadway regardless of the surrounding socio-economic data.Linear models, with the associated logarithmic transformations, are shown in Table 1. The transformations, as mentioned, are used to adjust the data to improve the model fit. The use of logarithmic transformations in transportation is prevalent in safety analysis [1, 17] and household travel survey and data [18, 19].
|
2. Data Collection
- The purpose of this paper is to determine if there is an advantage to including a logarithmic transformation versus a using a basic linear model to predict average daily traffic from a collection of socio-economic variables. The data necessary to support the development of the models were collected and managed using ArcGIS. The database contained roadway characteristics (number of lanes and functional classification) as well as population (obtained from the Census Department), retail employment and non-retail employment for specific business locations obtained from an employment database purchased by the individual communities as part of the long range travel model update.The traffic count values, dependent variables, were available from the Alabama Department of Transportation’s roadway count program. The socio-economic data were collected using a 0.25 mile buffer around the count location. To quantify the roadway functional classification for inclusion in the linear models, the following convention was used:Collector road = 1,Minor arterial = 2, andPrincipal arterial = 3.This convention was selected as the highest functionally classified roadway would have the greatest value and this should have the desired effect that the parameter for this variable would be non-negative. Additionally, is should be noted that freeways and interstates were explicitly not included in the study or model development because the surrounding socio-economic variable would not be relevant for these roadways because they would not have access to the facilities due the controlled nature of the roadway system. The direct demand forecasting models were therefore developed using the following convention:The response (dependent) variable is:Traffic volume; AADT.The predictors (independent) variables are:-Function classification of the road; FCLASS.-Number of lanes; LANE.-Population within a 0.25 mile buffer around a traffic count station; POPBUFF.-Retail Employment within a 0.25 mile buffer around a traffic count station; RETAILEMPBUFF.-Non-Retail Employment within a 0.25 mile buffer around the traffic count station; NONRETAILEMPBUFF.
3. Model Development
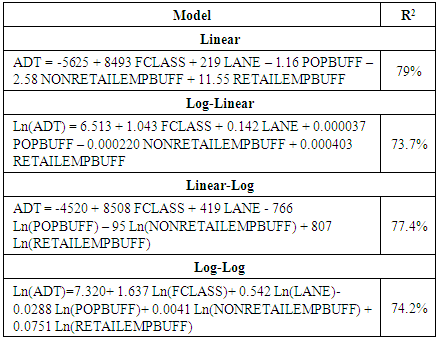
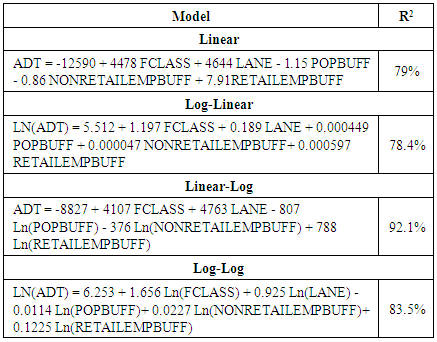
- Linear regression and the logarithmic transformation were used in this study to produce the direct demand AADT forecasting models for the communities of Gadsden, AL and Montgomery, AL. All the statistical analyses were conducted using Minitab and in accordance with standard statistical methodologies [20]. Regression analysis was selected as this methodology is used to predict the value of one or more responses, AADT in this study, from a set of predictors, roadway and socio-economic variables. It can also be used to estimate the linear association between the predictors and responses. R2 is the coefficient of multiple determinations and indicates the proportion of the variability in the observed responses that can be attributed to changes in the predictor variables [20]. For the communities studied in the work, the four models developed for Montgomery are shown in Table 2 and the four models developed for Gadsden are shown in Table 3.
|
|
4. Model Transferability
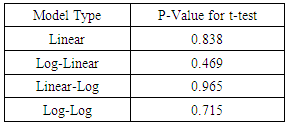
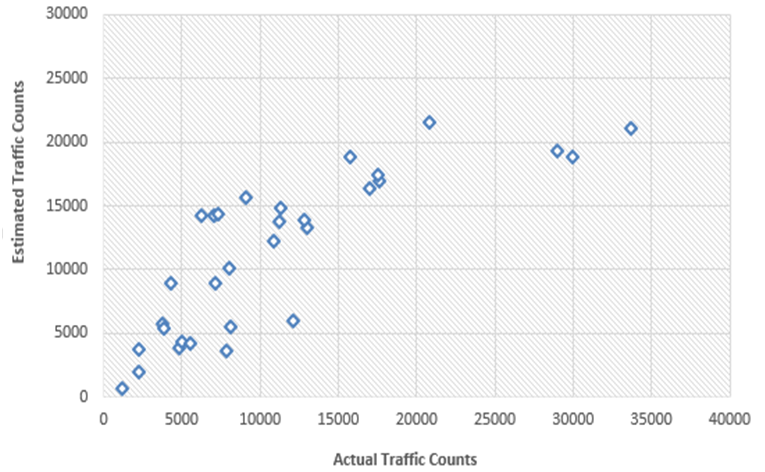
- The transferability of the models to similar sized communities in the state was also tested to ensure the models would be applicable to other locations and that individual models would not have to be developed for every community. Huntsville, AL was used as the transferability community for the Montgomery models. A paired T-test was performed to test the model result of the forecasted traffic volume in Huntsville versus the actual traffic volumes for roadways in Huntsville. The P-values for the different models are shown in Table 4.
|
|
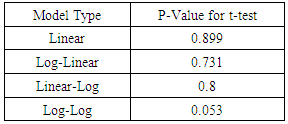
 | Figure 1. Comparison of Actual and Estimated AADT for Huntsville Using Montgomery’s Linear-Log Model |
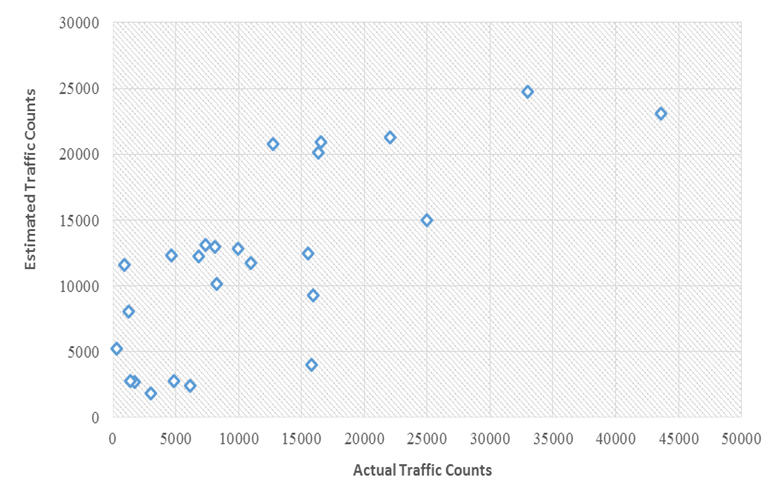
 | Figure 2. Comparison of Actual and Estimated AADT for The Shoals data Using Gadsden’s Linear-Log Model |
5. Conclusions
- This paper examined the development and testing of a linear model and three logarithmic transformations techniques as models to estimate traffic volumes from a collection of roadway data and socio-economic factors near a location where an estimate of traffic volume is desired. The data selected for model input included the total number of lanes on the roadway, roadway functional classification, population, retail employment and non-retail employment within a 0.25 mile buffer of the count location. The logarithmic transformations were defined as log-linear, linear-log and log-log. The different models developed in this work, four for a medium sized area (population roughly 300,000) and four for the smaller area (population roughly 80,000), were tested statistically.The results of this work indicate that the linear-log model (Ln Y = a + b X) had the best combination of statistics for the community developed and the best transferability to the similar community. The use of this model is the best for estimating traffic volumes using the data presented in this work. The transferability scatter plots indicate that the model for the smaller communities had better results. Whether this was from the size of the community or the similarity of the community is unknown. Also, the models results tended to be better at lower volume roadways, which is not necessarily a poor result as the lower the volume the roadway the less likely it is to have a count or to be included in a community count program. Overall, the ability of the model represents a significant time and cost savings as a means to estimate traffic volume that would be suitable for safety analysis, maintenance scheduling, capacity analysis, as well as other transportation system analyses.
ACKNOWLEDGEMENTS
- This paper was made possible by funding provided by the Alabama Department of Transportation, Project Number SPR-0001(058); CPMS Number 1000662945.