Afaq Khattak1, Jiang Yangsheng2, Hu Lu3, Zhu Juanxiu1
1School of Transportation and Logistics, Southwest Jiaotong University, Chengdu, China
2Professor and Head of Traffic Engineering Department, School of Transportation and Logistics, Southwest Jiaotong University, Chengdu, China
3Post Doc Candidate, Department of Industrial and Systems Engineering, National University of Singapore, Singapore
Correspondence to: Afaq Khattak, School of Transportation and Logistics, Southwest Jiaotong University, Chengdu, China.
| Email: |  |
Copyright © 2016 Scientific & Academic Publishing. All Rights Reserved.
This work is licensed under the Creative Commons Attribution International License (CC BY).
http://creativecommons.org/licenses/by/4.0/

Abstract
Modeling and Discrete-Event Simulation (DES) is usually used in the planning, design and control of traffic and transportation systems. The existing design code for analysis of metro transit station walkways ignores the randomness of passenger arrival and service time of walkways. Moreover the existing analytical approach for analysis is highly complicated and leads to challenging problems. The study reported in this paper details a new DES approach for the analysis of metro transit station walkway considering both the randomness in passenger arrival process and service time of the walkway. The metro transit station walkway is considered as a state-dependent, finite capacity queuing system with the passenger arrival and walkway service process based on the Phase-type (PH) distribution. The three necessary performance measures are obtained by developing a DES model of walkway in SimEvents software. The DES results are then compared to the analytical model for the verification purpose. Moreover, the numerical experiments are conducted to assess the differences in the result of the new DES model and the existing models for different walkway configuration. This research provides a new and simplified approach for the analysis of walkways at metro transit stations.
Keywords:
Queuing System, Discrete-Event Simulation, Metro Transit Station, Walkway
Cite this paper: Afaq Khattak, Jiang Yangsheng, Hu Lu, Zhu Juanxiu, Modeling and Simulation of Metro Transit Station Walkway as a State-dependent Queuing System based on the Phase-Type Distribution, International Journal of Traffic and Transportation Engineering, Vol. 5 No. 5, 2016, pp. 103-111. doi: 10.5923/j.ijtte.20160505.01.
1. Introduction
A metro transit station is an operational system consisting of a framework of infrastructures, facilities, personnel which collectively provide services to passengers. Metro transit stations are points of connection between arrivals and departures. It must ensure an easy transition from a system of continuous arrivals (which is the passenger flow) to a system of discrete departures (which are the scheduled trains).Queuing occur, usually in case when there are insufficient resources at metro transit stations. The service facilities (ticket service facilities, elevators, stairways, walkways, escalators, platform and etc.) at metro transit stations are often of finite capacity, which means that there is limited space available or limited number of facilities for passengers to get services from the service facilities. The performance assessment of these service facilities may tell us something about the mean (average) time that the facilities will be in use, or the mean time that a passenger have to wait. Information of such important performance measures can help the planners and designers to make intelligent decisions regarding the demand and capacity as well as when and how to upgrade the service facilities. The Transit Capacity and Quality of Service Manual (TCQSM) [1] for the planning and design of metro transit station service facilities considers the passenger arrival process (or arrival rate to service facility) and service time (time spent in getting services) of service facilities as deterministic under a given Level of Service (LOS). It means that the service facilities are considered as a D/D/1/C queuing system. The design manual neglects the variation in passenger arrival rate (demand variation) and fluctuation in the service time of the service facilities. Therefore; a new technique is of urgent importance that takes into account randomness in passenger arrival process and service time of service facilities. To narrow the scope of the study, our paper covers only the walkway facility at metro transit stations.Studies have been conducted in the past using both analytical queuing models and simulation techniques to assess the performance and optimize the service facilities at metro transit stations. Jiang et al. [2] for the first time modelled the metro transit station walkway facility as a M/G/1 queuing system with the passenger arrival process based on the exponential distribution and a service time the walkway based on the general random distribution. Ying et al. [3] developed a queuing simulation model for the ticket windows of the metro transit station and optimized the number of ticket windows by considering different parameters. Jiang and Lin [4] developed a Discrete-Event Simulation (DES) model for performance evaluation and optimization of the Ticket Vending Machines (TVM) at metro transit stations using the log-normal distribution for fitting the arrival interval and gamma distribution for fitting the TVM service time. Xu et al. [5] analyzed the Metro transit station Capacity (SSC) as M/G(n)/C/C state dependent queuing network. A new concept according to the gathering and scattering process was defined. Cruz et al. [6] and Khalid et al. [7] established an M/G/C/C state-dependent DES model for pedestrian flow in corridors and network of corridors.Jiang et al. [8] established a G/G(n)/C/C state-dependent simulation model for the optimization of the metro transit corridor width under the different LOS of the corridor. They have used a gamma distribution to fit the arrival process of passengers and log-normal distribution to fit the service process of the corridor.From the review of advanced stochastic processes study, we found that the Phase-Type (PH) distribution has substituted the exponential distribution in several fields including; the queuing systems, manufacturing processes and communication systems. The reason to use PH distribution for fitting the arrival interval and service time in queuing system is its own apt analyticity, universality, and computability [9]. Theoretically, it can be fit to any positive random number infinitely that resulted in the emergence of ample PH-based queuing models including PH/PH/1/C by Alfa and Zhao [10] while Jiang et al. [11] for the first time applied the PH distribution to fit the passengers’ flow arrival interval distribution at metro transit station that has revealed a good data fitting effect. It has opened the way for using PH distribution in the field of traffic and transportation. Reijsbergen et al. [12] proposed a methodology of constructing stochastic performance model for public transportation network using PH distribution. Hu et al. [13] presented an analytical PH/PH(n)/C/C state-dependent queuing model for the analysis and design of metro transit stations walkway. The state-dependent analytical model of metro transit station walkway is highly complicated and the closed form solution for performance assessment requires some advanced study of stochastic processes and numerical analysis for problem solving. None of the researchers so far considered DES approach based on PH distribution for the analysis of metro transit station walkways. Therefore; in this study, we model and analyze the metro transit station walkway using the DES approach. DES is the computer evaluation of Discrete-Event Dynamic system models in which chronological sequence of events represents the operation of system [14]. The SimEvents software offers an integrated setting for modeling dynamic systems that contain discrete-event, and discrete and continuous-time components. By SimEvents, the development of a DES model to simulate the flow of passenger through a metro transit station walkway and performance evaluation is possible. In this paper, we develop the metro transit station walkway DES model using PH distribution to evaluate the performance measures. The performance measures obtained by the DES model are then compared with analytical model to assess differences in results.
2. Mathematical Background of PH Distribution
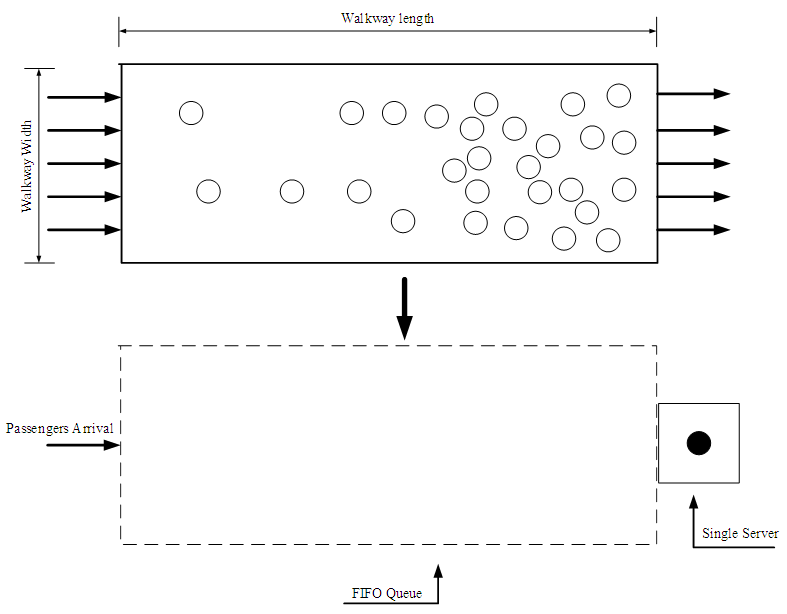
Before, going into the details of PH/PH(n)/C/C DES model based on PH distribution, we first give a brief introduction to PH distribution. PH distribution has been used in queuing modeling in the past because of its versatility and powerful applicability to the solution of various stochastic models that are based on Matrix analytic methods [13]. Phase-Type distribution was introduced first by Neuts [15]. The PH distribution is a probability distribution that is constructed by convolution of exponential distributions. It results from the system of one or more interrelated Poisson processes occurring in phases. The distribution is represented by a random variable that describes the time until absorption of Markov process with 1 absorbing state. Let a Continuous-Time Markov Chain (CTMC) as shown in Figure 1 with state space 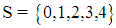 where
where  states are the transient states represented by white circles and 0 is the absorbing state represented by a black circle. The
  represents rate of transition from one state to another state.
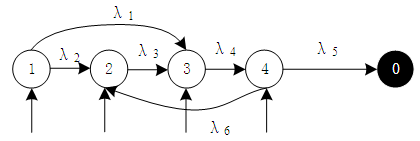 | Figure 1. CTMC representations of phase-type distributions |
It has initial state probability vector
 with
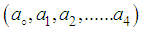
with  and infinitesimal generator matrix Q given by Eq. (1);
 | (1) |
Where T is a  Matrix and rows in T Matrix must sum to 0. Where T° is given by Eq. (2);
 | (2) |
1 represents a column vector of all 1’s.
3. Description of Walkway as a Queuing System
3.1. Passengers’ arrival Process
The passengers’ arrival process to the metro transit station walkway is specified by the first and second moment of the inter-arrival interval. More specifically, the arrival rate  and
and  are the traffic descriptors that describe the passenger traffic flow. During the planning and design phase of metro transit stations
  and
and  can be deduced from peak hour volume (q), peak-hour factor
  , mean headway (h) between trains and squared-coefficient of variation of headway
  . The peak hour factor can be calculated by using Eq. (3).
  | (3) |
Where; q: Peak-15 minute flow rate. The arrival rate can be obtained by using peak-15 minute flow rate given in [1] by Eq. (4) | (4) |
The value of  can be calculated by different ways [11]. If only peak-hour factor is available, then
  can be calculated using Eq. (5)
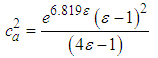 | (5) |
If headway (h) and  between the trains are available, then
  can be calculated by using Eq. (6)
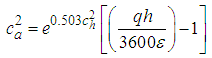 | (6) |
When the number of passengers increases on the metro transit station walkway; the mean and standard deviation of their speed decrease because the number of passengers on the walkway are limited to walkway capacity ‘C’. The speed decreases approximately to 0 when the number of passengers is  . Here
  is the density of passengers on the walkway [16]. According to traffic flow theory; the flow rate (
 ) is given as follows;
 | (7) |
In case of the metro transit station walkways, flow rate is the number of passengers passing through the walkway section per second. The reciprocal of flow rate  is referred as the time interval of the passengers leaving the walkway. This time interval
  is the service time of the walkway. The service time is expressed as
  . Therefore; the state-dependent service time of the walkway is actually due to state-dependence of passengers speed on that walkway. The state-dependent passengers speed
  and squared coefficient of variation
  of the walkway is given by Eq. (8) and Eq. (9) respectively;
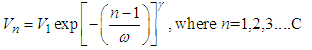 | (8) |
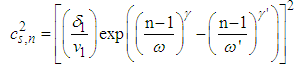 | (9) |
Where;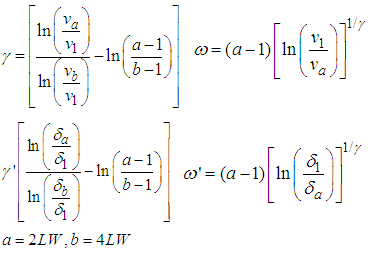 The values of
  are the mean and standard deviation of speed when there is only one passenger on the walkway. The values of
  are the mean value and standard deviation of speeds for
  passengers on the walkway respectively. The values
  are the mean value and standard deviation of speed for
  passengers on the walkway respectively. The values
 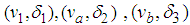 are the representative points for calculation of state-dependent service rate given by Hu et al. [13].The passengers after entrance to walkways occupy the spaces. Each space on the walkway act like a server and passenger flow is represented by arrows in Figure 2. Since, the capacity of the walkway is C, thus there are C servers that provide the services to the passengers on the walkway. Hu et al. [13] have achieved good fitting for arrival interval to metro transit stations as well as for state-dependent service time of walkway using the PH distribution with any coefficient of variation. Therefore; in this research, we use the PH distribution to fit the arrival interval and state-dependent service time of the walkway and the passengers-walkway system can be described as PH/PH(n)/C/C state-dependent queuing system. In order to simplify the multi-server passengers-walkway queuing system, the C servers are equivalently transformed to single server with an average service time interval equal to
 . It means that PH/PH (n)/C/C queuing system is also equivalently converted to PH/PH (n)/1/C queuing system as shown in Figure 2. The average state-dependent service rate of walkway can now be written as Eq. (10) and squared coefficient of variation
  can be obtained from Eq. (9).
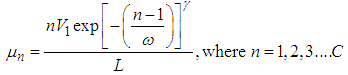 | (10) |
 | Figure 2. Abstraction of metro transit station walkway as queuing system |
4. Fitting PH Distribution to Arrival and Service Process
As discussed in the previous section,  are two parameters that describe the arrival of passengers to the walkway whereas the other two parameters that describe walkway state-dependent service process specified by
 . The PH distribution for arrival and the services processes is represented by an initial probability vector
  and a Matrix
  and
and  respectively.Arrival process:
  Service process:
  The parameters
  can be calculated by using
 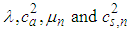 under certain conditions that are described [18] and [13] given in Table 1.
Table 1. Conditions for Phase-Type (PH) Distribution
 |
| |
|
5. Discrete-Event Simulation Model Architecture
The DES approach based on the PH distribution involve the generation of random variates from the PH distributions. Neuts [15] proposed a ‘Play and Count’ approach for the generation of PH random variates. The DES approach eliminates the need to solve large matrices and equations as in analytical approach in order to estimate the performance measures.
5.1. Generation of Phase-Type (PH) Random Variates
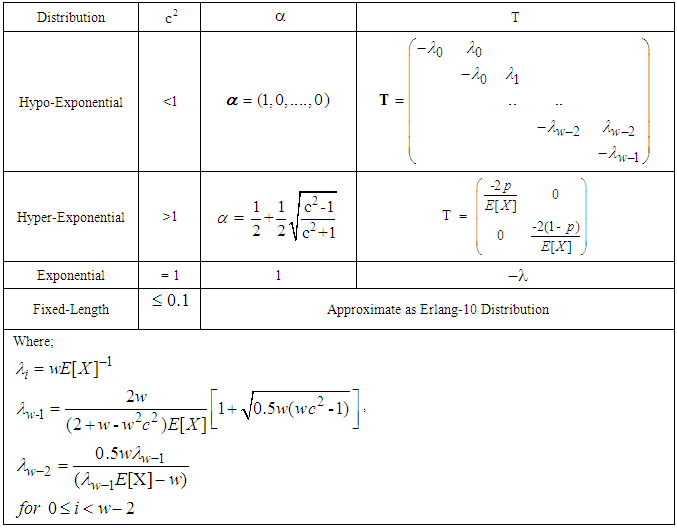
The Neuts [15] procedure relies on generating an Erlang-distributed sample with degree f and parameter given as:
 Where, U is uniformly distributed random number [0, 1]. Let
  represent the row vector with 1 at the position
  . A pseudo-codes description of the PH random variates used in this work follows:
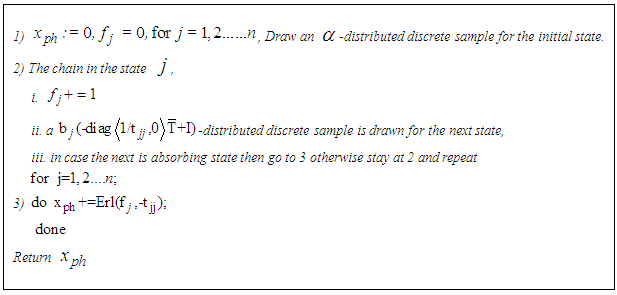 Figure 3 is a SimEvents model of the metro transit station walkway consisting of two phases, i.e., passengers’ generation phase; state-dependent service phase. The SimEvents software is a "queues and servers" style DES extension of the MATLAB® product family.
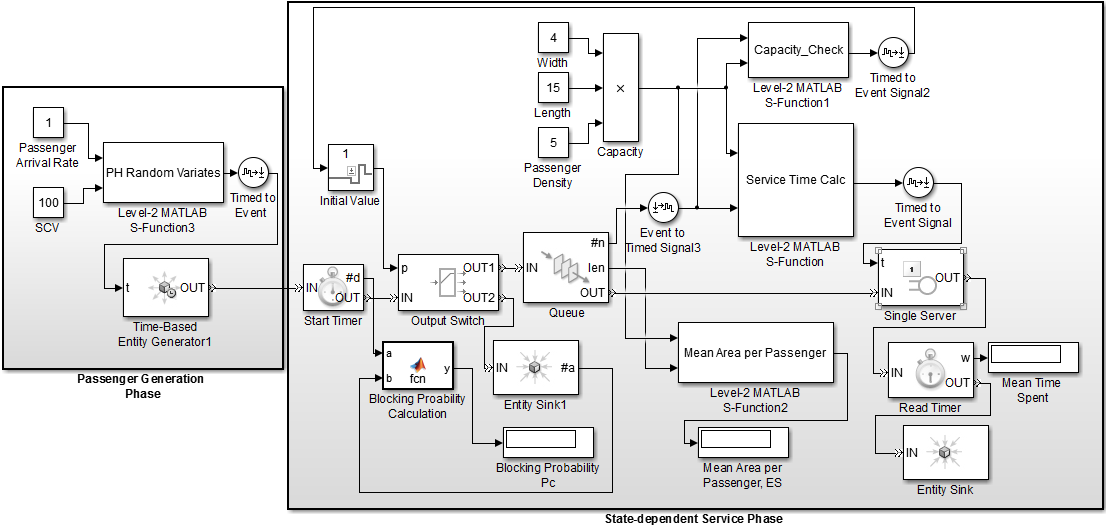 | Figure 3. SimEvents Implementation of metro transit station walkway |
The main components of the scheme are a FIFO queue representing the queueing space, Single-Server, Start timer and Read Timer and Level-2 MATLAB® S-function blocks that compute and updates the different parameters in the model. In addition to the main blocks, there are two Gateway blocks used in DES model, i.e., Event to Timed Signal blocks and Timed to Event Signal. They adapt event-driven imperative and the time-driven declarative environments of SimEvents respectively. The Timed to Event Signal Gateway block output and input signals are identical. But output signal from this block can now be used as an input to the blocks that require event-based input signals. Similarly; Event to Timed Signal Gateway block output signals can be used for the time-based dynamics modeling. It gives a single value at given time instant on the simulation clock. Similarly; Constant blocks and Display blocks are used in the model to input different values and show the results respectively.
5.2. Passengers Generation Phase
The Level-2 MATLAB® S-function block at the passengers generation phase computes the PH random variates to initiate the simulation process using procedure given by Neuts [15]. The two input parameters for the computation of PH random variates are mean arrival rate  and squared coefficient of arrival rate
  that can be calculated from Eq. (4) Eq. (5) and Eq. (6) respectively. The DES model generates passenger using the Time-Based Entity Generator block by intergeneration time from its ’t’ port.
5.3. State-Dependent Service Phase
It must be guaranteed that the number of passengers that enter the walkway does not overcome its overall capacity . The passengers arriving at the end of walkway form a queue and wait for the free spaces (servers). At the same time they reduce the walkway available spaces and affect the walking speed of passengers crossing it.To implement this condition, the generated passengers are stored in the FIFO Queue block before being delayed by the Single Server block and subsequently being sent to the Entity Sink. There are four Level-2 MATLAB® S-function blocks in state-dependent service phase that computes the state-dependent service rates based on PH random variates, average area occupied per passengers, blocking probabilities and judge the number of passengers to prevent them from entry when maximum capacity
  has been reached. The service rate depends on congestion of the area. The block takes capacity and passengers queue length value as input to compute the state-dependent service rate
  and state-dependent squared coefficient of variation of service rate
  using Eq. (10) and Eq.(9) respectively. The Digital Clock and IC blocks are used in the computation of throughput values.
6. Computational Experiments
6.1. Verification of PH/PH(n)/C/C DES Model
The experiments are conducted to verify the accuracy of our PH/PH(n)/C/C DES walkway model. For this purpose, the performance measures obtained from the PH/PH(n)/C/C DES model are compared to the performance measure obtained from the analytical model given by Hu et al. [13]. In order to test the PH/PH(n)/C/C DES Model, uni-directional peak passengers flows  are taken as 0.21, 0.34, 0.4 0.67 1.25, 1.79 (ped/sec) with the squared coefficient of variation of arrival process
  3.24, 4.29, 2.36 1.82 2.05, 2.91, respectively that are according to the actual conditions of the metro transit station. A 30 x 2 m2 horizontal walkway is considered for all the experiments. It should be noted that the width of the walkway is effective width and actual width can be obtained by adding 0.5m buffer on both sides that is according to the TCQSM. Three important performance measure of walkway such as, average number of passengers on the walkway E[N], average area occupied per passenger ES and average time spent by passengers on the walkway E[T] are calculated. The results of PH/PH(n)/C/C DES models are obtained after 10 replications with the 20,000 time unitsThe average relative error of PH/PH(n)/C/C DES is 2.1% for the average number of passengers on the walkway E [N], 2.9% for the average area occupied per passenger ES and 3.2% for average time spent by the passenger on the walkway E[T]. The comparison shows that PH/PH(n)/C/C DES model has a smaller average relative error and indicates that PH/PH(n)/C/C DES model can be used with good accuracy in performance evaluation of metro transit station walkways. It has been observed that the average number of passengers on the walkway E[N] increase with the increase of passengers’ arrival rate
  as shown in the Figure 4.
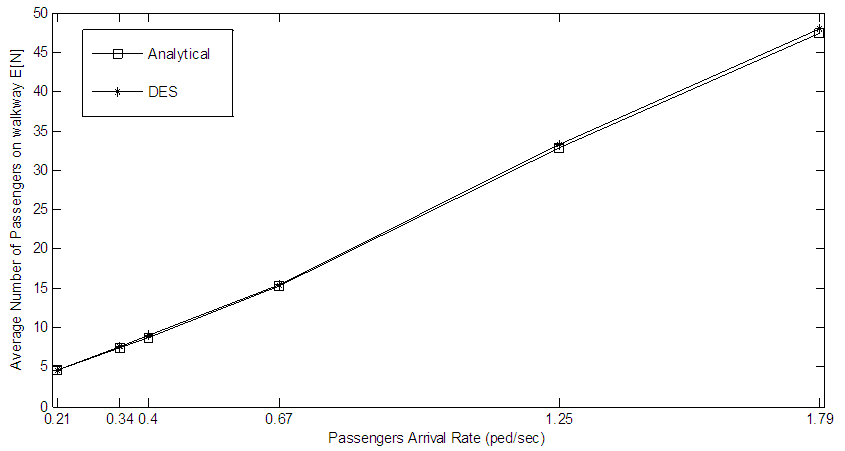 | Figure 4. Average Number of passengers on walkway |
Similarly; the average area occupied per passenger ES decreases with the increase in the arrival rate shown by Figure 5. It is because of the fact that more and more passengers occupy the spaces on walkway thus reducing the distances among themselves. The average time spent by the passengers on the walkway E [T] increases with increase in arrival rate. It is quite obvious that increase in number of passengers due to high arrival rate results in decreasing walking speed of passengers and thus passengers spend more time on the walkway to travel from one end to another end as in Figure 6. 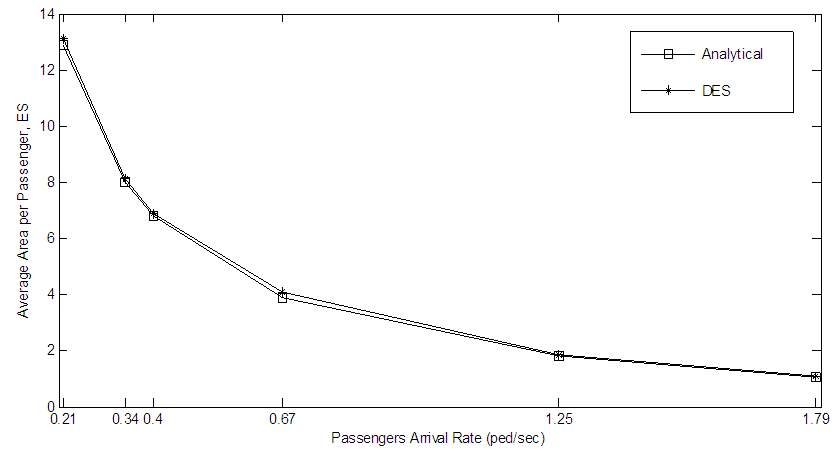 | Figure 5. Average area occupied per passenger |
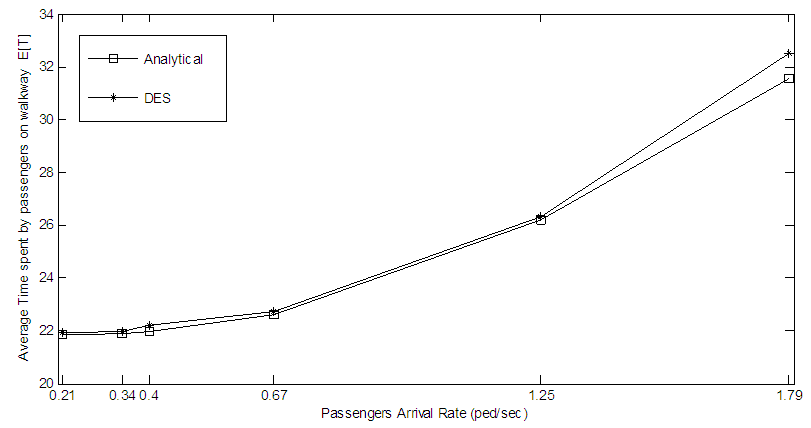 | Figure 6. Average time spent on the walkway |
6.2. Comparison with the Existing Models
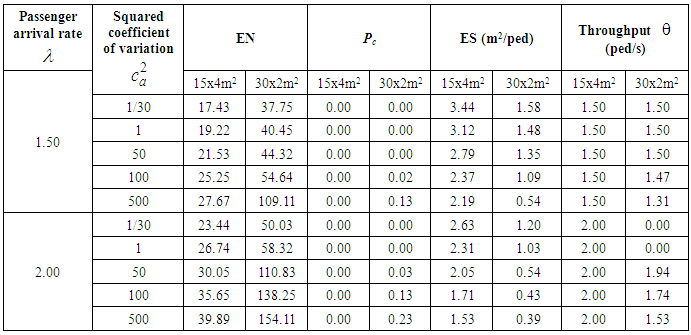
Table 2 provides the comparison of performance measure of the walkway estimated by using and PH/PH(n)/C/C DES model and existing analytical M/G(n)/C/C [6] and D/D/1/C queuing model [1]. Two different sizes of walkways, i.e., 30x2m2 and 15x4m2 are considered for the experiments. The passengers arrival rates  and
and  ped/sec and
  = 50, 100 and 300 are chosen according to the actual range in metro transit station. The three representative points for walking speed on walkway are
 ,
,  and
and  respectively Hu et al. [13]. For comparison purpose, the performance measures of walkway such as, average number of passengers on the walkway E[N], average area occupied per passenger ES, blocking probability Pc and Throughput
  are estimated. In TCQSM [1], the walkway is analyzed by using fixed-length distribution. It means that the analysis procedure in the TCQSM uses fixed arrival rate and a fixed service time which is similar to D/D/1/C analytical queuing model Hu et al. [3]. The
  is equal to 1/30 (0.03). Moreover, existing model based on the exponential distribution, i.e., M/G(n)/C/C uses c2=1.
Table 2. Comparison of PH/PH(n)/C/C DES model with the existing models
 |
| |
|
The first thing to note that the E[N] increases with increase in arrival rate which is quite obvious as higher the arrival rate, higher the number of passengers on the walkway. It is also observed that with increase in  , E[N] and Pc increase while E[S] decrease. It is expected because of the fact that PH/PH(n)/C/C DES model accounts for randomness of passengers arrival rate as well as randomness and state-dependence of circulation facilities service time compared to M/G(n)/C/C and D/D/1/C model. Similarly, the blocking probability Pc increase with increase in
  . The higher
  results in increase in E[N] but since the capacity of walkway are limited to C, thus the passenger flow is blocked.
7. Concluding Remarks
In this study, metro transit station walkway DES model based on PH distribution was constructed to evaluate the performance of metro transit station walkways. The developed model analyzed the system quite well and achieved the accurate results. The planners and designers of metro transit station can use this model for performance assessment of metro transit station walkway to make intelligent decisions. Moreover, this DES model is more realistic and simple compared to the analytical approach. It has been observed that the squared coefficient of variation has a significant impact on the performance measure, therefore; enough attention should be paid to it during the analysis of walkways which is neglected by the existing models.
ACKNOWLEDGMENTS
We would like to express our sincere acknowledgment to National Natural Science Foundation of China (Serial No. 51578465), the Chinese government for funding of PhD doctoral program at Southwest Jiaotong University and the colleagues of National United Engineering Laboratory of Integrated and Intelligent Transportation at Southwest Jiaotong University, Chengdu for their support and valuable advices.
References
| [1] | Kittelson, et al., Transit Capacity and Quality of Service Manual. 2003: Transportation Research Board of the National Academies. |
| [2] | Jiang, Y., L. Hu, and L. G, Determined method of subway footway width based on queuing theory. Journal of Traffic and Transportation Engineering, 2010. 10: p. 61-67. |
| [3] | Ying, H., Y. Fengjin, and J. ShouWen. Queuing theory based simulation and optimization of ticket office. in Advanced Research and Technology in Industry Applications (WARTIA), 2014 IEEE Workshop on. 2014. |
| [4] | Jiang, Y. and X. Lin, Simulation and Optimization of the Ticket Vending Machine Configuration in Metro Stations Based on Anylogic Software, in ICTE 2013. 2013. p. 754-760. |
| [5] | Xu, X.-y., et al., Analysis of metro transit station capacity with the use of queueing theory. Transportation Research Part C: Emerging Technologies, 2014. 38: p. 28-43. |
| [6] | Cruz, F.R.B., J. MacGregor Smith, and R.O. Medeiros, An M/G/C/C state-dependent network simulation model. Computers & Operations Research, 2005. 32(4): p. 919-941. |
| [7] | Khalid, R., et al., A Discrete Event Simulation Model for Evaluating the Performances of an M/G/C/C State Dependent Queuing System. PLoS ONE, 2013. 8(4): p. e58402. |
| [8] | Jiang, Y., et al., A G/G(n)/C/C state-dependent simulation model for metro station corridor width design. Journal of Advanced Transportation, 2015. |
| [9] | Hu, L., et al., Hybrid of the scatter search, improved adaptive genetic, and expectation maximization algorithms for phase-type distribution fitting. Applied Mathematics and Computation, 2013. 219(10): p. 5495-5515. |
| [10] | Alfa, A.S. and Y.Q. Zhao, Overload analysis of the PH/PH/1/K queue and the queue of M/G/1/K type with very large K. Asian Pacific Journal of Operational Research, 2000. 17: p. 122-136. |
| [11] | Jiang, Y., et al., PH fitting of the arrival interval distribution of the passenger flow on urban rail transit stations. Appl. Math. Computer., 2013. 225: p. 158-170. |
| [12] | Reijsbergen, D., S. Gilmore, and J. Hillston, Patch-based Modelling of City-centre Bus Movement with Phase-type Distributions. Electronic Notes in Theoretical Computer Science, 2015. 310: p. 157-177. |
| [13] | Hu, L., et al., A PH/PH state-dependent queuing model for metro station corridor width design. European Journal of Operational Research, 2015. 240(1): p. 109-126. |
| [14] | Banks, J., Discrete-event System Simulation. 2010: Prentice Hall. |
| [15] | Neuts, M.F., Matrix-geometric Solutions in Stochastic Models: An Algorithmic Approach. 1981: Dover Publications. |
| [16] | Tregenza, P., The design of interior circulation. 1976: Van Nostrand Reinhold. |
| [17] | Sadre, R. and B. Haverkort, Decomposition-Based Queueing Network Analysis with FiFiQueues, in Queueing Networks, R.J. Boucherie and N.M. van Dijk, Editors. 2011, Springer US. p. 643-699.3 |

 Abstract
 Reference
 Full-Text PDF
 Full-text HTML