-
Paper Information
- Next Paper
- Paper Submission
-
Journal Information
- About This Journal
- Editorial Board
- Current Issue
- Archive
- Author Guidelines
- Contact Us
International Journal of Traffic and Transportation Engineering
p-ISSN: 2325-0062 e-ISSN: 2325-0070
2016; 5(4): 83-90
doi:10.5923/j.ijtte.20160504.01

Non-Pragmatic Data Collection for Road Pavement Damage on Access Road to Residential Estate and the Statistical Analysis Choice
 Abstract
 Reference
 Full-Text PDF
 Full-text HTML
Nasradeen A. Khalifa 1, Alsnose A. 2, Zulkiple A. 1, Roslan Zainal Abidin 2
1Faculty of Engineering Technology, University Pahang, Malaysia
2Faculty of Civil Engineering, Infrastructure University Kuala Lumpur, Malaysia
Correspondence to: Nasradeen A. Khalifa , Faculty of Engineering Technology, University Pahang, Malaysia.
| Email: |  |
Copyright © 2016 Scientific & Academic Publishing. All Rights Reserved.
This work is licensed under the Creative Commons Attribution International License (CC BY).
http://creativecommons.org/licenses/by/4.0/

This is a general theoretical framing of heavy trucks drivers’ behavior expressing the relationship among the different factors of driving behavior. Several sources of information should be used in order to estimate models based on this framework. This study uses the observation method to gather information. The modeling framework integrates these various data sources in addition to costs and environmental data to identify relevant heavy trucks drivers’ behavior that may be related to the risk of Pavement Damage. Overweight trucks are the chief source of road damage due to the stresses inflicted by heavy axle loads, pavement deterioration over time is caused by a compounding of factors; however, traffic loads play a central part in the consumption of pavement life. The research concerns the Malaysia (JKR U2 and U3) roads, in particularly in Ampang. Generally JKR is speaking that the urban area roads divided/design onto 7 categories and one of them are U2 and U3 roads. Problem statement of this research engages from the issues arising from that the Malaysian authorities rely on user complaints before taking action on corrective maintenance measures, a reliable Road Maintenance Complaint System (RMCS) is vital as to proper records and organized user complaints. One of the major local inputs to the proposed RMCS and to any other system will be data on truck drivers driving behavior. The most fundamental question to be resolved in this inquiry is: Are they taking home their trucks after the delivery is done, and if they do then what is the best action to prevent this road pavement deterioration driving pattern? It is expected that the research will ascertain the existing road pavement condition, evaluate if links without heavy vehicle traffic, predict the future state of roads over time and under traffic and forecast future effects of maintenance, Finally the research should occur up with the most appropriate traffic mitigation measures which can remedy or influence of heavy vehicle behaviors on road deterioration in the selected residential estates.
Keywords: Data Collection, Pavement Damage, Statistical Analysis for Non-Pragmatic Data, and Variables Scale Measurement
Cite this paper: Nasradeen A. Khalifa , Alsnose A. , Zulkiple A. , Roslan Zainal Abidin , Non-Pragmatic Data Collection for Road Pavement Damage on Access Road to Residential Estate and the Statistical Analysis Choice, International Journal of Traffic and Transportation Engineering, Vol. 5 No. 4, 2016, pp. 83-90. doi: 10.5923/j.ijtte.20160504.01.
Article Outline
1. Introduction
- The heavy vehicle load on the pavement subjects to high stresses causing damage. However, not all tracks have the same harmful effects; the damage to the road pavement depends on wheel loads, number and location of axles, load distributions, number of wheels, tire types, inflation pressure and other factors (Gillespie T.D., 1993). Heavy truckloads are a major source for pavement damage. The size and configuration of vehicular loads together with the environment have an important impact on induced tensile stresses within flexible pavement (Yu H.T., 1998).Damages on the roads are mainly caused by the heavier axle loads associated with large commercial trucks (Croney, 1997). For this cause, every state has legislated a maximum axle load limit and maximum gross vehicle weight to be followed (Rezqallah, 1997). The repetition of load and overloading of heavy trucks allegedly affect the road pavements; the design life of the pavements becomes shorter, although the same quality standard is used during design and construction (Mulyono, 2010), as much research confirms that the Roads have had damaged by heavy trucks, and every researcher has implements different method from another to reach this conclusion, and most of those methods are time consuming, costly, unsecure, can’t be done Individually, and none of them had confirmed when and how these roads got damaged. This paper will present a sample method to measure the road damage and to confirm when and how these roads got damaged.Malaysia is using overseas guideline and standard for designing road facilities. Engineers are using the Arahan Teknik (Jalan) 13/87 and also the Highway Capacity Manual, which is based on the United States road condition in analyzing and designing. However, in Malaysia it has been found that local driving characteristics have an effect on the capacity and performance of traffic (AASHTO, 1993).
2. Problem Statement
- The problem is typical of time-series on pavement Deterioration data sets and statistical analysis choosing Variables such as pavement age and accumulated traffic are usually almost perfectly collinear; the estimated models usually fail to identify the effects of both variables simultaneously on that point are no statistical methods to address the problem because it is a problem inherent to the data set, series data failed to distinguish the result of traffic loading or pavement strength and built up a model that related a roughness to time and pavement age only The survey was grounded on information from 51 pavement sections in the State of Arizona, and the research fails to know those important variables that bear on the deterioration and a preferred statistical analysis approach in this example would consist of pooling all the information together and taking out an estimation approach that takes into account the unobserved heterogeneity between the various pavement sections such approaches are the fixed effects approach and the random effects approach.
3. Research Design
- The research design helps the researcher in the selection of subjects for observation, and in determination of the type of analysis to be used for interpretation of the data. The selection of the research design depends upon the purpose of the study and the conditions under which the study is conducted.The design involves the collection of the data and theory in the consequences of data analysis, whereas the design involves the theory and hypothesis, and the process of designing a research strategy to test them. Research design is a summary of the research study which indicates that what the researcher will learn from writing the hypothesis and its functional implications for the final analysis of data. The research design is the arrangement of conditions for data collection and analysis of data to incorporate relevance to the research; research design constitutes decision regarding what, why, where, when and how concerning an inquiry or investigation question. The data will be collected by using the observation and scale measurement Method (Kothari, 2004).
4. Observation Method
- The observation method research is one of the most popular non-experimental research methods. In research design, observation helps to reduce complexities and to make a research projects more usefully. Observation becomes a scientific tool for data collection, and it serves for a formulated research design. Under the observation method, the information is sought by way of investigator`s own direct observation. The advantage of this process is; information obtained through observations relates to current happenings. The limitations of this process are, the information provided is insufficient, some obstacles created may be for unforeseen factors and may restrict data collection efficiently if related resources are not directly accessible in this research, and the information is collected directly. The quantitative data gathered will be summarized through statistical analysis and will be explained in details, in the chapter 4 of data analysis (Kothari, 2004).The unstructured observation to foreground the importance of context and the co-construction of knowledge between the researcher and the researched (Mulhall, 2003). The reason for using observational methods in this study was to determine whether what participants’ say they do is the same as what they actually do in practice. Unstructured observation (Mulhall, 2003) allows me to capture not only the process of policy implementation but also the context. In using unstructured observation researcher adopted a role as a reactive observer (Angrosino, 2005). Researcher acknowledged that in my role as a reactive observer, researcher was part of the social setting under study (Giacomini and Cook, 2000). Reactive observations are controlled settings and assume that participants are mindful of being observed and are ‘amenable to interacting with the researcher only in response to the elements in the research design’ (Angrosino, 2005). Researcher purposefully chose this role as a researcher because of the useful source of data that this approach may yield, as researcher was positioned as a reactive observer (Angrosino, 2005).Researcher structured my observations by using three procedures as delineated by (Angrosino, 2005) inherent in observational research. In terms of descriptive observation (Angrosino, 2005) researcher tried to eliminate preconceptions and noted (field notes) detailed descriptions of everything that was taking place. Then, researcher employed focused observation (Angrosino, 2005) in which researcher chronologically documented field notes on the observations and materials that were significant to the study, focusing on well-defined categories of pedagogy. Lastly researcher performed selective observation (Angrosino, 2005) of a general nature recording field notes on JKR U2 and U3 Roads; the reflection below indicates some aspects relative to the design of the observation field notes.Though several observational strategies to reactive observation (Angrosino, 2005) are available, researcher chose to locate himself within the JKR U2 and U3 Roads to engage in limited interaction and intervening only when further clarification of actions was needed (Schatzman and Strauss, 1973). Where and when possible, provision was made to setup the equipment prior to trucks entering the JKR U2 and U3 Roads , allowing me to record all data needed from the commencement of the observations. Researcher usually positioned himself at the Centre, so that I could be as unobtrusive as possible. This observation position also presented the opportunity to collect data that satisfied ethical issues of data collection, as researcher could capture the images of trucks without compromising their identity.
5. Documenting Observations: Field Notes
- Researcher utilized field notes (sheet as a formal structure to record field notes) in accordance with (Taylor, S. J., & Bogdan, R. (1998). view that field notes are a primary source of recording observations. Using their behaviors for writing up field notes, researcher addressed two significant issues that had implications for the credibility of the study.Researcher used the two basic approaches to field observation as espoused by (Giacomini and Cook, 2004) namely direct and indirect observations, researcher spent sufficient time in the context of the social milieu under study for direct observation and to record direct observations in the form of detailed field notes.
6. Scale Measurement Method
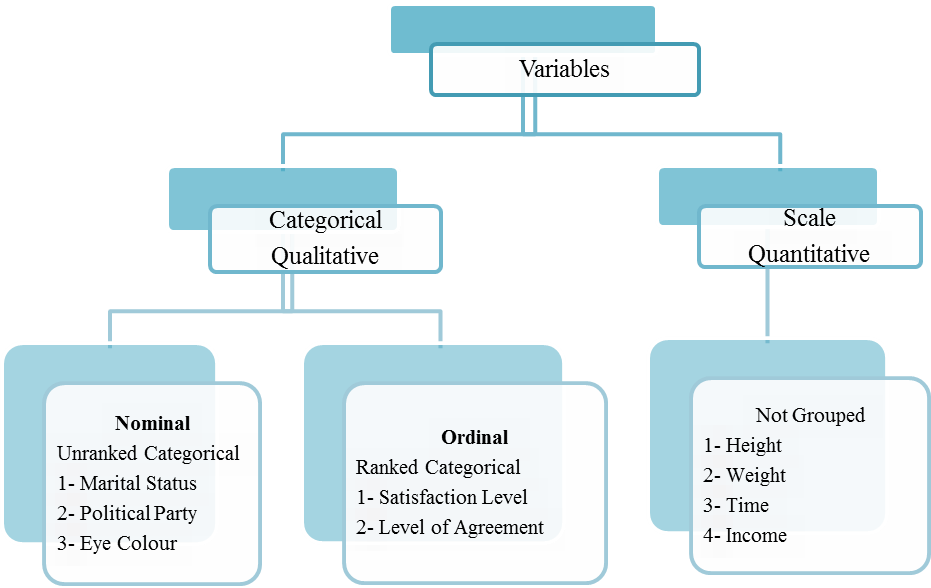
- There are four measurement scales which are nominal, ordinal, interval and ratio. These are simple ways to classify different types of variables; Statisticians often refer to the levels of measurement scale to distinguish between measured variables that have different properties. This study will use the nominal scale as it will help to describe the order, but not relative size or degree of difference between the items measured as shown in Table 1, also nominal scales are typically measured of non-numeric concepts like satisfaction, happiness, and discomfort Figure 1 Flowchart of the Variables.
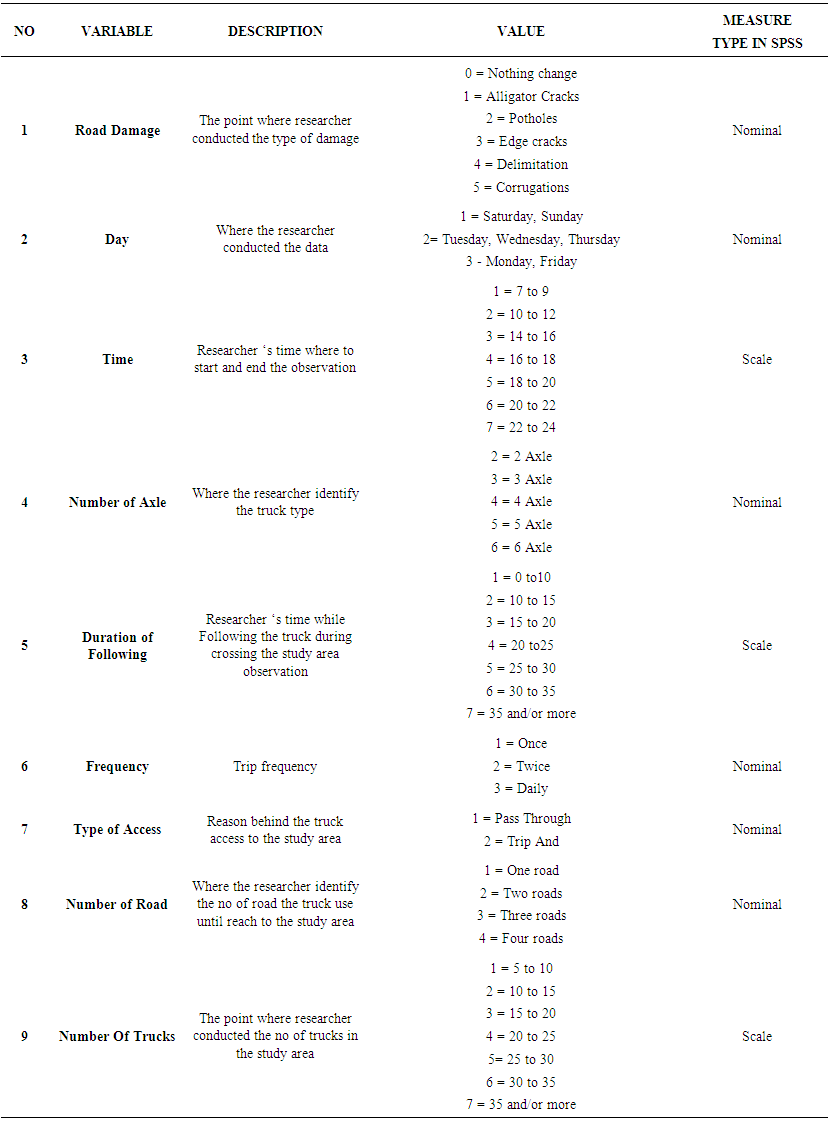 | Table 1. Variables used in the study |
 | Figure 1. Flowchart of the Variable |
7. Theoretical Framework and Model
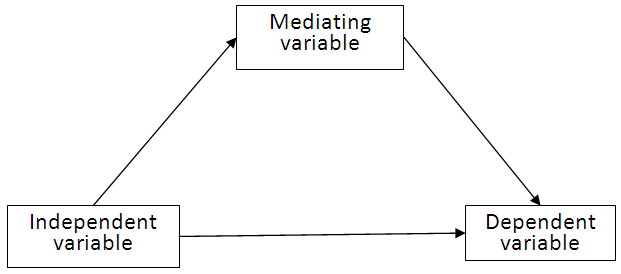
- Dependent variable (DV) is road damage, and its variable of primary interest, the variable need to be explained by eight independent variables of (Duration of Following, Frequency, Type of Access, Number of Road, Number of Trucks, and type of truck), and one Mediation variables of (Day and Time) and also the Dependent variable which is (Road Damage), The theoretical framework identified and labeled the dependent and independent variables, the relationships among the variable were discussed. The set of relationships that would appear in the presence of the mediation are depicted in all different models As can be seen, (Day and Time), expertise mediator the relationship between (Duration of Following, Frequency, Type of Access, Number of Road, Number of Trucks, and type of truck) and (Road Damage), the mediation function of a third variable, which represents the generative mechanism through which the focal independent variable is able to influence the dependent variable of interest (Baron & Kenny, 1986).
8. Approach of Testing for Mediating Variables
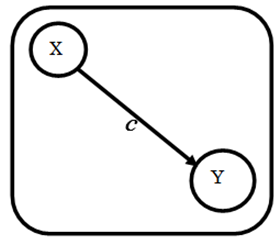
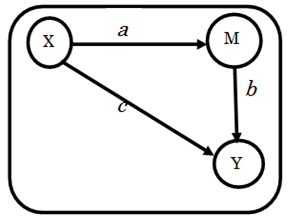
- The theory starts with the observed relationship between an independent variable (X) and a dependent variable (Y) such as indicated in Figure 2.
 | Figure 2. Mediation model with mediating variable located between independent and dependent variables |
8.1. Mediation Analysis
- The role of the study is to establish the influence of independent variables on dependent variable postulating model in which intervening variable is located casually between independent and dependent variable. The intervening variable is also known as mediating variables that are conceptualized as a mechanism through which independent variables influences the dependent variable.Researchers like (Hayes, 2008; Levine and Murnen, 2009) mentioned that the direct effect from independent to dependent variable and another indirect effect through mediator is extremely common in all disciplines. According to (MacKinnon, D. P., et al, 2002) mediation analysis approaches to quantifying and testing hypothesis about direct and indirect effects of independent variables on dependent. Mediating analysis consists of tests of the action theory, conceptual theory and test of action by which the test of the process changes the mediating variable which then changes the dependent variable (MacKinnon, 2012).
 | Figure 3. Direct Relationship |
 | Figure 4. Mediated Relationship |
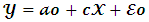 Consistent with the notation in Figure 3, Y is the dependent variable of interest, X is the independent variable of interest, c is a coefficient estimate of the effect of X on Y,
  is a coefficient estimate of the intercept, and
  is the regression error term. If c is statistically different from zero, then the test of whether the effect is direct or mediated can begin the two regression equations are estimated. The first establishes whether there is a relationship between X and M by estimating the following regression equation and testing if the coefficient a is different from zero.
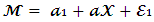 In Equation 2,
  is the estimate of the intercept, and
  is the regression error term. If a significant relationship between X and M exists, then the final step is to determine whether X still affects Y, once controlling for the effect of M on Y. To make this assessment, the following regression equation is estimated:
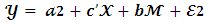 If b is statistically significant, then given that a was statistically significant in Equation 2, the interpretation is that M mediates the relationship between X and Y. Then the estimate of c’ is assessed. If c’ is non-significant, then the interpretation is that M totally mediates the relationship between X and Y. If c’ is statistically significant, then the interpretation is that M somewhat mediates the relationship between X and Y. This method of testing for mediating effects will be referred to as a standard approach throughout this thesis.
 9. Statistical Analysis
- This section profiles analytic methods employed to make sense of the mass of quantitative data that was collected over a period of time. Researcher attempted to provide in depth explanation of the analysis process in order to bring meaning, structure and order to the data. The main focus of data analysis will be to yield congruence between the reality of the phenomena studied and the emergent themes. This study is situated which entrenches the concept that the form of data capture, is ultimately in the form of text. Most data was converted into text, and the text was the primary model for the object of interpretation (Schwandt, 1999).As indicated in a previous section, the data was collected through a variety of method (observation, informal field notes, researcher journals and document reviews). In the final analysis, the data sources for analysis included data collection, this data formed part of ‘a procedure involving the simultaneous and sequential collection and analysis of data’ (Creswell, 2002). Now expand on the data analysis methods employed for all of documented data sources.
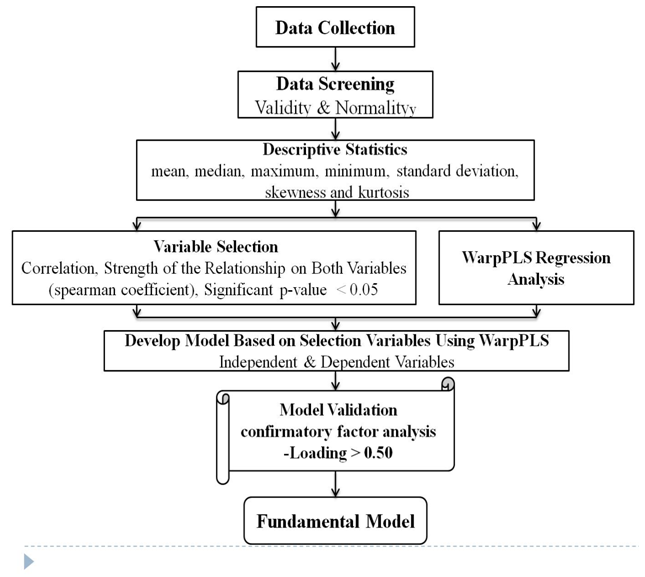 | Figure 5. Model Development Process, Modified from Previous Researcher on Statistical analysis |
10. Research Focus
- • This research paper presents a new method on data collection for road pavement damage for access road to residential estate to meet the needs of local authority. • This research paper guides the research on how non pragmatic data can be statically analysis.• The core objective was to examine whether the model approaches could be adapted for the research environment so that they gain acceptance and enable improvement of the research process.
11. Limitations
- There are several limitations that may arise in this study. The limitations may involve the objectives; samples and data collected. The first limitation is the area of focus. Since that, the general objective of this study has aimed to develop the statistical relationship between heavy trucks and Local Road Damage (JKR-U2 Road). Thus, all of the questions in the observation must be concentrated.
12. Hypothesis
- Hypothesis 1• H0: Road measurement constructs will have no relationship with road pavement damage.• H1: Road measurement constructs will have a positive relationship with road pavement damage.Hypothesis 2• H0: Day and Time have no mediating effect between road measurement and road pavement damage. • H1: Day and Time have a mediating effect between road measurement and road pavement damage.
13. Outcomes
- Research hypothesis is used for the prediction of making decisions using data to determine the probability that a given hypothesis is true, and the test statistics is used to assess the truth of the null hypothesis. Comparing the significant level if p value less than 0.05, real hypothesis is accepted, and the null hypothesis is ruled out.
14. Value of the Study
- The value of this study is described as follows:ü As no study of this nature has been conducted in local road (residential estates) to date, the findings will add value by assisting local organizations in understanding the concepts relating to JKR U2 and U3 (Local Roads) Road Damage, as well as by assisting them in planning and developing their internal training programs.ü The local organizations will benefit from the findings of this study, in that these findings will assist them with their future planning for the implementation of Road maintenance and other training programs.ü The manual observation used in this study will help the MPAJ identify their internal problems or deficiencies.
15. Contribution
- The primary contribution of this research is not the growth of a deterioration model, rather the demonstration of the feasibility of using joint estimation and its many advantages, such as: • Use of a scale measurement method,• Identification and quantification of new variables,• How the road damage data should be collected/arrange • Efficient parameter estimates, • Identification of the JKR U2 and U3 (Local Roads) Roads Damage index when every single variable involved, • The statistics method to be used for Nonparametric Data.
16. Summary
- Discussions in this paper have indicated the perspectives towards road damage that emerged from the findings and how these perspectives can also be linked to the other factors, the MPAJ Skills development and training requirements.While recommendations pertaining to the MPAJ were made in this chapter, it was acknowledged that the perspectives discussed might be applicable to all areas has the environment in general.