-
Paper Information
- Paper Submission
-
Journal Information
- About This Journal
- Editorial Board
- Current Issue
- Archive
- Author Guidelines
- Contact Us
International Journal of Traffic and Transportation Engineering
p-ISSN: 2325-0062 e-ISSN: 2325-0070
2016; 5(3): 73-81
doi:10.5923/j.ijtte.20160503.03

Distribution Changes of Containerized Freights into the U.S. by Maritime Network Capacity Increase
 Abstract
 Reference
 Full-Text PDF
 Full-text HTML
Jaehoon Kim1, Sanghyeon Ko2, Michael D. Anderson1, Abolfazl (Kouros) Mohammadian2
1Department of Civil and Environmental Engineering, University of Alabama in Huntsville, Huntsville, U.S.A.
2Department of Civil and Materials Engineering, University of Illinois at Chicago, Chicago, U.S.A.
Correspondence to: Jaehoon Kim, Department of Civil and Environmental Engineering, University of Alabama in Huntsville, Huntsville, U.S.A..
| Email: |  |
Copyright © 2016 Scientific & Academic Publishing. All Rights Reserved.
This work is licensed under the Creative Commons Attribution International License (CC BY).
http://creativecommons.org/licenses/by/4.0/

The Panama Canal’s expansion, doubling capacity with larger lock systems has attracted attention from logistics business to academia due to its impending initiation date. Also, the Port of Prince Rupert anticipates increased vessel calls from Asian countries with their increased capacity, especially to the Midwest and South Regions of the U.S. In this paper, optimization analysis and assignments on the U.S. highway and rail networks are conducted with consideration of these two capacity expansions. Each project is examined with a focus on container flow and the impact on the rail and truck infrastructure. Differences are visualized by comparing the simulated estimates of each project at different times. Increased and decreased flows are visualized, and all simulations showed meaningful results. The Panama Canal’s expansion shifted flows from the West Coast ports to the Gulf and East Coast ports, and the Prince Rupert shifted more flows to the West Coast ports from the Gulf and East Coast ports.
Keywords: Panama Canal, Prince Rupert, Capacity Expansion, Optimization
Cite this paper: Jaehoon Kim, Sanghyeon Ko, Michael D. Anderson, Abolfazl (Kouros) Mohammadian, Distribution Changes of Containerized Freights into the U.S. by Maritime Network Capacity Increase, International Journal of Traffic and Transportation Engineering, Vol. 5 No. 3, 2016, pp. 73-81. doi: 10.5923/j.ijtte.20160503.03.
Article Outline
1. Introduction
- Container shipments into the U.S. have been increased. Even though sharply declined trade volumes had experienced after the recent economic recession, overall container shipments into the U.S. after 2009 has been caught up with the trade volumes before the recession (1). Recently, it is reported that almost 60% of total imported container weights to the U.S. were exported from six Asian trading partner countries which include China, Japan, Korea, Singapore, Taiwan, and Hong Kong, and 13 U.S. and one Canadian ports received 97% of the total import container cargos from these six countries in 2011 (2). Among the 14 ports, six ports on the Pacific Coast handled 71% of the containers from six Asian countries and other eight ports on the Gulf and East Coast handled 29%.Ocean shipments, especially container shipments proceeding to the Gulf and East Coasts from the Asian countries, have to overcome the geographical issue of passing the Panama Canal. The passage requires additional shipping cost and capacity constraints. The Panama Canal has expanded its facilities and scheduled its new service initiation from 2014 to increase the economies of scale and its capacity (3). Once the canal’s capacity is doubled, larger vessels and more cargos can travel through the Panama Canal, and it is believed that container cargo distribution into U.S. ports on the Gulf and East Coasts will be affected positively. In addition to this, increased container cargo flows have been observed at the Port of Prince Rupert in Canada (4). This Canadian port utilized the shorter ocean shipping time and lower cost than the ones at the U.S. ports on the Pacific Coast and the rail connections from the port to the U.S. regions directly. By 2020, this port will increase its capacity by 2.5 times than the current and it is expected to receive more vessel calls from Asian trading partners connecting to the U.S. Midwest regions. With the expectation that global trade will continue to increase and the expansions at the Panama Canal Port of Prince Rupert, it is important to estimate the import distribution of container shipments into the U.S. and the infrastructure impacted as the containers travel to final destination to maximize the performance of existing and future investments for infrastructure planning. Therefore, in this paper, import distributions of container shipments from the selected Asian partner countries to the U.S. Regions considering capacity expansions of the Panama Canal and the Port of Prince Rupert will be examined under various conditions and the infrastructure impacts will be examined.
2. Literature Review
- In addition to the references discussed in the previous introduction, The Tioga Group, Inc. (5, 6) and Wilson and Benson (7) also analyzed port capacity and global trade in terms of containerized shipments.For the analysis of route selection and optimization, active research and results have been discussed recently. Leachman (8) concluded that the container vessels calling on the West Coast ports are very sensitive to congestion and willing to change the destination port to less congested location. However, once congestion is relieved with infrastructure improvements and lead time is secured, San Pedro Bay is expected to remain its vessel calls from Asia. Levine et al. (9) estimated origin-destination matrix of US import container freight with a linear program using a gravity model based on Transportation Analysis Zones (TAZ) which unit zone is larger than Bureau of Economic Analysis (BEA) unit area. Shintani et al. (10) used a genetic algorithm-based heuristic to solve the Knapsack problem in terms of calling sequences at ports. Lei Fan et al. (11) constructed an optimization model considering vessel size, container shipper route, port, and shipping corridor, and concluded that Prince Rupert is a competitive alternative route for shipments to the Midwest Region while the Panama Canal’s expansion were identified with little impact of container flow. Jula and Leachman (12) estimated the effects of container fees at the San Pedro Bay ports with Analytical model for Long- and Short-run supply chain model. They also introduced a queuing model to estimate container flow time considering volume, infrastructure, staffing level, and operating schedule focusing on Asian shipments coming into the U.S. rail intermodal terminals through the West Coast ports. (13) Wilson et al. (14) evaluated congestion with delay cost functions with a spatial optimization model for grain shipments on the Mississippi River. Lei Fan et al. (15) developed intermodal flow network model to analyze logistic system congestion since most ports observed congestion and capacity expansion is assumed to reduce congestion cost and waiting time. Most recently, Steven and Corsi (16) analyzed port attractiveness for containerized shipments from individual shipment data, port characteristics, and actual freight charges and concluded that larger shippers are more interested in factors affecting delivery speed than charges.However, few studies have analyzed import container freight with optimal route and attributes affecting route choices to the Midwest Region. Since this paper is proposed to analyze import container flow with capacity expansions, optimal container route choice model will be developed before each capacity expansion is discussed and compared at the same time.
3. Methodology
- Maritime and surface transportation modes are mainly considered with cost associated with moving goods from origin to destination. The objective function used in this research determines container flow with the minimum transit cost at selected U.S. ports to ultimate destination.
3.1. Import Container Distribution Network
- The networks of the import distribution are connections of Asian countries, the U.S. ports and the U.S. states. Based on the current container cargo flow between the Asian countries and the U.S. states, ocean, rail, and truck costs are considered for all possible origin-destination (OD) pair routes and optimized the total shipping cost to be the minimum according to assigned container cargo volume on each route with constraints.
3.2. Mathematic Formulation and Constraints
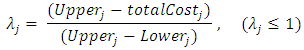
- The purpose of this model is to distribute container freight flow using the least costly route to reach the final destination, subject to a series of constraints. Objective function and constraints for the non-linear optimization procedure are discussed as below. Below is the objective function maximizing auxiliary variable
 which is described in Constraint (1). This auxiliary variable compromises the overall satisfactory level between upper and lower bound at jth objective. There are two reasons why the port location is subjected to optimize the flow network: the first one is that the purpose of this project is to estimate the container freight distribution from Asian countries and the U.S. states through the ports and the second is that the forecasted origin-destination matrix can be estimated based on the global trade trend. Also, it assures the satisfactory level residing between the limits.(Objective Function)
 | (1) |
 | (2) |
 and proportions
  at jth port
  including costs between ith origin and jth port
 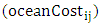 and costs between jth port and kth state
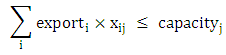
 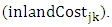 Constraint (3) specifies that the distributed amount from an origin country to a port should not exceed capacity of a port
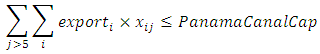
  Constraint (4) is a conditional statement for containers using the Panama Canal to be less than the Canal’s capacity
  (Constraint 2)
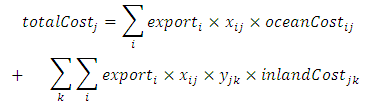 | (3) |
 | (4) |
 | (5) |
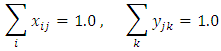
 and destination U.S. states. Lastly, Constraints (6) ensures the total of distribution probabilities becomes one between origin countries and ports and between ports and states respectively.(Constraint 5)
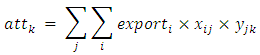 | (6) |
 | (7) |
3.3. Data
- Various datasets are required to estimate optimal container freight distribution from Asia trading partners to the U.S. states. In this part, the variables considered for the model will be discussed including container flows from Asia countries to the U.S. states, capacity of ports and the canal, and ocean, rail, and truck transit costs for OD matrix.
3.4. Container Flow from Origins to Destinations
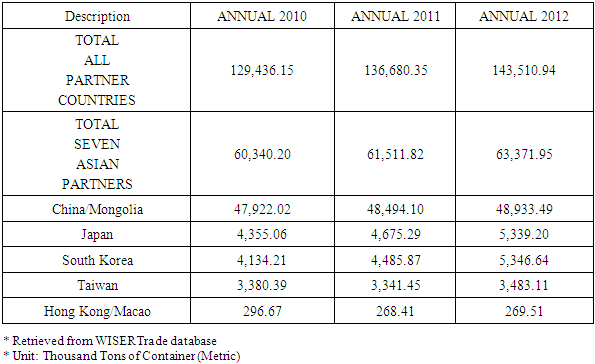
- Among the six primary Asian trading partner countries with the U.S. listed in US DOT report (1), the five countries are selected: China, Japan, Korea, Taiwan, and Hong Kong. From the original list, Singapore is excluded and two more countries of Mongolia and Macao are additionally included. Since, selected seven countries are categorized as ‘East Asian’ group by the United Nations which is referred as one foreign origin region in the Freight Analysis Framework (FAF) dataset. The most recent data for these countries was retrieved from the World Institute for Strategic Economic Research Trade (WISERTrade) database which provides extensive worldwide trade data including the amounts of U.S. import and export by individual port (17). The selection criterion is the containerized cargo weights during 2012 and it is listed in Table 1.
|
|
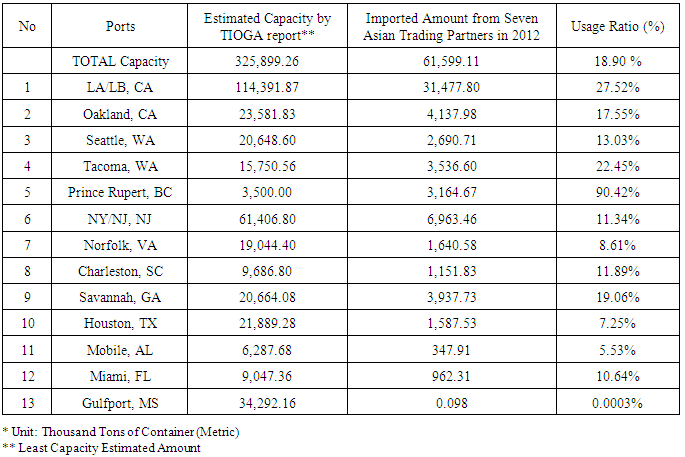
3.5. Capacity of the U.S. and Canadian Ports
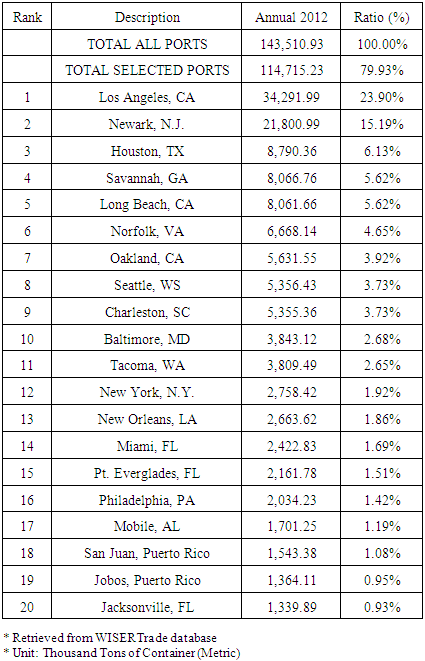
- In 2012, imported container cargo weights into U.S. are 143.51 million tons and the rank of the ports can be listed in Table 3 and selected ports are highlighted in gray. In addition to the selected 13 U.S. ports in this list, Gulfport, MS is subjected to consider in this paper since it represents the state of Mississippi which facing the Gulf Coast. Also, the Port of Prince Rupert in Canada is included due to its capacity expansion.
|
|
3.6. Capacity of the Panama Canal
- Capacity of the Panama Canal is based on the report published by the Panama Canal Authority (3). They reported all the vessel flows with origin and destination regions and total cargo amount. From the report, container flows from the six Asian countries to the Gulf/East Coast are calculated.
3.7. Ocean, Rail, and Truck Transit Cost
- Transit costs for ocean, rail and trucking are estimated based on the distance and the unit cost per mile in this report since every container shipping line carriers and rail companies make contracts with customers and keep the costs as confidential. Also, to the best of the authors’ knowledge with previous research (2), there are few adoptable references to estimate ocean, rail, and trucking costs.
3.7.1. Ocean Transit Cost
- First of all, distance tables from each country to each port are retrieved from the webpage of ‘Portworld’ which provide nautical mile distance from origin ports in Asia to the U.S. ports (21). Unit cost of ocean shipment estimated by Mitchell (20) was implied in this cost estimation. From the obtained data, the distance is multiplied by the cost corresponding to its destination ports and estimated ocean cost is calculated.
3.7.2. Inland Cost
- Rail and highway distance matrix of the U.S. is retrieved from the Oak Ridge National Laboratory database (22). From the “Intercounty Distance Matrix”, distance between counties where locating major U.S. ports and container freight stations are obtained. The distances from the Canadian port to the U.S. states is obtained from distance calculators provided by major railroad companies (CN, BNSF, CSX, UP, and NS). Connection from the port of Prince Rupert to the U.S. states is assumed only with rail network and highway connection is excluded. The unit cost value ($/mile/TEU) is adopted from the WebGIFT (Geospatial Intermodal Freight Transportation) freight model which is provided by Rochester Institute of Technology and the University of Delaware using $0.81/mile/TEU for truck mode and $0.52/mile/TEU for rail mode (23). For the inland shipping cost in our model, the distance multiplies unit cost and using CUBE, the software for transportation demand model, develops travel cost matrix.
4. Model Implementations
- The estimated container freight flow from the seven Asia trading partners to the selected U.S. ports is compared with actual flow retrieved from WISERTrade database as plotted in Figure 1. When the model result is compared to the actual flow, all of the estimated flow to ports is validated almost at 90% level with actual container flow and determined to apply results from this model to analysis of two scenarios. For efficient recognition of the analysis, assignments on the U.S. rail and highway networks are visualized and sample figure is shown in Figure 2. Since valid data for inland flow from ports to states was not available to find, efforts are given to optimization results of this paper.
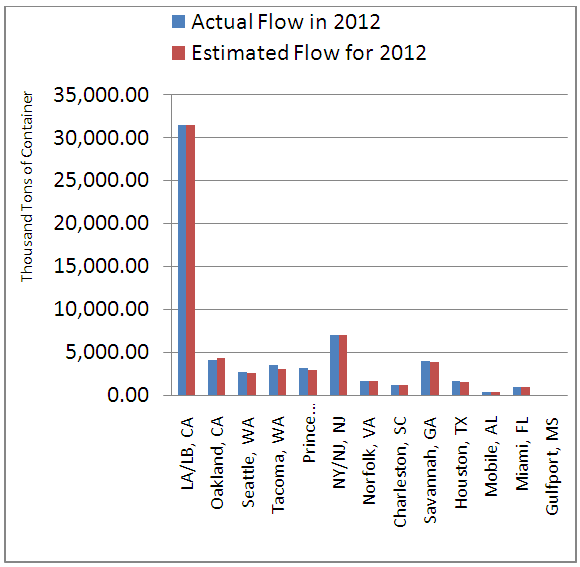 | Figure 1. Actual and Estimated Container Freight Flow from Asia to the U.S. Ports |
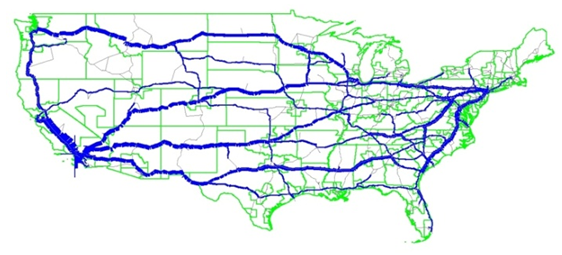 | Figure 2. Assignments of Import Container Cargo through the U.S. rail and highway networks (This Truck network does not show connections from the Port of Prince Rupert) |
4.1. Scenarios Analysis and Results
- By using built optimization model for import container distribution into the U.S., two scenarios are expected to analyze: capacity expansions of the Panama Canal and the Port of Prince Rupert respectively. The expanded Panama Canal is scheduled to initiate its service in 2016 and the Port of Prince Rupert will complete its capacity expansion project by 2020. For closer comparison, the Panama Canal’s expanded case is analyzed under 2019 data and the Canadian port expansion is considered with 2020. Each scenario was simulated with consideration of its project initiation and without its initiation. Then detailed impact of each project can be estimated with its comparison. Also, all other variables are assumed to be increased with 3% rate annually based on several reports and news addressing the increase rate around 3% (24, 25, 26).
4.1.1. Scenario I: Capacity Expansion at the Panama Canal
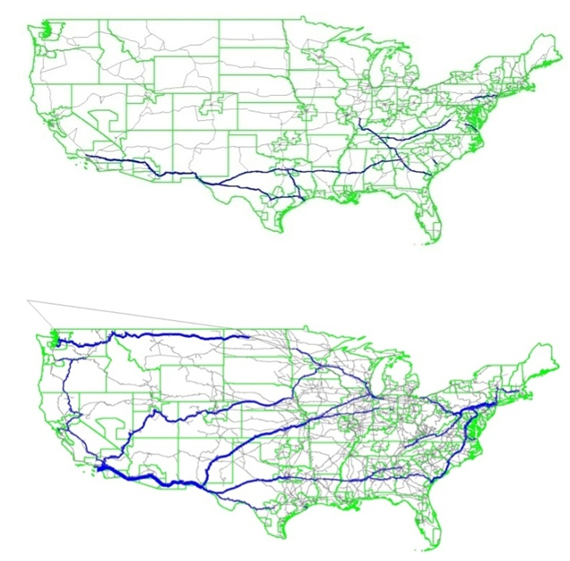
- The first scenario analyzed if capacity expansions at the Panama Canal affect route shift of import containerized shipments. Two modes, rail and truck, are visualized separately showing increased networks and decreased networks.When the time scope is assumed as 2019, if the Panama Canal’s capacity is expanded, Figure 3 shows increased container flow from the Gulf and East Coast ports to South, Midwest, and Northeast Regions. At the same time, significant decrease of container flow, in Figure 4, is observed from the West Coast ports and the Port of Prince Rupert to the Midwest, South, and Northeast Regions. Increased flow can be explained that increased capacity and size at the Panama Canal allowed more and larger vessels to the Gulf and East Coast ports, and shipments destined to the South and Northeast Regions shifted the gateway ports to the nearest port, instead of the West Coast ports. Observed flow from the Gulf Coast port to the West Region is supposed due to commodity’s distinct characteristics. Before the expansion of the Panama Canal’s capacity, there exist consistent flow on this link and the increased amount is believed to stress its trend. Decreased flow would be observed since the shifted flow to the Gulf and East Coast ports decreased flow to the West Coast ports. Rail mode lost its flow volumes from Canada to all Regions in the U.S., and truck mode also showed decreased volume to the Midwest and South Regions.
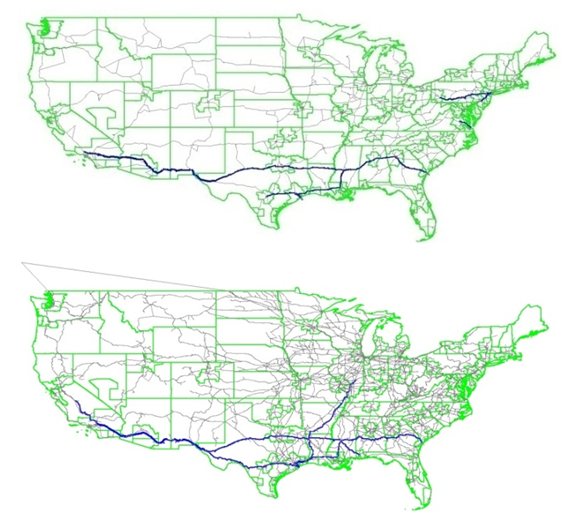 | Figure 3. Increased Container Flow with Comparison between Increased and Non-Increased Capacity at the Panama Canal (* Upper: Truck, Lower: Rail (Same order hereafter)) |
 | Figure 4. Decreased Container Flow with Comparison between Increased and Non-Increased Capacity at the Panama Canal |
4.1.2. Scenario II: Capacity Increase at the Port Prince Rupert
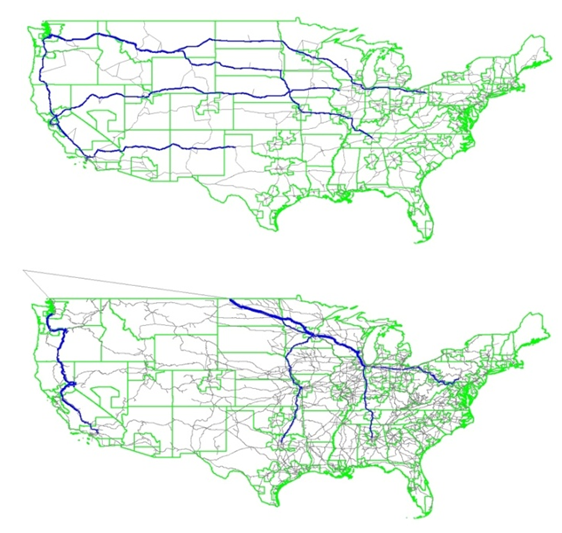
- The second scenario analyzed if capacity expansions at the Port of Prince Rupert affect route shift of import containerized shipments. Similar to the first scenario, rail and truck modes are visualized separately showing increased and decreased volumes on networks.When the time scope is assumed as 2020, if the Port of Prince Rupert increased its capacity, Figure 5 shows increased container flow from the major ports to all Regions. At the same time, decrease of container flow, in Figure 6,is observed from the West Coast ports to the Midwest and South Regions. Container drayage movement is observed from the Gulf and East Coast ports even though the Port of Prince Rupert expanded its capacity. It is supposed to stabilized for the shipments destined to the Midwest, South, and Northeast Regions to use the nearest ports. For the increased movement with rail mode, it may be observed the demand that could use the intermodal system through the Port of Prince Rupert. Even though the Port of Prince Rupert increases its capacity by double, it is also important to receive more vessel calls from the Asian countries, but the carriers’ frequency was relatively to few than to the West Coast ports. Decreased flow is observed from the West Coast Ports to their states or to the Midwest Regions for both modes.
 | Figure 5. Increased Container Flow with Comparison between Increased and Non-Increased Capacity at the Port of Prince Rupert |
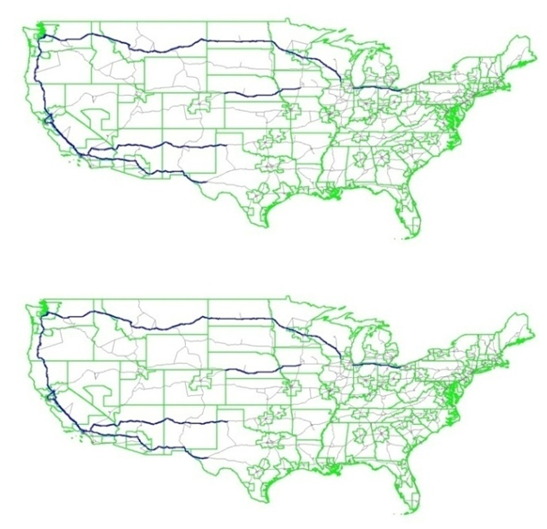 | Figure 6. Decreased Container Flow with Comparison between Increased and Non-Increased Capacity at the Port of Prince Rupert |
4.1.3. Results
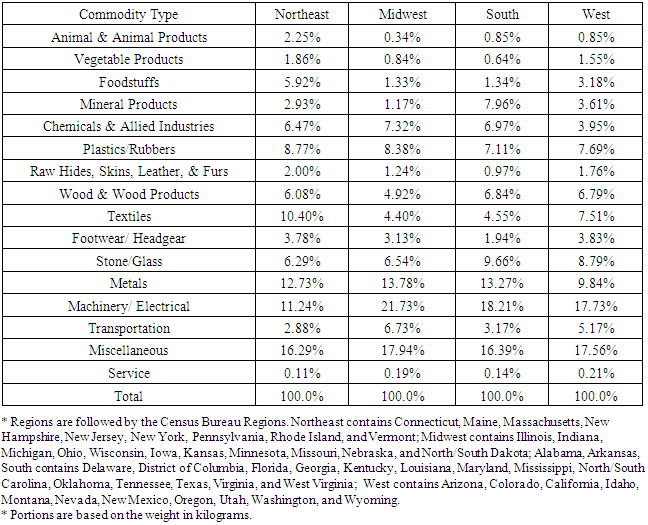
- From the simulation and assignment results, both capacity expansion projects expect to change route distributions of containerized cargo through the ports to the final destinations. Also, each project showed different distribution changes. The first scenario showed significant and reasonable result from the Panama Canal’s expansion. More container flow was observed through the Gulf and East Coast ports compared to the case when the project is not initiated. However, the second scenario was less clearer than the first showing increased container flow at the West and East Coast ports to the Midwest Regions even thought the rail connections to the Midwest was an advantageous factor for the Prince Rupert. It is not clear but it is assumed that the reason lies in the optimization process. When the optimization model is built, container flow to the Port of Prince Rupert was constrained due to the fewer sailing frequency, and this is assumed to affect the further optimization estimates.Also, we discussed major commodities for each Region, in Table 2, commodity types are quite similar by Regions and those are weight cargos and relatively high-valued items. If these attributes are appropriately utilized with facility support and readiness, it will help to absorb the shifting demand of intermodal freights, or to hold the existing container flows.
5. Conclusions and Further Research
- Two capacity increase cases of the Panama Canal and Prince Rupert are considered in this analysis based on current container flow between the seven Asian trading partners and the U.S. states.When the increased service capacity from the Panama Canal is assumed for the trading condition in 2019, many shipments were observed changing their routes to the ports on the Gulf/East Coast. At the West Coast ports, inbound shipment volume decreased for the Midwest regions. When the Port of Price Rupert was expected to complete the capacity increase project in 2020, changes of shipment volume for the Midwest regions is not observed. At the West and East Coast ports, flow increase to all the Regions and other states is simulated. With overall, it can be concluded that capacity increase of the Panama Canal resulted container flow increase at the Gulf/East Coast ports. Further research can be suggested in a number of areas from this paper. First, detailed sailing frequency schedule will help to simulate much precisely. In this paper, the Prince Rupert is not fully analyzed with its anticipated capacity expansion with this reason. If it is possible to include expected more frequent sailing schedule, it is believed to maintain more container flows on this route. Second, integration of commodity types into the optimization process would be possible to estimate much realistic flows of containerized cargos. Also, additional inclusions of trading partner countries, the U.S. ports, and subdivided destination states will improve estimation of container cargo distribution into the U.S.
ACKNOWLEDGMENTS
- This research was partially funded through a project sourced by the National Center for Freight and Infrastructure Research and Education (CFIRE). In addition, we are grateful to Professor Tulio Sulbaran and professor MD Sarder at the School of Construction in the University of Southern Mississippi for their support with data retrieval from the WISERTrade database. All responsibility for the contents of the paper lies with the authors.