Tahmina Khan, Michael Anderson
Department of Civil and Environmental Engineering, University of Alabama in Huntsville, Huntsville, USA
Correspondence to: Tahmina Khan, Department of Civil and Environmental Engineering, University of Alabama in Huntsville, Huntsville, USA.
| Email: |  |
Copyright © 2016 Scientific & Academic Publishing. All Rights Reserved.
This work is licensed under the Creative Commons Attribution International License (CC BY).
http://creativecommons.org/licenses/by/4.0/

Abstract
Travel demand forecasting models are a key analysis tool used in transportation planning and to support infrastructure investment decisions. Concerns for safety and need to avoid inconveniencing drivers have limited the use of traditional household surveys. Finding ways to reduce the time required and minimize the costs associated with developing these travel demand forecasting models would be beneficial to communities that maintain these models for forecasting and planning. The previous research evaluated the potential to estimate an accurate origin/destination matrix from existing traffic counts using entropy maximization method implemented in a study of a small community in Alabama, with minimal congestion. To extend this research to study a large congested network, traffic counts were removed from a larger and semi-congested network with a known O/D matrix, and a complete set of traffic counts were used to determine the methodology’s ability to reflect the estimation of the actual matrix. This paper provides a case study highlighting the issues regarding the necessity of a base/seed matrix, the number of available traffic counts/link flows and their impact on the quality of the generated origin-destination matrix. The paper presents the acceptable level traffic counts necessary to develop a statistically significant O/D matrix through estimation. The estimated O/D can be used to support the development of travel demand model inputs and parameters, reducing the dependency on expensive household surveys.
Keywords:
Origin-destination matrix, Traffic counts, Seed matrix, etc
Cite this paper: Tahmina Khan, Michael Anderson, Accurately Estimating Origin/Destination Matrices in Situations with Limited Traffic Counts: Case Study Huntsville, AL, International Journal of Traffic and Transportation Engineering, Vol. 5 No. 3, 2016, pp. 64-72. doi: 10.5923/j.ijtte.20160503.02.
1. Introduction
Travel demand forecasting models provide a representation of the traffic volumes on roadways within a transportation network. These models are a key analysis tool used in transportation planning and to support infrastructure investment decisions. These models can be used to represent current traffic volume, predict future traffic volumes, test alternative scenarios, and evaluate the transportation network [1]. Unfortunately, the money and time required for data collection and model development frequently result in only a little left over for the forecasting phase [2] [3]. Finding ways to reduce the time required and minimize the costs associated with developing these travel demand forecasting models would be beneficial to communities that maintain these models for forecasting and planning. Entropy maximization work was performed by Wilson [4] and applied by Van Zuylen and Willumsen [5] for origin/destination matrix estimation. The entropy maximization method was implemented in a study of a small community in Alabama, with minimal congestion, was tested and analyzed [6]. The study by Wilson evaluated the potential to estimate an accurate origin/destination matrix from existing traffic counts. It also determined the relationship between the number of traffic counts required in a network and the number of origin/destination pairs to build an accurate origin/destination matrix, since existing traffic counts are relatively easy and inexpensive to obtain [6].The application of the entropy maximization technique for estimating an origin/destination (O/D) matrix from traffic counts can be explored and extended to study a large congested network. To do so, traffic counts were removed from a larger and semi-congested network with a known O/D matrix, and a complete set of traffic counts were used to determine the methodology’s ability to reflect the estimation of an actual matrix accurately. Additionally, as several approaches for O/D estimation rely on a seed matrix to work properly, this paper tested the influence of the seed matrix on the O/D matrix estimation. Sensitivity analysis was performed by testing simplified scenarios using different seed matrices. The goal of this paper is to determine the acceptable level traffic counts necessary to develop a statistically significant O/D matrix through estimation. The estimated O/D can be used to support the development of travel demand model inputs and parameters, reducing the dependency on expensive household surveys.
2. Literature Review
A brief review of relevant literature is provided to highlight the contribution of this paper. The difference between this work and the work by Wilson [6] is the inclusion of congestion in the network. Under congested conditions, trips are allowed to take paths other than the uncongested shortest travel path due to congestion time increases on the main roadways. To solve this congestion travel time concern, travel assignment procedures often use an iterative approach until the route choice proportions, and trip matrix are similarly consistent [2]. One way of implementing non-proportional assignment is through the use of incorporating equilibrium to the traffic flows that assigns link cost functions, link travel cost, and path travel cost to the network as a way to minimize travel costs [7], [8]. A target trip matrix is required to reproduce the observed traffic counts in the equilibrium approach [7], [9]. These models were developed on small test networks, and their applicability on a large network is not ensured [8]. For instance, path flow estimation was used in a study by Chen et al. [10] to estimate the number of trips between O/D pairs on a small freeway network using centroid connectors as well as freeway traffic counts in estimating the flows.The origin/destination matrix estimation procedure can be determined using the statistical inference techniques of maximum likelihood, generalized least squares, or Bayesian approach for estimating the origin/destination matrix [9]. These approaches are found to be sensitive to variations and accuracies in the traffic counts and the target origin/destination matrix and were tested on small and simple transportation network [9]. The O/D Matrix Estimation (ODME) procedure in TransCAD (Caliper Corporation) is an iterative (or bi-level) process that switches back and forth between a traffic assignment stage and a matrix estimation stage, until convergence is reached [11] [12]. The single-path and multipath methods updates static O/D matrices by comparing assigned and observed link flows along the path(s) used by each O/D pair and by using updating factor as the ratios of observed to assigned flows for each O/D pair [13]. The procedure requires an initial estimate of the O/D matrix that can be a prior estimate based on survey measurements, or be synthetically generated (e.g., from a doubly-constrained trip distribution model). However, small-area with no prior estimate of the O-D matrix can be analyzed by TransCAD O/D Matrix Estimation procedure that provides several types of traffic assignments and estimates O/D trips where the link is missing traffic count as well [11]. Two new methods proposed can handle inconsistent and uncertain counts for any assignment model. And inconsistent counts will not affect the results as seriously as in many other matrix estimation methods [14]. Many computer models have been proposed and applied for O-D matrix estimation to investigate the relationship between traffic counts and O-D matrix, and TransCAD Model is one of the most widely-used models [15].Most of the studies focused on optimization techniques where an old/target origin/destination matrix was updated by analyzing traffic counts using maximum likelihood, generalized least squares, or Bayesian inference techniques [9]. The estimation method implemented in TransCAD was chosen to determine an origin/destination matrix from traffic counts by following user equilibrium (UE) assignment. The focus of this study is to estimate origin-destination matrix by using limited counts and determine if a viable answer can be obtained. A seed matrix has been fed into the calculation process after understanding how it impacts the quality of the estimated origin/destination matrix.
3. Study Motives
The primary objective of this paper is to demonstrate how the network was setup, how the methodology was utilized and how many traffic counts are required to build a statistically significant origin/destination matrix for the region in question. The amount of links that can be removed and still yield a viable origin/destination matrix was documented at the end of this paper.
4. Methodology
As mentioned, the ODME procedure in TransCAD was followed for estimating the O/D matrix. Single Mode Highway O/D Matrix Estimation procedure requires several inputs to analyze the sample or real world networks throughout the study. The following data needed to be prepared/created to execute the O/D Matrix Estimation procedure [11]1. Base/initial/prior O/D matrix2. Geographic file with required link data: both a node and a line layer 3. Network file from the line layer, including all the relevant attributes such as link flow (count), capacity, time, speed, etc.The O/D Matrix Estimation procedure/tool can be promptly used, once necessary input files are ready to run [11]. UE assignment method was chosen to test the sensitivity of estimated O/D over the proportion of traffic count that can be removed. After completing this procedure successfully, the outputs can be stored to do a further assessment, a matrix file containing the estimated O/D flows and a table file containing estimated link flow volume [11].
5. Case Study
Huntsville, Alabama was used as the location for the case study. The study area for the Metropolitan Planning Organization includes all of Madison County and part of Limestone County. The metro area is around 947 square miles and has a population of 363,210 people with 156,649 households [16]. Population and household data are available as statewide block level shapefile for 2010 [16] and summarized in ArcGIS to know the required values at the TAZ level.The Huntsville TAZ and network data were obtainable from an existing travel demand model built in CUBE. The network shapefile was exported from CUBE and was examined in ArcGIS to identify how different attributes are linked with a two-way and one-way link. In TransCAD, values of many of fields (such as Capacity, Time) can vary by the direction along each link, and should be read as a pair of fields named "AB Time" and "BA Time" [11]. On the other hand, the exported shapefile has two rows to define the directional attributes in case of the two-way link. It means CUBE represents two-way link as duplicated polylines in two rows. Since ODME tool implemented in TransCAD was used in our study, the network needs to be compatible with TransCAD. Modification of the shapefile was carried out to represent directional attributes in one row with one polyline. Based on the start and end node of a two-way link, additional rows in CUBE network were added as columns, thus merging of two polylines into one was executed. The network attributes were formatted in TransCAD environment to specify the directional fields and the centroids to match the CUBE. The origin-destination table in CUBE contained intrazonal trips which had to be removed from the analysis because the ODME tool in TransCAD does not estimate trips intrazonal trips. The final Huntsville network as displayed in TransCAD can be shown in Figure 1 where green lines are for one-way links, and purple lines are for centroid connectors.The model network in TransCAD contained many links representing the roadway system of Huntsville, AL. The number of bidirectional links in the network is 3097, and the number of one-way links is 1264. Also, there are 525 Traffic Analysis Zones in the network of which 508 are internal zones, and 17 are external zones.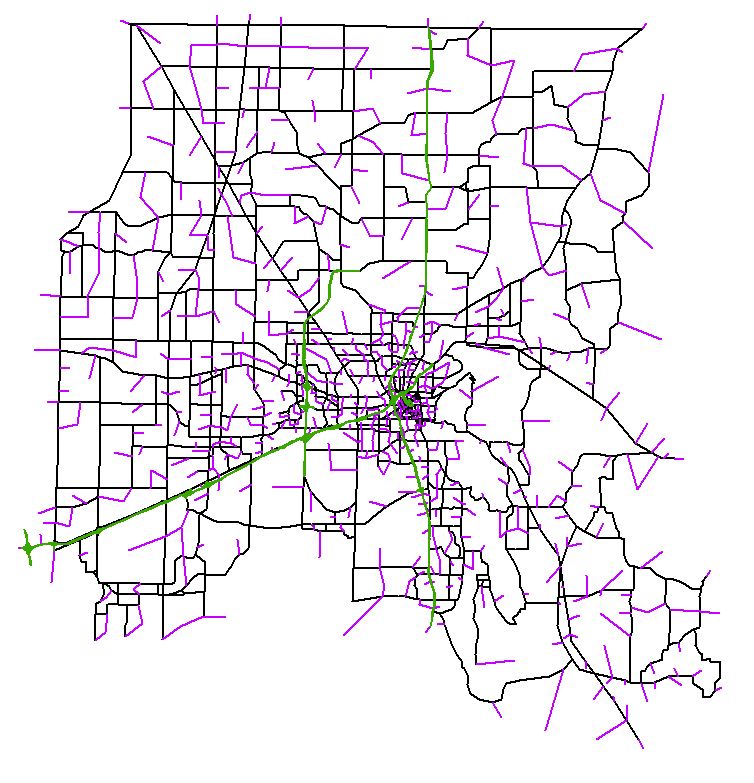 | Figure 1. Setup of Huntsville network in TransCAD 4.7 |
6. Data Formatting
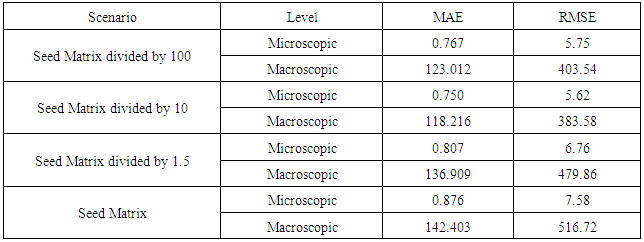
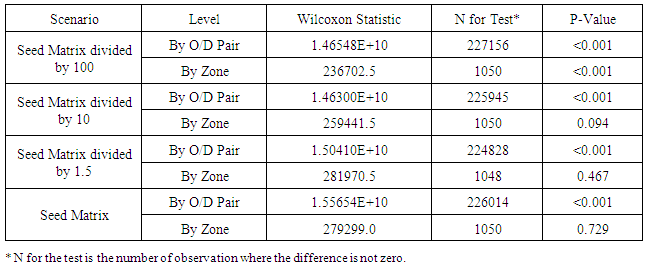
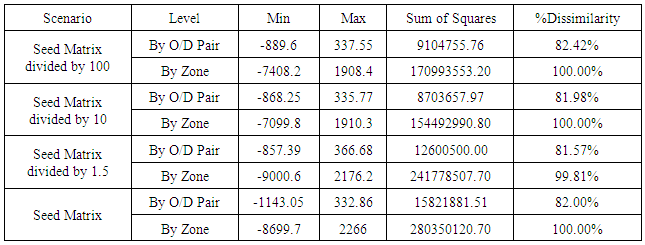
Our study involves two modeling platforms because of input data availability in CUBE and accessibility of ODME tool in TransCAD. A comparison of assigned flows performed by CUBE and that of TransCAD for Huntsville network was mentioned earlier. Furthermore, comparing the estimated O/D to the expected/existing O/D under simplified scenarios was included. The following sections demonstrate the procedure along with the results of statistical measures. The existing O/D table exported from CUBE is one of the inputs to run the ODME tool in TransCAD. Network link attributes including link volume, time, and speed were also gathered from CUBE where link volume was found after assigning the original or existing O/D matrix in CUBE following equilibrium assignment. Before, these link volumes can be used as traffic counts, the original O/D matrix was assigned in TransCAD by using equilibrium assignment. To understand the requirement of an initial matrix in this study was inspected through basic scenarios that are proportionate to the existing matrix. Link volumes or flows were given as traffic counts that can be gathered from CUBE by using UE assignment and from TransCAD itself. Prior matrix and counts are major inputs in O/D estimation by TransCAD. It has been found from previous studies that there is a need for a prior matrix for a larger network to minimize the gap between estimated O/D and actual O/D matrices. Link volumes were regarded as counts to determine O/D matrix in TransCAD that were collected from CUBE through the use of equilibrium assignment. Scenarios that are symmetrical to the original matrix are considered as best candidates to examine how likely the exact matrix can be estimated by TransCAD. Based on the results of these scenarios, further experimental scenarios can be developed and analyzed if needed. Hence, simplified scenarios were made just dividing the actual or existing O/D by 100, 10 and 1.5 respectively that were treated as seed/base matrix to execute the TransCAD ODME tool following User Equilibrium assignment. Each scenario consists of two types of comparison such as 1. Summarizing total attractions and productions by zone and determining the difference of zonal trips between the corresponding CUBE and TransCAD zones – macroscopic level2. Calculating the difference of each O/D pair trips between the corresponding CUBE and TransCAD O/D pairs – microscopic levelRoot mean square error (RMSE), mean-absolute-error (MAE), selected descriptive statistics and the Wilcoxon Signed Rank [17] [18] were performed in each case at two levels (stated above) to gather valuable insight of the nature of TransCAD O/D estimation tool in handling intricate network. Percent Dissimilarity is the ratio between the numbers of observation at a certain level (where differences are not zero) and the total ones. This study area has a total number of observations at O/D pair level of 275625 (525x525), and a total of 1050-production & attraction values at zonal level. Results of the tests are in Table 1, Table 2 and Table 3.Table 1. RMSE and MAE of the Difference between Estimated O/D and Original O/D by Scenario
 |
| |
|
Table 2. Wilcoxon Test Statistic of the Difference between Estimated O/D and Original O/D by Scenario
 |
| |
|
Table 3. Descriptive Statistics of the Difference between Estimated O/D and Original O/D by Scenario
 |
| |
|
Although zonal trips are the summation of rows and columns of the square matrix of O/D trips and include one cell twice while summarizing respective row and column, it can be useful to compare the scenarios at this level. It was found that flows assigned by CUBE are statistically different from flows assigned by TransCAD. And it cannot be expected that O/D estimation tool can reproduce the exact matrix when the original matrix was used as base one. As the seed matrix was impending to the exact one, none of the statistics can reflect the similar trend except the Wilcoxon Signed Rank test results at zonal level. Therefore, the similar sensitivity analysis can be conducted with assigned flows by TransCAD.
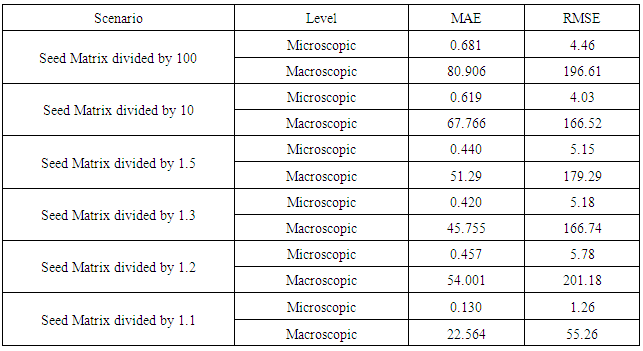
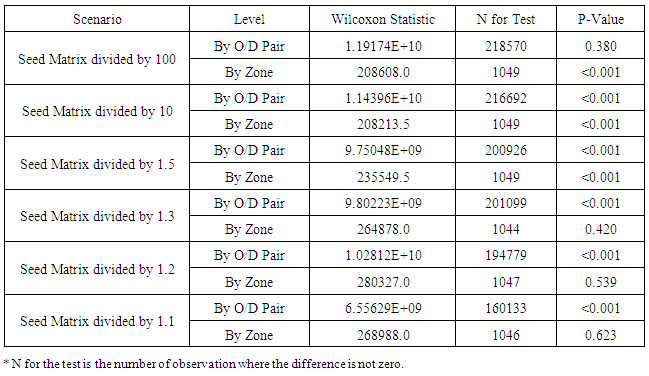
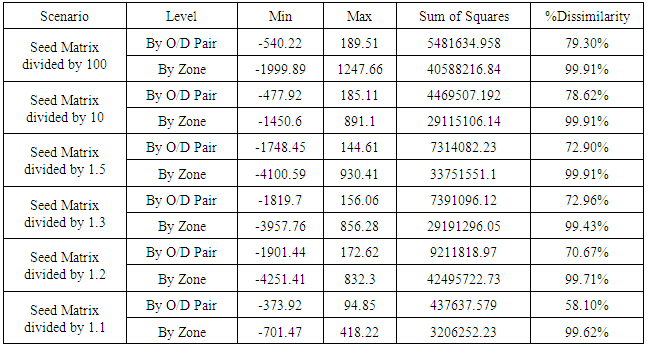
6.1. Comparison between Estimated and Existing O/D with TransCAD Assigned Flows
The above results reveal that the estimated O/D is significantly different from the existing O/D at the microscopic level. These findings led to initiate the following analysis and measure statistical parameters such as root mean square error, mean absolute error, and the Wilcoxon Signed Rank test value. Traffic can be assigned by TransCAD to the roadway network, and the assigned flows can be used to estimate the O/D which can be compared with the existing O/D. And scenarios can be generated based on varying the base/prior O/D in an anticipated manner. User Equilibrium and All or Nothing assignment methods were applied respectively to assign the existing CUBE O/D in TransCAD. Assigned link flows were regarded as counts to determine O/D in TransCAD. In the same way, scenarios were created just dividing the actual or existing O/D by 100, 10, 1.5, 1.3, and 1.1 respectively that were fed into O/D estimation tool as seed/initial matrix. It can be noted that when All or Nothing (AON) assigned flows were selected in defining the network, O/D estimation tool was run following the AON assignment and likewise, O/D estimation was carried out with User Equilibrium assigned flows.Root mean square error (RMSE), mean absolute error (MAE), selected descriptive statistics and the Wilcoxon Signed Rank were performed in each case. It was observed that the estimated O/D matrices under the scenarios for All-or-Nothing assignment do not deviate from the original O/D matrix. The following tables show the results of stated statistics for assessing the differences when equilibrium assignment was employed. See Table 4, Table 5, and Table 6.Table 4. RMSE and MAE of the Difference between Estimated O/D and Original O/D by Scenario
 |
| |
|
Table 5. Wilcoxon Test Statistic of the Difference between Estimated O/D and Original O/D by Scenario
 |
| |
|
Table 6. Descriptive Statistics of the Difference between Estimated O/D and Original O/D by Scenario
 |
| |
|
As the seed matrix was close to the exact one, most of the statistics do not follow any trend except %Dissimilarity at cellular/O/D pair level and the Wilcoxon Signed Rank test results at zonal level. It has been observed that O/D estimation tool can reproduce the exact matrix when the original matrix was used as seed one for UE Assignment since TransCAD assigned flows were considered as count rather than using any random flows. Therefore, it is required to have background knowledge of initial matrix to perform O/D estimation in TransCAD for a larger network. At this point, our assumption is to use the existing/current matrix as an initial matrix in our future estimation. The following section covers further sensitivity analysis by removing link volumes from the study network that can help to explore how it can affect the difference between the existing and estimated matrices.
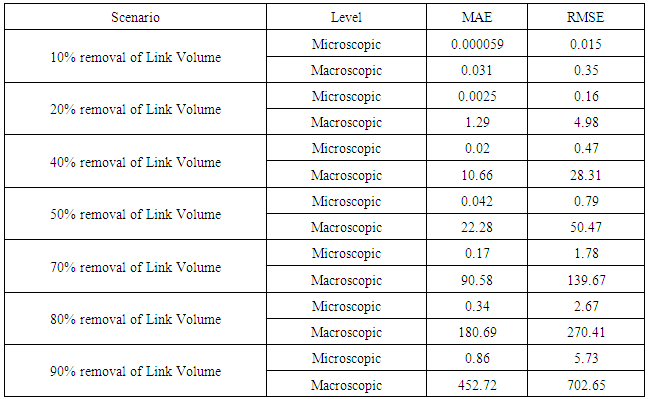
7. Link Removal Scenarios
User Equilibrium assignment method was applied to assign the existing CUBE O/D in TransCAD and assigned link flows were regarded as counts to determine O/D in TransCAD. Factitious scenarios were formulated by removing 10%, 20%, 30%, 50%, 60%, 80%, and 90% of low volume links respectively after ordering those from high to low. It can be noted that link with zero volume was kept unchanged. The existing CUBE O/D was fed into TransCAD as seed/initial matrix and O/D estimation was carried out with User Equilibrium assigned flows.Root mean square error (RMSE), mean absolute error (MAE), selected descriptive statistics and the Wilcoxon Signed Rank were performed in each case. See Table 7, Table 8 and Table 9. Table 7. RMSE and MAE of the Difference between Estimated O/D and Original O/D by Scenario
 |
| |
|
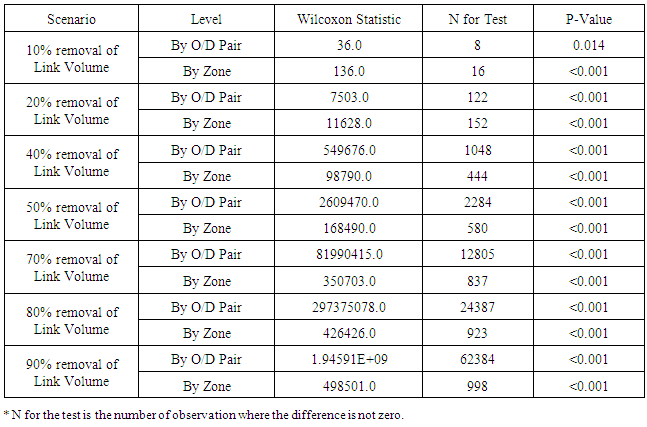
Table 8. Wilcoxon Test Statistic of the Difference between Estimated O/D and Original O/D by Scenario
 |
| |
|
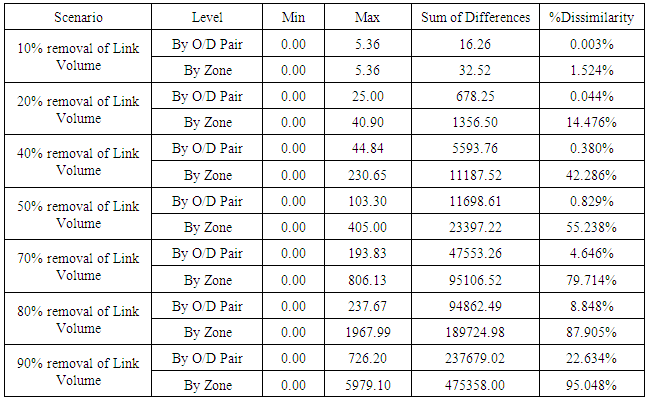
Table 9. Descriptive Statistics of the Difference between Estimated O/D and Original O/D by Scenario
 |
| |
|
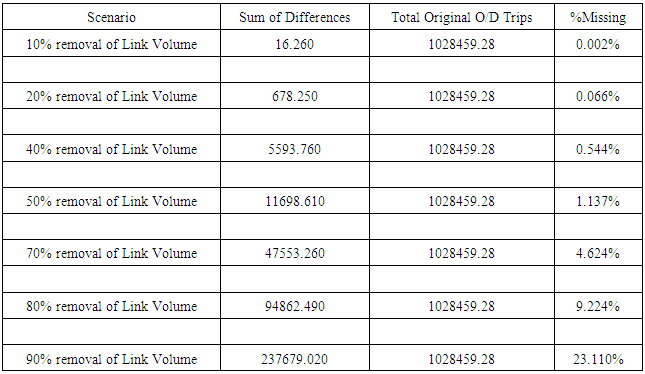
Our interest is mostly to look at the statistics at its cellular level rather than at its zonal level since zonal row, and column summations include one cell twice. There is a clear increasing trend of above statistics as the percentage of removal increases except for the Wilcoxon Statistic. It has been observed that if the difference column contains all zeros, Wilcoxon Statistic cannot be run. A p-value of Wilcoxon Signed Rank test states that there is evidence of a significant median difference in two trip matrices (existing vs. estimated) for all scenarios at a significance level of alpha of five percent. However, top two scenarios have only 8 to 16 different cells out of 275625 cells and still fail to accept the null hypothesis of Wilcoxon test. Thus, it can justify looking at other measures of statistics. As expected Minimum value is always zero, and Sum of differences can be incorporated while Sum of Squares was included in previous analyses. The following table presents the percent O/D trips that are absent across the scenarios. See Table 10.Table 10. Percent Missing by Scenario
 |
| |
|
Statistical measures like %Dissimilarity, %Missing and Maximum can be checked to decide at what level of removal is appropriate for a particular network. In this case, 50% removal of network link volume after ordering those from high to low could be a proper option if maximum deviation of 100 trips and 1% of mismatch or sacrificing of actual trips are satisfactory.
8. Conclusions
This paper provides a case study highlighting the issues regarding the necessity of a base/seed matrix, the number of available traffic counts/ link flows and their impact on the quality of the generated origin-destination matrix.It was our concern to determine whether a prior matrix in TransCAD for the case network is essential or not. At first, the original/existing matrix obtained from CUBE was assigned in CUBE and TransCAD. While testing the sensitivity of seed matrix, no pattern was examined in most of the statistical parameters. However, it can be concluded that an existing matrix is a must for a larger network to perform O/D estimation in TransCAD, and original matrix can be reproduced only if the link volumes used as count are similar to the flows assigned by TransCAD following a specific assignment. At last, a further sensitivity analysis was conducted by removing link volumes from the study network that helps to focus on the results of few statistical measures such as %Dissimilarity, %Missing and Maximum, and decide the level of removal of link volumes could be applicable for a larger network.Traffic Demand model parameters can often be estimated more conveniently and cheaply through the use of ODME than by the sequential four-step which demands costly traffic surveys, and extensive amount of land use, socioeconomic, and demographic data for trip generation. Moreover, traffic counts are much easier to obtain and are often already available for other traffic related purposes that make this method be a very good option in low-budget analyzes, where an existing (often old) matrix needs to be updated for estimating a new traffic model. The case study required 50 percent of the traffic counts to be present if sacrificing of one percent trip is acceptable. Thus, a decision maker needs to examine their percentage of traffic counts for estimating an origin-destination matrix. Considering that most communities only model the major roadways in their network and these roads almost always have traffic count data available, it is entirely probable that a sufficient amount of traffic counts may already be on hand. The findings revealed in this paper will assist large communities that want to estimate an origin-destination matrix without using the traditional travel demand model.
ACKNOWLEDGEMENTS
The authors would like to thank City of Huntsville for providing essential resource which aided in the research of this paper.
References
| [1] | Virginia Department of Transportation, Virginia transportation modeling (VTM) policies and procedures manual, Virginia Department of Transportation, 2009. |
| [2] | J. d. &. W. L. G. Ortuzar, Modelling Transport, 2nd ed., New York, New York, United States of America: 454 p, 1994, p. 454. |
| [3] | M. D. Meyer and E. J. Miller, Urban transportation planning, 2nd ed., New York, New York: McGraw-Hill, 2001. |
| [4] | A. G. Wilson, Entropy in Urban and Regional Modelling, London: 178 p, 1970. |
| [5] | H. J. Van Zuylen and L. G. Willumsen, The most likely trip matrix estimated from traffic counts, Transportation Research Board, vol. 14B, pp. 281-293, 1980. |
| [6] | J. P. Wilson, Evaluation of origin/destination matrix estimation techniques to support aspects of traffic modeling, 233 p, Huntsville, 2012. |
| [7] | K. M. T. W. S. &. X. C. Kockelman, A maximum entropy method for subnetwork origin-destination trip matrix estimation, Transportation Research Record, pp. 111-119, 2010. |
| [8] | S. &. K. R. K. V. Bera, Estimation of origin-destination matrix from traffic counts: The stat of the art, Eurpean Transport \ Transporti Europei(49), pp. 3-23, 2011. |
| [9] | T. Abrahamsson, Estimation of origin-destination matrices using traffic counts - A literature survey, 32 p, Laxenburg, Austria, 1998. |
| [10] | A. Chen, P. Chootinan and W. M. Recker, Examining the quality of synthetic origin-destination trip table estimated by path flow estimator, Journal of Transportation Engineering, vol. 131, no. 7, pp. 506-513, 1 July 2005. |
| [11] | C. Corporation, OD matrix estimation, in TransCAD- Transportation Planning Software, 2002. |
| [12] | S. Iyer, Estimating traffic impacts of an off-hour delivery program using a regional planning model, Rutgers, The State University of New Jersey, New Brunswick, New Jersey, 2010. |
| [13] | R. Balakrishna, D. Morgan, A. Rabinowicz and H. Slavin, Advances in origin-destination trip table estimation for transportation planning and traffic simulation, Association for European Transport and Contributors, 2008. |
| [14] | O. A. Nielsen, Chapter 13: Two new methods for estimating trip matrices, in Travel Behaviour Research: Updating the State of Play, Elsevier Science Ltd, 1998, pp. 221-250. |
| [15] | E. Almasri and M. Al-Jazzar, TransCAD and GIS technique for estimating traffic demand and its application in Gaza City, Open Journal of Civil Engineering, vol. 3, pp. 242-250, 2013. |
| [16] | United States Census Bureau, Tiger/line shapefiles, United States Census Bureau, 2010. [Online]. Available: https://www.census.gov/geo/maps-data/data/tiger-line.html. [Accessed 28 January 2016]. |
| [17] | Minitab Inc., Minitab Statistical Software, Release 17, State College, Pennsylvania, 2015. |
| [18] | W. W. Hines, D. C. Montgomery, D. M. Goldsman and C. M. Borror, Probability and Statistics in Engineering, 4th ed., New York, New York: John Wiley and Sons, Inc., 2004. |

 Abstract
 Reference
 Full-Text PDF
 Full-text HTML