Olutaiwo A. O., Babajide Isola
Department of Civil/Environmental Engineering, University of Lagos, Nigeria
Correspondence to: Babajide Isola, Department of Civil/Environmental Engineering, University of Lagos, Nigeria.
| Email: |  |
Copyright © 2016 Scientific & Academic Publishing. All Rights Reserved.
This work is licensed under the Creative Commons Attribution International License (CC BY).
http://creativecommons.org/licenses/by/4.0/

Abstract
The work investigated each level grade crossing along Iddo-Alagbado rail corridor of Lagos State of Nigeria, and prescribed improvements in bringing about safety. ECF and USDOT accident prediction models were used to evaluate the level crossing considered. Also, guidelines for highway-rail crossing improvement according to MUTCD were used to determine the adequate improvement needed at the level crossings. The major finding of this paper is that a majority of the at-grade rail crossings need some improvements to be in compliance with MUTCD standards. From the results obtained, two at-grade crossings were identified for additional traffic control devices or consolidation of TCDs while the third at-grade crossing was identified for grade separation, and/or additional traffic control devices beyond MUTCD standards.
Keywords:
Expected Crash Frequency (ECF), At-Grade crossing, Traffic Consolidation, Grade separation, Traffic Control Devices (TCDs)
Cite this paper: Olutaiwo A. O., Babajide Isola, Improving Highway-Rail Grade Crossings Safety in Urban Area of Lagos State, Nigeria, International Journal of Traffic and Transportation Engineering, Vol. 5 No. 2, 2016, pp. 32-39. doi: 10.5923/j.ijtte.20160502.02.
1. Introduction
Rail/road intersections are very unique, special, potentially dangerous and yet unavoidable in the World. There are two different entities with entirely different responsibilities, domains, performances come together and converge for a single cause of providing a facility to the road user. During the normal operation also, there is every possibility of accidents occurring even with very little negligence in procedure and the result is of very high risk. The potential for accidents is made higher as the railways control only half the problem. The other half, meanwhile, cannot really be said to be controlled by one entity, as even though traffic rules and road design standards supposedly exist, the movements of road users are not organized and monitored by one specific entity as rigidly as rail movements. The motor vehicle-train accident, though infrequent, is the most severe in terms of fatalities, personal injuries and property damage per accident of all types experienced on the highways. This type of accident, however, can be eliminated by improving the safety measures in all level crossings or by construction grade separations for all rail-highway crossings.According to Ogden (2007) discusses adverse impacts of grade crossings including travel time delays and the possibility of non-train collisions, and concludes that grade crossing elimination will negate these issues. In confirming the Molitoris and Slater works, Ogden added that a criterion for crossing closure on mainline tracks is if there are five or more crossings within a one-mile segment. USDOT Technical Working Group (TWG, 2002) outlines a four-step traffic control device selection procedure that would form the basis of an engineering study: gather highway-rail grade crossing information; evaluate highway traffic flow characteristics; possible revision to highway-rail grade crossing; and interim measures and/or documentation. Federal Railroad Administration /FHWA (1994), publication entitled Highway-Railroad Grade Crossings: states whenever a crossing is closed, it is important to consider whether the diversion of highway traffic may be sufficient to change the type or level of traffic control needed at other crossings. The surrounding street system should be examined to assess the effects of diverted traffic. Often, coupling a closure with the installation of improved or upgraded traffic control devices at one or more adjacent crossings can be an effective means of mitigating local political resistance to the closure.NATURE OF RESEARCH AREAThis research work was carried out on three selected level crossings along the Iddo - Alagbado corridor. The level crossings are Yaba, Jibowu and Agege level crossings. Each of the level crossings has their different traffic control devices (TCDs) and traffic characteristics.The risk of the research area is increased due to the increase in commercial activity and bus stops along the level crossings. Each of the level crossings has their different traffic control devices (TCDs) and traffic characteristics. However, some of the traffic control devices are not working or not in place. This is due to negligence of government especially the Nigerian Railway Corporation, to put in place safety measure and devices at the level crossings. Figure 2a, 2b, and 2c show the pictures of the level crossings.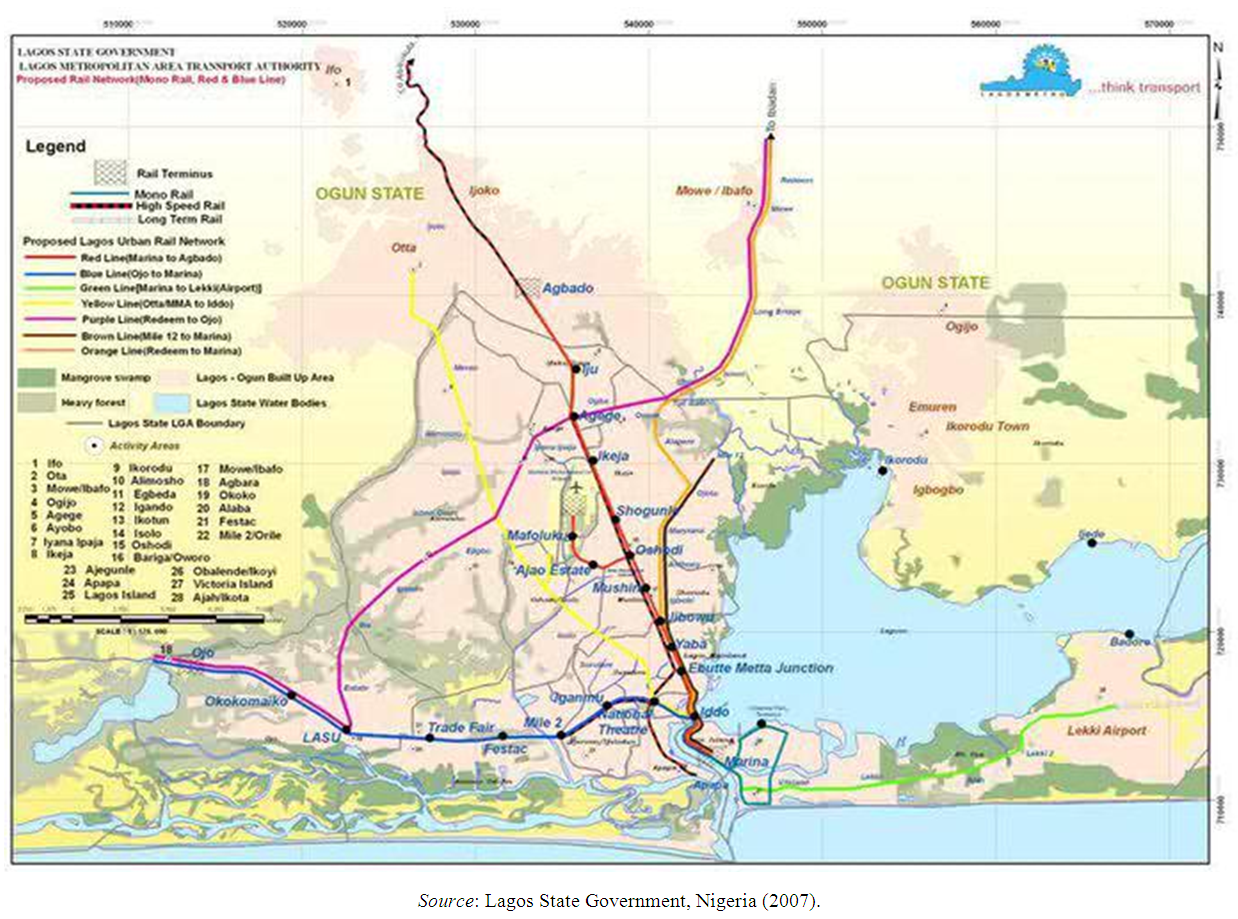 | Figure 1. Location Map Showing the Railway Iddo-Alagbado Corridor |
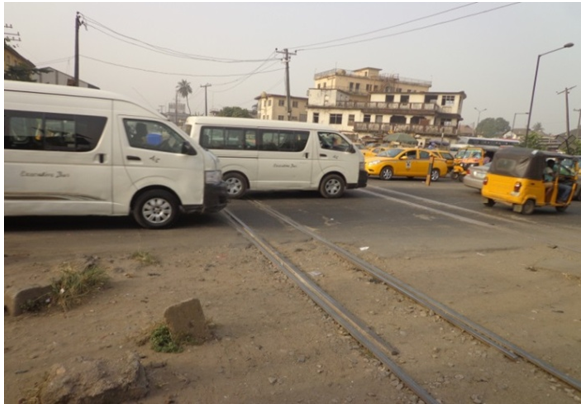 | Figure 2a. Yaba Level Crossing |
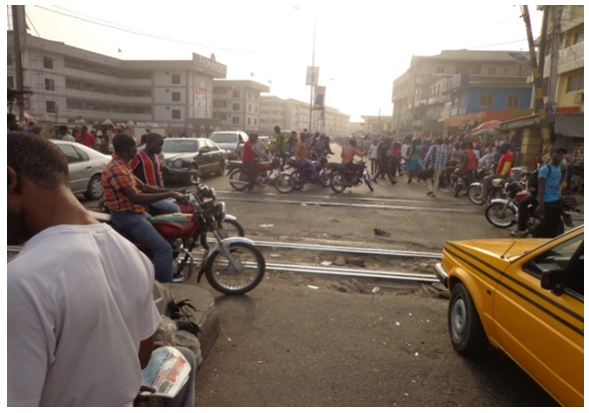 | Figure 2b. Jibowu Level Crossing |
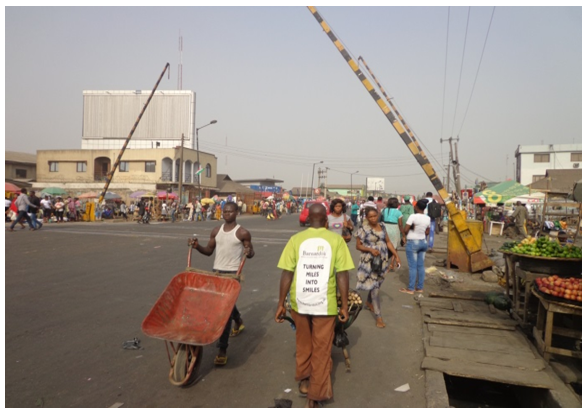 | Figure 2c. Agege Level Crossing |
2. Materials and Methods
This research work employs guidelines provided by USDOT and MUTCD to determine which crossing is to be improved. The most important data were generated through engineering studies of modern survey techniques like traffic volume count at different intersections. This is to determine the traffic flow characteristics, hourly distribution factors, and traffic composition. The expected crash frequencies of the three level crossings are calculated to determine the crash rate at those intersections. The research selected USDOT Accident Prediction Model which is applicable and of potential for use in Nigeria. A few models that were studied are modified versions of a basic model and USDOT accident prediction model was selected because of the input variables used for calculating either the expected number of accidents or a hazard index were compatible with data collected from Nigeria Railway Corporation. To obtain the expected crash frequency for flashing lights, use the following equation: 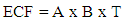 | (1) |
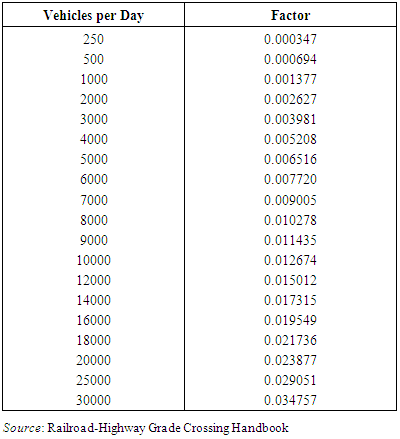
where;ECF = Expected Crash Frequency A = Traffic factor, (see Table 1)B = Component factor, (see Table 2)T = Current number of trains per dayTable 1. Traffic Factors
 |
| |
|
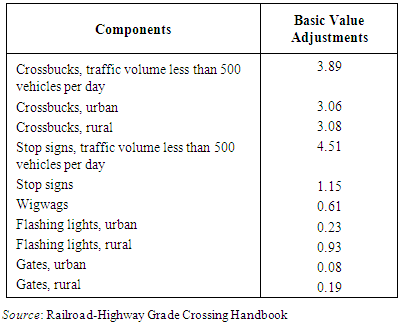
Table 2. Component Factors (Basic Values for Existing Devices)
 |
| |
|
2.1. USDOT Accident Prediction Model
The DOT accident prediction formula combines three calculations to produce an accident prediction value. The expected number of accidents at a crossing is calculated using the following formulas: • A formula that contains geometric and traffic factors from the inventory file • A formula that involves crash history • A formula that incorporates the effect of the existing warning devicesThe basic formula provides an initial prediction of accidents on the basis of crossing characteristics. It can be expressed as a series of factors that, when multiplied together, yield an initial prediction of the number of accidents per year at a crossing. Each factor in the formula represents a characteristic of the crossing. The first formula is: | (2) |
where:a = primary annual accidents forecast at one crossing.K = formula constant EI = factor for exposure index based on product of highway and train traffic DT = factor for number of through trains per day during daylight MS = factor for maximum timetable speed HT = number of main tracks HP = factor for highway paved (yes or no) HL = factor for number of highway lanesThe second formula, which is the general DOT accident prediction model, is expressed as follows: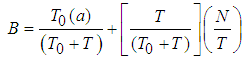 | (3) |
where:N = observed crashes in T years at the crossing T = number of years of recorded crash data  formula weighting factor 1.0/ (0.05+a)The final crash prediction was developed using the 1992 normalizing constants. The formulas are:
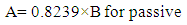 | (4) |
 | (5) |
 | (6) |
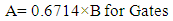
A = final accident prediction, crashes per year at the crossing.The methodology use for the research work is put in al flowchart in the Figure 3.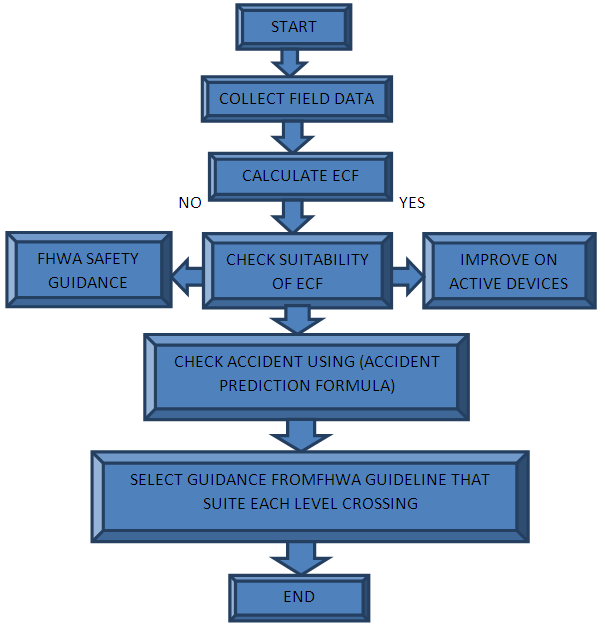 | Figure 3. Methodology Flow Chart |
3. Results and Discussions
The results of the data obtained have been summarized into tables and graphs to clarify the road traffic and transport patterns within the Corridor. The analysis of results of the various field studies are discussed below.
3.1. Vehicular Distribution of Traffic
The output in Table 3 and Figure 4 show the vehicular distribution of traffic at the level crossings. The vehicular distribution is total number of vehicle class that pass through the level crossings. Table 3. Vehicular Distribution of Traffic
 |
| |
|
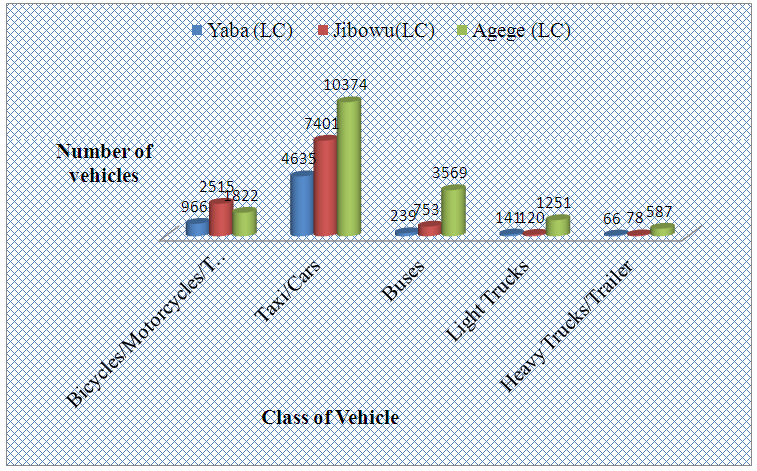 | Figure 4. Vehicular Distribution of Traffic |
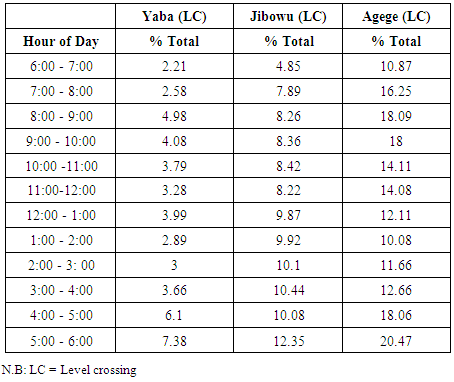
3.2. Hourly Traffic Distribution
Table 4 shows the percentage hourly distribution of traffic during the 12 hour count at the three level crossings. From the data collected, it shows that the A.M peak period is about 9am to 10am, which is due to early morning rush hour. The P.M peak period is usually at 5pm to 6pm. However the traffic volume at Jibowu level crossing increases towards the mid-day, this is due to the proximity of the intersection to major markets.Table 4. Percentage Hourly Distribution of Traffic
 |
| |
|
The three graphs on Figure 5 shows similar trend of traffic flow. However, they have different time at which traffic is the lowest. From the graph, it is observed that Agege traffic volume is lowest around 1:00 -3:00pm, which started increasing till the P.M peak period of 5:00 – 6:00pm. For Yaba level crossings it was noticed that it has two lowest traffic volumes, between 10:00 – 12:00noon and 2:00 – 3:00pm. Traffic volume at Jibowu level crossing was at its lowest around 10 -12noon.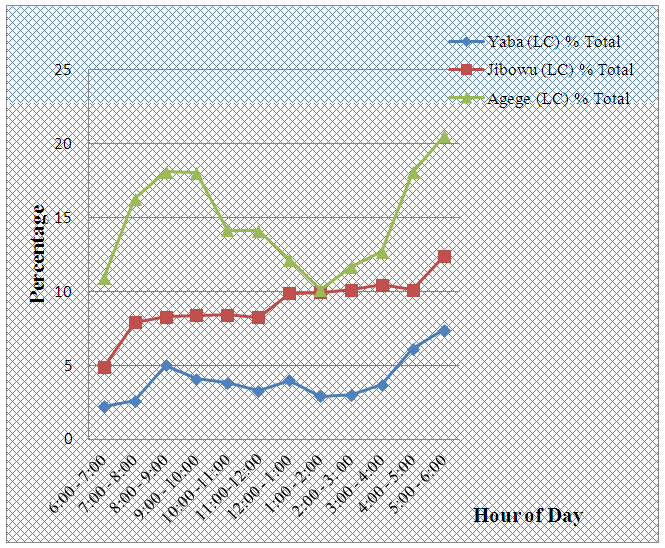 | Figure 5. Percentage Hourly Traffic Distribution |
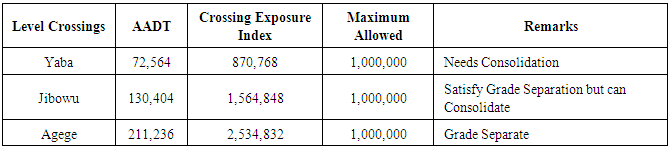
3.3. Crossing Exposure Index
From Table 5, the crossing exposure index increases in value this is due to the increase in ADT, at the level crossings. As a result of these, the at-grade rail crossings should be considered for improvement to reduce the risk of collision and for safety and excessive vehicle delays. Crossing exposure index is represented by the numerical value of the product of ADT (Average Daily Traffic) and the number of trains per day. Table 5 shows that all the crossing exceeds the provided guidelines. At Yaba and Jibowu, crossing exposure exceeds 1,000,000train/yr. provided for grade separation but can still be consolidated. Crossing exposure at Agege level crossing exceeds 1,000,000 in urban areas. This shows that there is need for grade separation.Table 5. Crossing Exposure Index
 |
| |
|
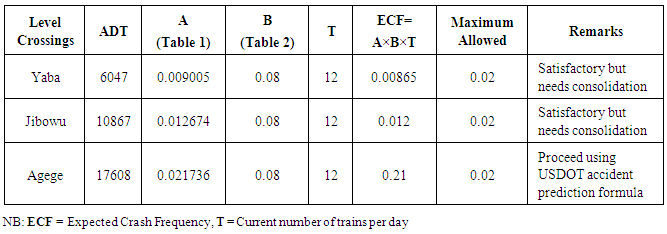
3.4. Expected Crash Frequencies
As shown in Table 6, it is observed that ECF for Yaba and Jibowu level crossings is still within the allowable ECF which is 0.02. However more safety measures still need to be put in place. The expected crash frequency at Agege level crossing exceeds 0.02; therefore, the USDOT accident prediction formulas will be used to determine the warrant to be satisfied.Table 6. Expected Crash Frequencies
 |
| |
|
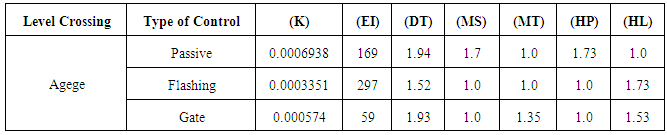
3.5. USDOT Accident Prediction Model Factors
Table 7 shows the calculations for the accident prediction factor. These are the factors that make the initial prediction formula. Table 7. USDOT Accident Prediction Model Factors
 |
| |
|
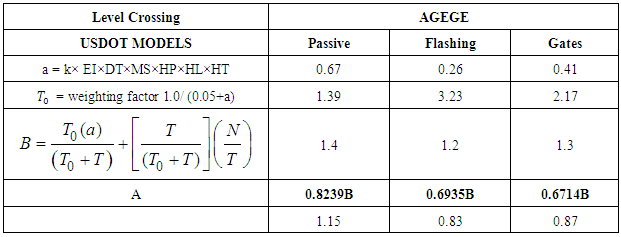
3.6. Expected Accident Frequency (EAF) Calculated by USDOT Acciednt Prediction Formilas
Table 8 shows the USDOT accident prediction formulas used for Agege level crossing. From table 8, the initial prediction shows that passive device is not warranted. From Table 8, multiple tracks exist at Agege level crossing which may effectively reduce the clearing sight distance below the minimum relative to a train approaching the crossing on an adjacent track. Also, the Annual Average Daily Traffic exceeds the allowed traffic for consolidation and grade separation. The expected accident frequency (EAF) as calculated by the USDOT Accident Prediction formula, including 5-year accident history, exceeds 0.5. Therefore crossing consolidation should be employed. The crossing exposure and the passenger train crossing exposure exceed the limits, which mean that there is high risk of accident along the level crossing. Table 8. USDOT Accident Prediction Models
 |
| |
|
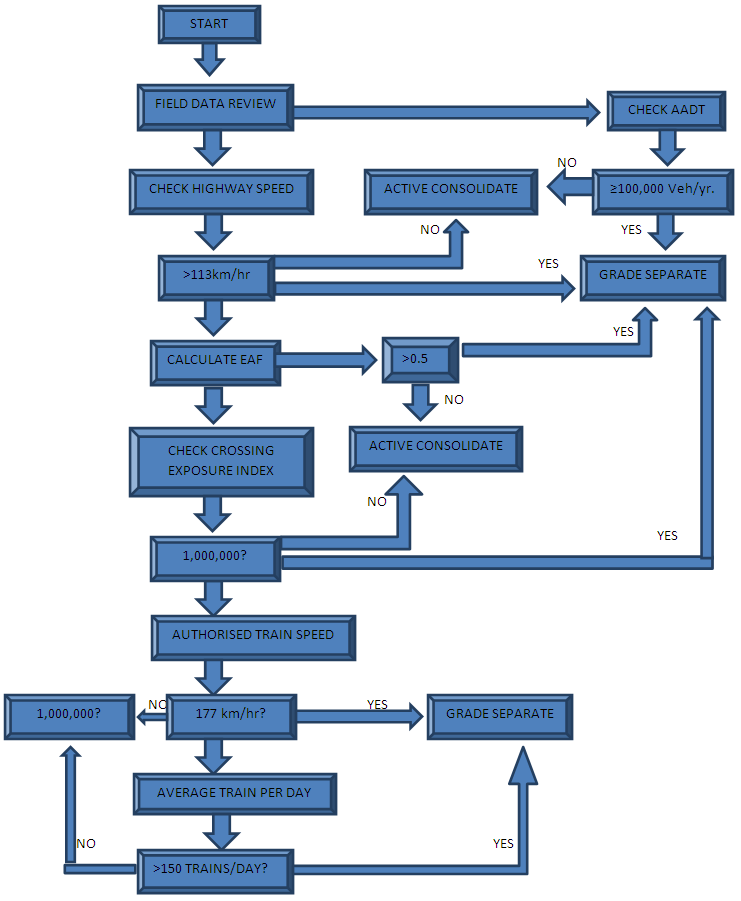 | Figure 6. Flowchart for Selection Processes for Level Crossings |
4. Conclusions and Recommendations
From the results obtained, it is noticed that additional steps should be taken to bring all crossings into full compliance with the MUTCD. Some crossings warrant additional TCDs beyond MUTCD standards and this was determined as a result of the research carried out. From the review of the results generated on all the level crossings, the following are recommended:1. All the traffic control devices at all the crossings should be resuscitated for functional and effective use to reduce crash frequency. 2. Grade separation should be provided at Agege level crossing because the expected crash frequency (ECF) for gates exceeds 0.02, AADT exceeds 100,000 and the expected accident frequency (EAF) for active devices with gates, as calculated by the USDOT Accident Prediction Formula including 5-year accident history, exceeds 0.5. 3. At Jibowu Level crossing, supplemental signing and/or pavement markings are required where a railroad grade crossing is located less than 80 ft. (25 m) before an intersection as measured from the stop line at the intersection to the closest rail on the crossing. This applies to all the intersections evaluated.4. At Yaba level crossing, the automatic gate should be should be provided to eliminate vehicular and pedestrian crashes along the intersection.
References
| [1] | Highway-Railroad Grade Crossings, a Guide to Crossing Consolidation Closure. Federal Railroad Administration/ Federal Highway Administration. Washington, D.C., July 1994. |
| [2] | Lagos Metropolitan Area Transport Authority, Proposed Rail Project. Lagos State Government, Nigeria (2007). |
| [3] | Light Rail Transit Grade Separation Guidelines - An Informational Report. Technical Committee 68-42.Institute of Transportation Engineers. Washington, D.C., March 1992. |
| [4] | Manual on Uniform Traffic Control Devices for Streets and Highways. Federal Highway Administration. Washington, D.C., 2000 Edition. |
| [5] | Molitoris, Jolene M. and Rodney E. Slater. Highway-Rail Grade Crossings: A Guide to Consolidation and Closure. U.S. Department of Transportation: Federal Railroad Administration & Federal Highway Administration. Washington D.C.: GPO, 1994. Print. |
| [6] | Ogden, Brent D. Railroad-Highway Grade Crossing Handbook – Revised Second Edition. Korve Engineering for U.S. Department of Transportation: Federal Highway Administration. Washington D.C: GPO, 2007. Print. |
| [7] | Railroad-Highway Grade Crossing Handbook - Second Edition. Report No. FHWA TS-86-215, Federal Highway Administration. Washington, D.C., September 1986. |
| [8] | Traffic Controls for Highway - Light Rail Transit Grade Crossings. Manual on Uniform Traffic Control Devices, Part 10. |
| [9] | U.S. Department of Transportation: Federal Highway Administration. Guidance on Traffic Control Devices at Highway-Rail At-Grade Crossings. Washington D.C.: GPO, 2002. Print. |

 Abstract
 Reference
 Full-Text PDF
 Full-text HTML