-
Paper Information
- Paper Submission
-
Journal Information
- About This Journal
- Editorial Board
- Current Issue
- Archive
- Author Guidelines
- Contact Us
International Journal of Traffic and Transportation Engineering
p-ISSN: 2325-0062 e-ISSN: 2325-0070
2016; 5(2): 27-31
doi:10.5923/j.ijtte.20160502.01

Developing Direct Demand AADT Forecasting Models for Small and Medium Sized Urban Communities
 Abstract
 Reference
 Full-Text PDF
 Full-text HTML
Mehrnaz Doustmohammadi , Michael Anderson
Department of Civil and Environmental Engineering, The University of Alabama in Huntsville, Huntsville, USA
Correspondence to: Mehrnaz Doustmohammadi , Department of Civil and Environmental Engineering, The University of Alabama in Huntsville, Huntsville, USA.
| Email: |  |
Copyright © 2016 Scientific & Academic Publishing. All Rights Reserved.
This work is licensed under the Creative Commons Attribution International License (CC BY).
http://creativecommons.org/licenses/by/4.0/

Annual Average Daily Traffic (AADT) is a critical input to many transportation analyses. Due to cost limitations, AADT data is not typically collected for local roads, however, the necessity of having AADT data for the purpose of making safety decisions is not diminished in the case of local roads, so a methodology was required to be able to generate AADT data in areas where manually acquiring data is not economically feasible. This research was conducted to develop models that can accurately estimate AADTs within a small or medium sized community. The models use a combination of roadway and socio-economic factors within a quarter-mile buffer of the desired count location. The models were tested using a collection of statistical tests to ensure the robustness of the models, validated to additional data collected for the community, and a transferability test of the models was performed to test the ability of the model to accurately predict across different communities of similar size. The results of the paper indicate that direct demand AADT estimation models can be accurately developed and transferred to other communities of similar size to support AADT estimation on desired roadways in different communities.
Keywords: Annual Average Daily Traffic, Statistical Analysis, Urban Communities
Cite this paper: Mehrnaz Doustmohammadi , Michael Anderson , Developing Direct Demand AADT Forecasting Models for Small and Medium Sized Urban Communities, International Journal of Traffic and Transportation Engineering, Vol. 5 No. 2, 2016, pp. 27-31. doi: 10.5923/j.ijtte.20160502.01.
Article Outline
1. Introduction
- Annual Average Daily Traffic (AADT) is a critical input to many transportation analyses, safety assessments, maintenance schedules, capacity improvements, etc. AADT is defined as the average 24-hour volume at a highway location over a full year. The amount of labor and the associated costs required to collect actual AADT data for every roadway in a community, even for a small area, are so extreme that it is unfeasible that any community would be able to gather AADT data for every roadway in the community to fully support the transportation analyses previously mentioned. Due to cost limitations, AADT data is typically extrapolated from selected 48-hour data counts taken along major roadways in a community, excluding local roads from the data collection efforts. However, the importance of AADT is not diminished on local roads and the relevance of the data to support public safety decisions and traffic flow analysis still exists. For example, one area where having quality AADT data is in the calculation of crash rates on local roads and the implementation of crash reduction factors. In order to accurately identify areas in which high crash levels occur and to successfully appropriate money wisely on potential improvements, quality AADT data is required.The demand for quality AADT data on local roads, coupled with the lack of available accurate data, has prompted this research to examine and develop a model that can accurately estimate AADTs within a small or medium sized community. The models use a combination of roadway and socio-economic factors within a quarter-mile buffer of the desired count location. The model objectives were to be able to take data near a desired AADT site and develop a reasonable estimate of the AADT. In this study, two medium-sized cities (with metropolitan populations roughly 300,000) and two smaller cities (with metropolitan populations roughly 80,000) were selected. Two models were developed, one for each population size city. The models were tested using a collection of statistical tests to ensure the robustness of the models, validated to additional data collected for the community, and a transferability test of the models was performed to test the ability of the model to accurately predict across different communities of similar size. The results of the paper indicate that direct demand AADT estimation models can be accurately developed and transferred to other communities of similar size to support AADT estimation on desired roadways in different communities.
2. Literature Review
- The collection and development of models for the development and estimation of AADT is not a novel concept (Gecchele et al., 2011; Zhong and Liu, 2007; Sharma et al., 1996; Sharma et al., 2001; Zhao and Park, 2004). Over the past thirty years, the focus of traffic counts was to determine the best methodology for developing AADT counts from short duration counts. A report developed by Garber (1984) presented methodologies to optimize the time and cost associated with the collection of traffic count data. The result of the study show that the collecting data on Monday, Tuesday and Wednesday provided better AADT estimation due the stability of traffic during these days (Garber, 1984). However, these models were based on traditional count methodologies and still required the expense associated with field data collections.An AADT prediction model for county roadways was developed over two decades ago for application in Indiana (Mohamad et. al, 1994). The model utilized regression analysis and 11 independent variable to predict AADT for county roads, as the Indiana Department of Transportation, like most state departments of transportation, does not monitor traffic counts on county roadways as they do in the cities (Mohamed et. al, 1994). The methodology presented was designed to provide an efficacious method for highway departments to accurately estimate county roadway AADTs.A study in Florida conducted by Zhao (2001) used statistical analysis and regression to determine the contributing factors for AADT estimation. The selected variables in the model included functional classification, number of lanes, access to regional employment centers, directness of expressway access, and population and employment proximal to the count location (Zhao, 2001). A limitation of the study was the inability to transfer the models to other urban areas (Zhao, 2001). An alternate methodology was proposed and utilized step-wise regression to relate socio-economic data for each county in Florida with the total roadways in the respective county (Pan, 2008). While the statistical application of the stepwise regression was applauded, the overall lack of quality roadway count data to support the development of the models results in large prediction errors and the models suffered from limited applicability (Pan, 2008).Developing estimated AADT for safety analysis was proposed by Wang (2012) to allow for safety studies to be performed on minor roadways where no count had been previously conducted. The model developed operated similarly to a trip generation model where the parcel level data in the location near the area the count was desired was used to estimate the AADT (Wang, 2012). This model was shown to have good error measurements and was shown to be applicable for safety analyses; however, there was no discussion of transferability to other locations.Using Geographic Information Systems (GIS) to collect data for estimating AADT have been shown to be effective (Lowry, 2012). The study by Lowry (2012) used linear regression and variables that included number of lanes and speed limit to predict AADT. The results of the report indicate that the models developed were of statistical validity to be used in practical application (Lowry, 2012). The literature reviewed in this paper supports this effort by identify variables and concepts that have been previously attempted to support the development of AADT model. The tools identified: linear regression, stepwise regression and GIS will be utilized in this work to produce the best models that have the potential to be transferred to other urban areas.
3. Data Collection
- The purpose of this paper is to develop models to estimate AADT for local roadway or locations where traffic counts have not been conducted. The data necessary to support the development of the models were collected and managed using ArcGIS, a commercially available desktop geographic information system (GIS) program. Within ArcGIS, a database was developed that contained roadway characteristics (number of lanes and functional classification) as well as multiple layers of socio-economic data: population obtained from the Census Department and retail and non-retail employment at specific business locations obtained from the communities serving as case study locations that were used in the long-range transportation plans recently completed by the individual communities. A series of actual AADT values were included to develop the models that were made available through the State Department of Transportation’s roadway count program. The actual data collected included the real AADT, total number of lanes for the roadway, roadway functional classification, population within a 0.25 mile buffer of the count location, retail employment within a 0.25 mile buffer of the count location, and non-retail employment within a 0.25 mile buffer of the count location.To quantify the roadway functional classification for inclusion in the multiple linear regression models, the following convention was used:Collector road = 1,Minor arterial = 2, andPrincipal arterial = 3.This convention was selected as the highest functionally classified roadway would have the greatest value and this should have the desired effect that the parameter for this variable would be non-negative. Additionally, is should be noted that freeways and interstates were explicitly not included in the study or model development because the surrounding socio-economic variable would not be relevant for these roadways because they would not have the access to the facilities due the controlled nature of the roadway system. The direct demand forecasting model was therefore developed using the following convention:The response variable is:- Traffic volume; AADTThe predictors (independent) variables are:- Function classification of the road; FCLASS- Number of lanes; LANE- Population within a 0.25 mile buffer around a traffic count station; POPBUFF- Retail Employment within a 0.25 mile buffer around a traffic count station; RETAILEMPBUFF- Non-Retail Employment within a 0.25 mile buffer around the traffic count station; NONRETAILEMPBUFF
4. Model Development
- Multiple linear regression analysis was used in this study to produce the direct demand AADT forecasting models. All the statistical analyses were conducted using Minitab and in accordance with standard statistical methodologies (Montgomery, 2012). Regression analysis was selected as this methodology is used to predict the value of one or more responses, AADT in this study, from a set of predictors, roadway and socio-economic variables. It can also be used to estimate the linear association between the predictors and responses. R2 is the coefficient of multiple determinations and indicates the proportion of the variability in the observed responses that can be attributed to changes in the predictor variables (Montgomery, 2012).For the communities studied in the work, the direct demand AADT forecasting models developed were as follows:Montgomery:AADT = -5625 + 8493 FCLASS + 219 LANE – 1.16 POPBUFF - 0.58 NONRETAILEMPBUFF + 11.55 RETAILEMPBUFFGadsden:AADT = -12590 + 4478 FCLASS + 4644 LANE - 1.15 POPBUFF – 0.86 NONRETAILEMPBUFF + 7.91 RETAILEMPBUFFR2 for Montgomery and Gadsden models are 82% and 79%, respectively. It must be mentioned that although the models have statistical validity, the results of the models can result in unrealistic values if they are applied to situations outside the data used to develop the models. Additionally, it is possible for the results to be negative, and these values should be taken as indication that the model is not valid for these roadways.In an attempt to improve the models, a stepwise regression analysis was run in Minitab to test relative importance of each dependent variable and their contribution to the independent AADT data, a variance inflation factor value was determined to test if multicollinearity is present in a regression analysis, and a Mallows’ Cp statistic was calculated to determine if the number of independent variables was too high and the model was over specified. All tests indicated that five variable models for estimating AADT was appropriate for the model and the variables chosen to be included in the model were adequate.
5. Statistical Validation
- Validation of the two models was conducted using sets of data collected from cities separate from the data sets used to build the models. Data from Huntsville, AL was used to validate the Montgomery, AL model and the area around Muscle Shoals, AL was selected to validate the Gadsden, AL. The locations were chosen because they were of similar size to the modeled cites. The data contained the same independent variables, but for different count locations. A paired t-test was performed to compare the estimated traffic count from the model to the actual AADT count from the count program. The P-value from the test indicated that there is no difference statistically between the estimated traffic count using the direct demand AADT forecasting model and the actual traffic counts. For the case study cities, the P-value for the Montgomery model tested against a second set of Montgomery data was determined to be 0.798 and for the Gadsden model tested against a second set of Gadsden data was determined to be 0.862. The test was conclusive if the P-value exceeded 0.05. The much higher P-value obtained indicated that the individual models worked very well within the community for which there were developed.
6. Model Transferability
- The transferability of the models to similar sized communities in the state was also tested to ensure the models would be applicable to other locations and that individual models would not have to be developed for every community. The City of Huntsville was used as the transferability community for the Montgomery model. The cities have similar overall population values and employment distributions. Using the model developed for Montgomery, a paired T-test was performed to test the ability to forecast AADT in Huntsville versus the actual AADT counts in Huntsville. The test concluded that the estimated AADT and the actual AADT were not different and the P-value of the test was 0.838.The combined cities of Florence, Muscle Shoals, Sheffield and Tuscumbia, known as the The Shoals, was used at the transferability community for the Gadsden model. As with Huntsville and Montgomery, the communities share similar population values and employment distributions. Using the model developed for Gadsden, a paired T-test was performed to test the ability to forecast AADT in The Shoals versus the actual AADT counts in The Shoals. The test concluded that the estimated AADT and the actual AADT were not different and the P-value of the test was 0.899.Again, the high P-values in both results indicate that the models showed very good transferability to similar communities. Figure 1 and 2 show the scatterplots of the model when applied to the transferability city.
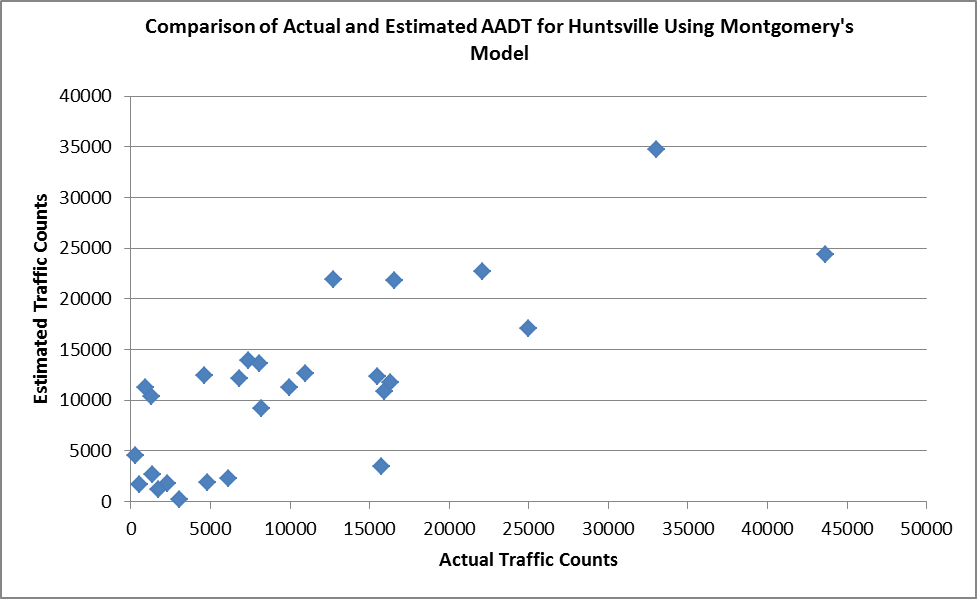 | Figure 1. Comparison of Actual and Estimated AADT for Huntsville Using Montgomery’s Model |
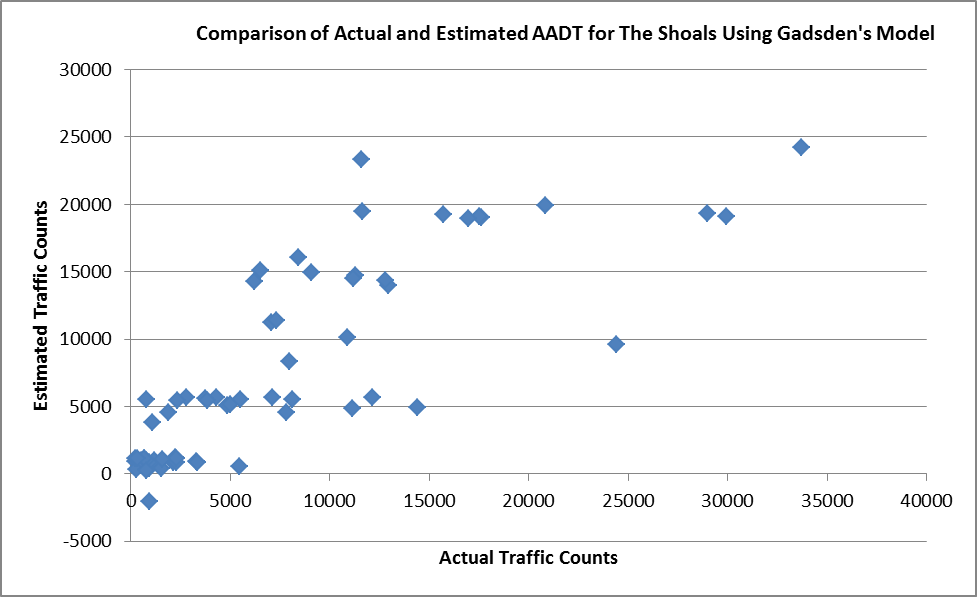 | Figure 2. Comparison of Actual and Estimated AADT for The Shoals data Using Gadsden’s Model |
7. Conclusions
- This paper examined the development and testing of linear regression techniques to estimate AADT from a collection of roadway data and socio-economic factors near a location where an estimate of the AADT is desired. The data selected for model input included the total number of lanes on the roadway, roadway functional classification, population within a 0.25 mile buffer of the count location, retail employment within a 0.25 mile buffer of the count location, and non-retail employment within a 0.25 mile buffer of the count location. The models developed in this work, one for a medium sized area (population roughly 300,000) and one for the smaller area (population roughly 80,000), were tested statistically to ensure that the models were not including unnecessary variables, that the models could accurately estimate AADT counts in the community for which they were developed, and that the models could accurately estimate AADT counts in communities of similar size and employment.The results of this work indicate that quality models can be developed using these variables for medium and smaller urban communities that are statistically valid and have strong transferability to other communities. The overall ability to estimate AADT data through models, versus having to manually collect counts, represents a significant time and cost savings without sacrificing much accuracy and the output from this work demonstrates that the estimated AADT data from the models would be suitable for safety analysis, maintenance scheduling, capacity analysis as well as other transportation system analyses.
ACKNOWLEDGEMENTS
- This paper was made possible by funding provided by the Alabama Department of Transportation.