International Journal of Traffic and Transportation Engineering

p-ISSN: 2325-0062    e-ISSN: 2325-0070

2016;  5(1): 19-26

doi:10.5923/j.ijtte.20160501.03


Comparison of Freight Demand Forecasting Models

Ehsan Doustmohammadi1, Virginia P. Sisiopiku1, Michael D. Anderson2, Mehrnaz Doustmohammadi2, Andrew Sullivan1

1Department of Civil Engineering, University of Alabama at Birmingham, USA

2Department of Civil Engineering, University of Alabama in Huntsville, USA

Correspondence to: Ehsan Doustmohammadi, Department of Civil Engineering, University of Alabama at Birmingham, USA.

Email:

Copyright © 2016 Scientific & Academic Publishing. All Rights Reserved.

This work is licensed under the Creative Commons Attribution International License (CC BY).
http://creativecommons.org/licenses/by/4.0/

Abstract

In recent years, many governmental agencies and private companies came to a growing realization of the need for accurate forecasting freight volumes as part of the travel demand forecasting process. Freight demand forecasting is a complex process and has not been explored in the same degree as travel demand forecasting for passenger vehicles. The purpose of this paper is to provide a review and synthesis of available freight demand forecasting models to assist stakeholders in their efforts to incorporate such models into the transportation planning process. The paper examines and contrasts traditional freight demand forecasting models and as well as more recently proposed tour-based models, and discusses model features, advantages, limitations, and suitability for application.

Keywords: Freight Transportation, Traditional Freight Models, Tour-based Models

Cite this paper: Ehsan Doustmohammadi, Virginia P. Sisiopiku, Michael D. Anderson, Mehrnaz Doustmohammadi, Andrew Sullivan, Comparison of Freight Demand Forecasting Models, International Journal of Traffic and Transportation Engineering, Vol. 5 No. 1, 2016, pp. 19-26. doi: 10.5923/j.ijtte.20160501.03.

1. Introduction

In the US, 117.5 million households, 7.4 million business establishments, and 89,500 governmental units are part of an enormous economy that demands the efficient movement of freight [1]. The freight transportation system comprises five basic transportation modes, namely, highway, rail, water, air and pipelines. Goods are shipped either by a single mode or a combination of modes.
According to the 2012 Commodity Flow Survey (CFS), produced by the US Bureau of the Census, over 11 billion tons of commodities valued at greater than $13 trillion are shipped annually over the nation’s freight transportation system in the United States [1]. In 2012, based on value and tonnage, trucking was the dominant mode used to transport freight in the United States, handling roughly 70% of the nation’s freight movements [1]. With the heavy reliance on trucks for freight transportation, the need to consider their impacts on the roadway system performance becomes of paramount importance. This, in turn, creates a need to consider freight transportation as part of the transportation planning process to ensure that the roadway network does not impose any limitations in freight mobility and vice versa.
To assist in the transportation planning process, efficient and reliable freight demand forecasting models are required to predict short- and long-term freight demand, freight’s impact on transportation network operations and the interaction between truck and passenger vehicle travel. This research paper reviews freight transportation forecasting modeling approaches focusing on input needs and requirements, key assumptions and processes, expected outputs, and suitability for application. The modeling approaches include traditional freight forecasting models and recently proposed tour-based models. This paper provides researchers and practitioners with knowledge to better understand capabilities and limitations of freight forecasting modeling options and assists them in their efforts toward selecting the best model for adoption.

2. Freight Forecasting Modeling Issues and Challenges

As freight demand continues to grow, transportation planners and operators face greater pressure to develop improved approaches for tracking and analyzing commodity flows [4]. Several research studies confirm that the development of freight forecasting methods still lags behind the development of passenger transportation forecasting, as far as both theoretical and simulation modeling analyses are concerned [2, 3, 6, 8, 9, 12, 16, 19, 23, 24, 26, 29].
One difficulty in forecasting freight demand relates to the numerous parties involved in the shipping process and the large variety of commodities that are moved by the available transportation modes. The lack of a standardized freight modeling framework and the inherent limitations of freight disaggregated data availability have hindered the development and use of freight forecasting models [2]. In addition, the existence of a wide array of metrics used to quantify freight traffic such as freight trips, tonnage, volume, mode, value schedule and tours adds to the complexity of accurately capturing the impact of policy decisions on travel times, reliability and costs [3].

3. Freight Demand Modeling Approaches

3.1. Traditional Freight Demand Forecasting Models

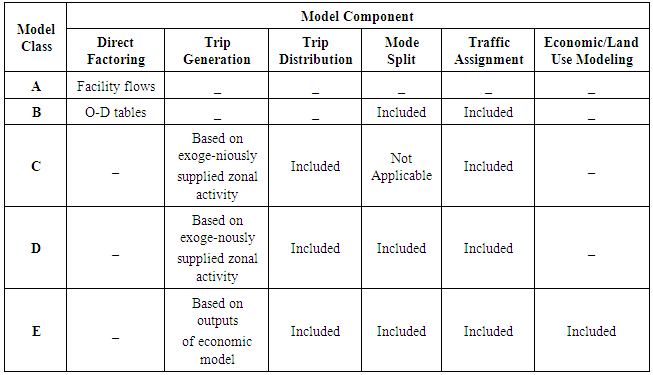
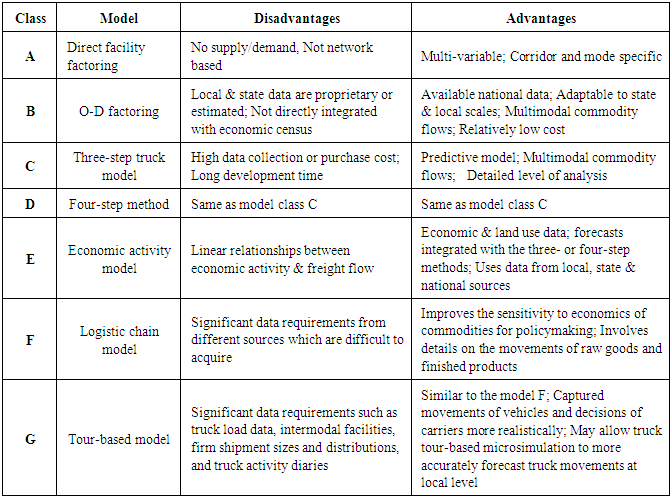
In 2008, the National Cooperative Highway Research Program (NCHRP) published a comprehensive review of traditional freight demand forecasting models used in practice in the US [4]. According to the NCHRP report, five approaches are most commonly employed in freight demand forecasting and are classified from A to E as follows [4]:
Class A: Direct facility flow factoring method,
Class B: O-D factoring method
Class C: Truck model
Class D: Four-step commodity model, and
Class E: Economic activity model.
More specifically, Class A (Direct facility flow factoring method) involves estimating a growth factor from current and past truck count data and applying the growth factor to observed truck traffic volumes. This method is mostly used for the short-term forecast of freight truck flows to determine link-by-link volumes [4, 5].
Class B (O-D factoring method) is similar to Class A except that the growth factors are being applied to the base year Origin–Destination (O–D) trip table [6].
In Class C (Truck model) aggregate truck trips are generated separately for internal trips between zones (I-I) and external trips between internal and external zones (E-I, I-E, and E-E). The truck types often considered in truck models are broadly classified into light, medium, and heavy trucks based on gross vehicle weight ratings. The Class C model uses the traditional trip distribution and traffic assignment method to assign the truck trips to the network links [4]. Truck models cannot analyze shifts between modes since, by definition, they comprise only the truck freight mode. They are usually part of a comprehensive model which estimates both passenger and goods transportation and consequently use a simultaneous assignment of truck trips with vehicle trips.
Class D (Four-step commodity model) is a commodity-based version of the Class C vehicle-based model. The model develops forecasts of commodity flow and converts the commodity truck flow into daily freight truck trips as part of the modeling process [2]. This method has been used as a statewide freight model framework by several states such as Texas, Wisconsin, Florida, Iowa, and Pennsylvania [4, 5]. The principal shortcoming of this approach is the limited detail regarding local pickup and delivery trips and service trips which are generally not captured in the commodity flow data sets or service trips [6]. Therefore, truck tours or trip chains are overlooked in the traditional four-step commodity modeling approach [7].
Class E (Economic activity model) is a model with two key elements that work together: i.e., an economic/land use model and a freight transportation demand model [5]. Hence, it is crucial to grasp the interrelationships between the land use, economic factors, and freight transportation in order to develop robust models to accurately perform freight flows estimation using economic activity models [1].
Table 1 summarizes the five basic model classes (A through E) and six modeling components. The model classes share many basic components [4]. It should be noted that the literature review suggests that no model in classes A to E alone is capable of addressing all freight policy and analytical needs [4, 5]. Also, the models pay little attention to truck types, trip patterns, trip lengths, or comparisons with truck counts (which are very difficult to obtain).
Table 1. Freight Model Classes and Components
     
A 2000 study by Holguín-Veras and Thorson presented two major modeling frameworks for freight modeling, namely the trip-based modeling and commodity-based modeling [16, 17]. An advantage of trip based-models is requiring minimal amounts of data that are readily available through routine traffic counts and freight surveys. The commodity-based models, on the other hand, measure freight amounts by weight, thus more accurately capturing the fundamental economic mechanisms that drive freight movements. Figure 1 shows a comparison of Trip-based and Commodity-based frameworks [17].
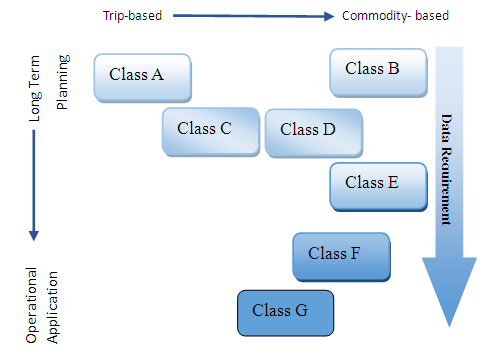
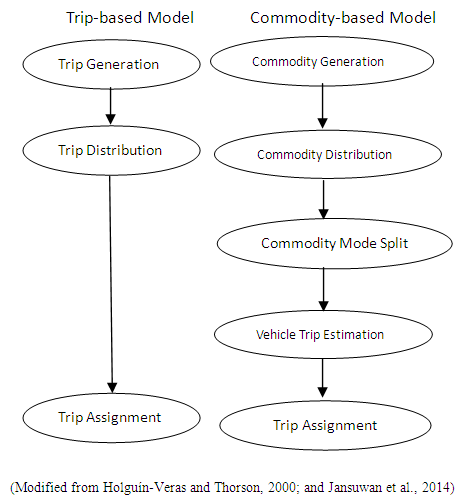
Figure 1. Trip-based and Commodity-based Models

3.2. Advanced Freight Demand Forecasting Models

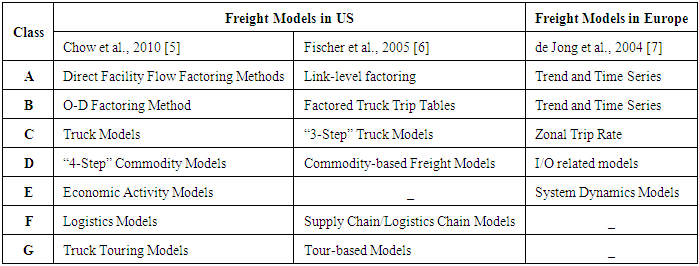
The two primary types of freight models commonly used in practice (i.e., vehicle-based or commodity-based) suffer from major limitations. Vehicle-based models fail to model the underlying economic behaviors from which the demand is actually derived; while commodity-based models fail to realistically account for vehicle activities, especially in urban settings, for which evaluation and impact assessment are most crucial [2, 5].
To address some of these limitations, in the recent years, advanced freight demand forecasting models have been proposed, trending towards more disaggregate models that incorporate supply chain procedures or truck touring aspects. As Fischer et al. concluded, two additional classifications should be considered, namely Logistics Chain Models (Class F) and Vehicle Touring Models (Class G). These new classifications result from the need to improve on the sensitivity of models in the economics of commodities for policy making (Class F) and more realistically capture the movements of vehicles (trucks) for impact assessments (Class G) [6]. Table 2 summarizes all models considered with respect to classifications discussed in various studies [3, 5, 6, 7].
Table 2. Freight Model Classes
     
In general, Class F (logistics chain models) allow the use of intermediate stops to represent distribution channels [3, 5, 6, 7, 27]. The literature review confirms that there are various benefits of using logistics models. Most importantly, using commodity flow information to establish the total amount and type of goods that needs to be shipped helps us to better understand how freight moves through a logistics chain [6]. The literature review also highlights some drawbacks related to Class F models. For example, logistics chain models fail to accurately process mixed shipments of goods, which frequently occur in local pickup and delivery movements, when many industries and commodities become intermingled, and cannot properly capture service truck activity [3].
Traditional freight forecasting models estimate independent trips between pairs of origins and destinations (O-D) based on corresponding zonal attributes and impedances and thus, are unable to capture chaining trip behavior. Tour-based models (Class G) address this limitation by considering tours (instead of trips) as the unit of movement being modeled and capturing the interrelated chaining of truck trips forming a complete single tour [5, 6]. Input data requirements for tour-based models include household travel and activity data, spatial data in terms of land use, population and household demographics, and employment [9, 12, 15]. The literature review confirms that vehicle/truck tours can be either modeled at the individual truck level using disaggregate tour models, or through aggregate models estimating total flow along possible tours [5, 6, 10]. Moreover, recent studies provide evidence that tour-based models help forecast movements of mixed commodities more efficiently than logistics chain models due to the lack of data describing financial transactions between producers and consumers. Economic data are ultimately used to generate control totals, but they do not generate specific truck trips or flows of goods [5, 6].
Table 3 provides a comprehensive list of commodities that would benefit from the tour-based modeling approach using the North American Industrial Classification System (NAICS) [6].
Table 3. Appropriate Modeling Techniques by Industry Type [6]
     
The comprehensive literature review conducted in this paper suggests that, until recently, most of the work on truck tour-based models was conducted in a research setting [8, 9, 11, 13, 14, 15]. The limited implementation of tour-based modeling has been linked to the difficulty of obtaining the detailed data necessary to develop the models. To address this problem, Gliebe et al. used an establishment survey to develop a commercial tour model as part of the Ohio statewide travel model [11]. Hunt and Stefan applied a random utility discrete choice model to a truck tour model using a truck diary flow survey of over 3,100 business establishments in the Calgary region [12]. Ruan et al. [13] used Texas regional commercial vehicle survey data to develop a truck trip chaining model for Texas and Outwater et al. developed a tour-based and logistics supply chain model for the Chicago area [14]. Figure 2 depicts the freight forecasting framework applied in the Outwater et al. study.
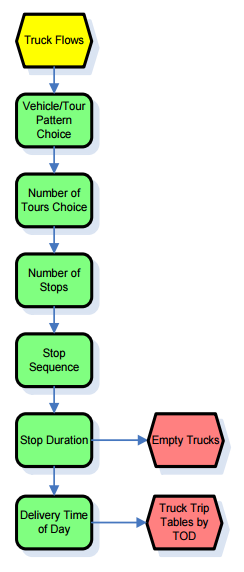
Figure 2. Freight Forecasting Framework in Chicago (Adopted from Outwater et al., 2012)
In a recently released study, Cambridge Systematics, Inc. used truck Global Positioning Systems (GPS) data to construct a tour-based truck model for the Maricopa Association of Governments region in Phoenix, Arizona [10]. The study concluded that the development and implementation of a tour-based truck model produced some discernment into truck movement patterns which could not have been performed using a traditional trip-based modeling framework [10].
Overall, the published literature on the application of tour-based models (Class G) suggests that such models are more realistic than traditional freight demand forecasting models and best suited for impact assessment and vehicle-based policy studies, such as pricing strategies and restricted lanes [5, 6, 7, 10, 12, 14, 19, 22, 28].

4. Discussion

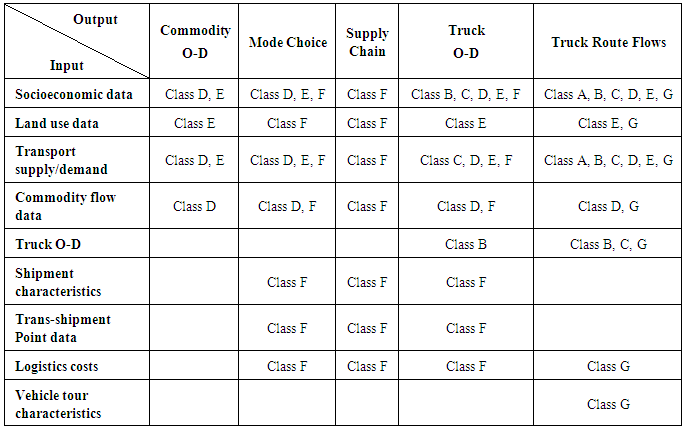
This paper summarized a variety of freight modeling techniques based on available literature sources. Seven classes of models were introduced (Class A through G), ranging from traditional direct modeling approaches to recently developed tour-based models. Earlier sections provided a summary of main features of such models along with related references whereas Table 4 illustrates the associated inputs and outputs.
Table 4. Freight Model Characteristics by Input/Output
     
Jansuwan et al. considered two major modeling frameworks and application horizons [16]. According to the findings and as shown in Figure 3, the tour-based model (Class G) with maximum data requirement is more appropriate for operational application. The Classes A and B are suitable for planning application with minimum data requirement for model development [16].
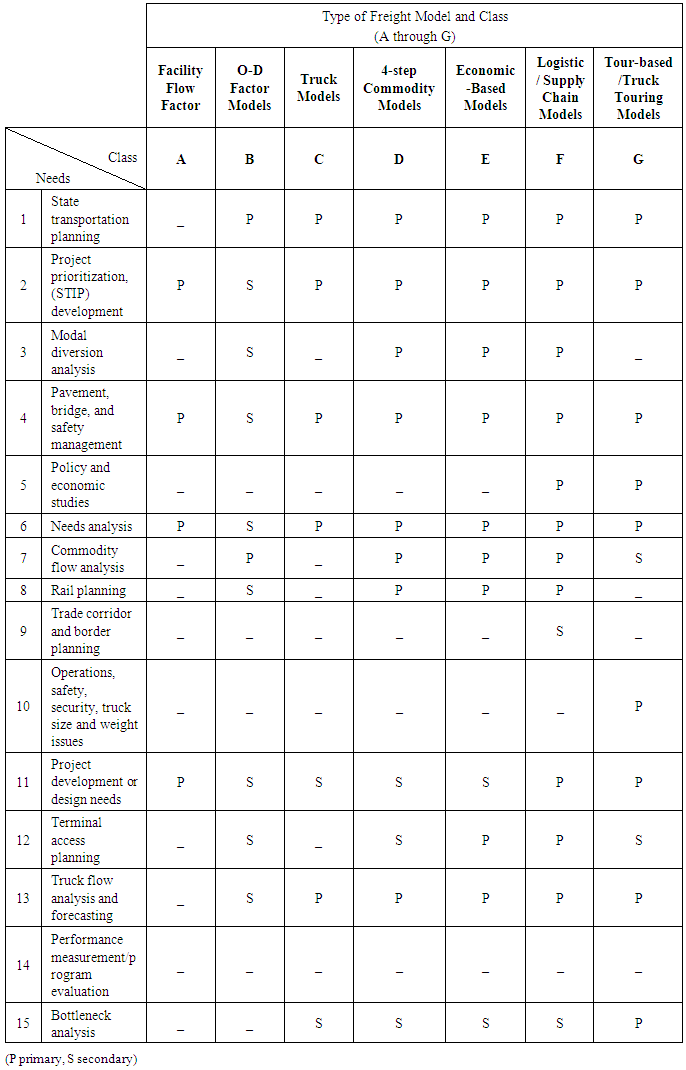
Figure 3. Freight Forecasting Models Metrics
More specifically, link-based factoring models (Class A) are appropriate to estimate of freight volumes on transportation system links, but entail many assumptions and have limited applicability. Data acquisition for Origin-Destination factoring models (Class B) is often a burden for implementation. Truck models (Class C) are limited to the freight truck mode, which may depict all commodities flows, but is unable to analyze shifts between modes. The four-step commodity models (Class D) are able to perform impacts analyses from changes in employment, trip patterns, and network infrastructure, however, they do not explain the interaction between industries. Economic activity models (Class E) employ a land use/economic model to estimate zonal employment or economic activity before the trip generation process but do not change those forecasts to account for the performance of transportation facilities. Logistics/supply chain models (Class F) can forecast household and economic activity across the county-level zones based on basic supply, demand, and cost relationships. However, such models are not readily available for use in a metropolitan setting as they cannot forecast network level flows. Tour-based models (Class G) can capture the interrelated chaining of truck trips forming a complete single tour; however, because a standard framework for such models does not yet exist, each model is highly customized, which increases the development effort and associated cost.
The investigation of freight models in this research reveals that the most recent models, namely logistics chain (Class F) and tour-based models (Class G), hold greater promise in addressing current and future freight forecasting needs as they have the benefits of addressing limitations of the previously developed models. This conclusion is also supported by a survey of state transportation departments conducted by the authors of the National Cooperative Highway Research Program Toolkit in order to identify the needs for freight forecasting tools [4, 5].
Table 5 lists state transportation agencies’ needs and priorities and the ability of the various freight demand forecasting models to meet such needs. As shown in Table 5, logistics/supply chain models and tour-based models are capable of covering several gaps in the state-of-practice models which are revealed in NCHRP 606 in terms of the policy and analytical needs [4, 5].
Table 5. State Needs versus Freight Model Classes (Adopted from Chow et al., 2010)
     
In general, the literature reviews revealed obvious pros and cons associated with each model class that need to be carefully considered prior to selection of a model for implementation. To facilitate these comparisons, Table 6 summarizes the advantages and disadvantages of the seven classes of freight models explored in this paper.
Table 6. Freight Models Advantages and Disadvantages
     
It should be also noted that the synthesis provided in this paper is comprehensive but not all-inclusive. Several other freight demand forecasting models have been proposed, however, have not been implemented due to either the extensive requirements for data inputs that are not readily available of the lack of interest from decision makers. The value of the paper is to serve as a convenient reference source that would, in turn, enable researchers and practitioners to better understand capabilities and limitations of existing freight forecasting modeling options and assist them in their efforts toward selecting the best model for adoption.

5. Conclusions

Understanding the opportunities and challenges associated with freight demand modeling is an issue of great importance in transportation planning. The selection of a suitable model for forecasting freight traffic demand is also of major interest. The paper provides a systematic review and synthesis of the state-of-the-practice in freight demand forecasting models in order to guide the selection and adoption of such models into the transportation planning process.
The review of freight modeling techniques reveals that there is no single model which is able to meet all of the objectives. By incorporating features from several of the existing modeling frameworks it would be possible to design a freight modeling framework suitable for addressing public and private sectors’ needs. Although the tour-based models hold the greatest promise among the models explored in this study for future refinement and implementation, the model developments requires more detailed input data as well as more budget. Research efforts are currently being devoted to the development of such models and the data bases needed to develop and support them. However, the state of the art in true goods movement modelling is not yet sufficiently developed to the point where it is easily adoptable by most urban travel forecasters.

References

[1]  FHWA, Freight Analysis Framework, 2012. Available at http://www.ops.fhwa.dot.gov/freight/freight_analysis/faf/.
[2]  A. Samimi, A. Mohammadian, K. Kawamura, Behavioral paradigms for modeling freight travel decision-making, 12th International Conference on Travel Behaviour Research, Jaipur, India, 2010.
[3]  A. Alho, The adequacy of freight modeling methods to study policy/regulations’ implementation impacts in a city logistics context, Master Thesis, Technical University of Lisbon, Portugal, 2011.
[4]  H. Cohen, A. Horowitz, and R. Pendyala, NCHRP Report 606: Forecasting Statewide Freight Toolkit. Transportation Research Board of the National Academies, Report by Cambridge Systematics, Inc., and Global Insight (formerly Reebie Associates), Washington, D.C., 2008, 5-15.
[5]  J.Y.J. Chow, C.H. Yang, A.C. Regan, State-of-the-art of freight forecast modeling: lessons learned and the road ahead. The Journal of Transportation, 37 (6), 2010, 1011-1030.
[6]  M.J. Fischer, M.L. Outwater, L.L. Cheng, D.N. Ahanotu, R. Calix, An innovative framework for modeling freight transportation in Los Angeles County. Report prepared for Los Angeles County Metropolitan Transportation Authority by Cambridge Systematics, Inc., 2005.
[7]  M.A. Figliozzi, Analysis of the efficiency of urban commercial tour: Data collection, methodology, and policy implications. The Journal of Transportation Research Borad, 41(9), 2007, 1014-1032.
[8]  G.de Jong, H. Gunn, W. Walker, National and international freight models: an overview and ideas for further development. Transp. Rev. 24(1), 2004, 103–124.
[9]  L. Tavasszy, and G. Jong, Modelling Freight Transport, Elsevier Publisher, 166-191, Retrieved from http://books.google.com.
[10]  A. Kuppam, J. Lemp, D. Beagan, V. Livshits, S. Nippani, L. Vallabhaneni, Development of a tour-based truck travel demand model using truck GPS data. Proceedings of the Transportation Research Board 93rd Annual Meeting, Washington D.C. 2014.
[11]  J. Gliebe, O. Cohen, J.D. Hunt, Dynamic choice model for urban commercial activity patterns of vehicles and people. Transportation Research Record: Journal of the Transportation Research Board, 2007, 17-26.
[12]  J.D. Hunt, K.J. Stefan, Tour-based microsimulation of urban commercial movements in Alberta, Canada. Transportation Research Part B 41, 2007, 981–1013.
[13]  M. Ruan, J. Lin, K. Kawamura, Modeling commercial vehicle daily tour chaining. Proceedings of the 90th Transportation Research Board Annual Meeting, National Research Council, Washington, D.C., 2011.
[14]  M. Outwater, M., C. Smith, K. Wies, S. Yoder, B. Sana, and J. Chen, Tour-based and supply chain modeling for freight: An integrated model demonstration in Chicago. Presented at the 4th Transportation Research Board Conference on Innovations in Travel Modeling, Tampa, FL, 2012.
[15]  C. Yang, A. C. Regan, and Y. T. Son, Another view of freight forecasting modeling trends, KSCE Journal of Civil Engineering, 14(2), 2010, 237-242.
[16]  S. Jansuwan , S. Ryu, A. Chen, K. Heaslip, A Two-Stage Approach for Estimating a Statewide Truck Trip Table. Report prepared by the Utah Transportation Center, Utah State University, 2014, 5-12.
[17]  J. Holguín-Veras, E.Thorson, Trip length distributions in commodity-based and trip-based freight demand modeling. In Transportation Research Record: Journal of the Transportation Research Board 1707, 2000, 37-48.
[18]  G. de Jong, M. Ben-Akiva, A Micro-simulation model of shipment size and transport chain choice. Transportation Research Part B 41(9), 2007, 950–965.
[19]  H. Kim, D. Park, C. Kim, Y. Kim. A tour-based approach to destination choice modeling incorporating agglomeration and competition effects. In Proceedings of the Eastern Asia Society for Transportation Studies (Vol. 8), 2011.
[20]  M. Bradley, J. L. Bowman, B. Griesenbeck, SACSIM: An applied activity-based model system with fine-level spatial and temporal resolution. Journal of Choice Modeling, 3(1), 2010, 5–31.
[21]  J. de Dois Ortuzar and L. G. Willumsen, Modeling Transport, 2nd Edition, John Wiley and Sons, New York, 1994.
[22]  J. Holguin-Veras, G. R. Patil, Integrated origin-destination synthesis model for freight with commodity-based and empty trip models. Transportation Research Record: Journal of the Transportation Research Board, 2008, 60–66.
[23]  B. Knudson, J. Hunt, T. Weidner, A. Bettinard, E. Wardell, Effective modeling analysis: A case study using the Oregon Statewide Integrated Model for the Oregon Freight Plan. Presented at the 2011 TRB Transportation Planning Applications Conference, 2011.
[24]  North Carolina Truck Network Model Development Research, Prepared for the NC Department of Transportation, 2009.
[25]  Regional Planning Association, & Cambridge Systematics. Travel Demand Model Documentation and User’s Guide, 2010.
[26]  N. Wheeler, N., M. Figliozzi, Multi-criteria freeway performance measures for trucking in congested corridors. Transportation Research Record: Journal of the Transportation Research Board, 2224(1), 2011, 82–93.
[27]  Daly, A. Estimating choice models containing attraction variables. Transportation Research Part B: Methodological, 16(1), 1982, 5–15.
[28]  S. P. Greaves, M. A. Figliozzi, Commercial Vehicle Tour Data Collection Using Passive GPS Technology: Issues and Potential Applications. Institute of Transport and Logistics Studies, 2008.
[29]  J. Blonn, C. Dresser, K. Rungjang, J. Y. Guo, T. M. Adams. Freight planning at small MPOs: Current practices and challenges. In Proceedings Mid-Continent Transportation Research Symposium, 2007.