Nasser M. Abdallah , Ahmed S. El Hakim , Abdallah H. Wahdan , Mohamed A. El Refaeye
Department of Civil Engineering, Faculty of Engineering, Al-Azhar University, Egypt
Correspondence to: Nasser M. Abdallah , Department of Civil Engineering, Faculty of Engineering, Al-Azhar University, Egypt.
| Email: |  |
Copyright © 2016 Scientific & Academic Publishing. All Rights Reserved.
This work is licensed under the Creative Commons Attribution International License (CC BY).
http://creativecommons.org/licenses/by/4.0/

Abstract
This research has examined the range of methods available for estimating accident costs and mechanisms for passing such costs on. Therefore, it can be adopted the willingness-to-pay approach in estimating the human cost, through estimating the value of life. It was proposed to include both methods in the survey. Survey respondents would first be asked contingent valuation questions that probe willingness-to-pay for risk reduction in two different scenarios. Following this they would then undertake a stated preference choice. This research carry out a sample size of 400 respondents. The results indicate an estimated cost of road traffic accidents in Egypt of approximately 52 billion Egyptian Pounds (about $US 6.6 billion) for the year 2014 that accounted for 2.27% of GDP. This research and studies in other countries suggest that willingness to pay research is an important prerequisite to investment in road safety measures.
Keywords:
Accidents cost, Contingent valuation, Value of statistical life, State preference
Cite this paper: Nasser M. Abdallah , Ahmed S. El Hakim , Abdallah H. Wahdan , Mohamed A. El Refaeye , Analysis of Accidents Cost in Egypt Using the Willingness-To-Pay Method, International Journal of Traffic and Transportation Engineering, Vol. 5 No. 1, 2016, pp. 10-18. doi: 10.5923/j.ijtte.20160501.02.
1. Introduction
Road accidents represent a huge social problem. Many of these accidents are preventable and by preventing them, society increases the supply of scarce resources that can be used to increase income and improve welfare.This research is the first comprehensive study of the costs of road accidents in Egypt. One of the recent reports of the World Health Organization (WHO) in 2013 has indicated that over 91% of the world’s fatalities on the roads occur in low-income and middle-income countries, which have only about 50% of the world’s vehicles. In contrast, there are approximately 20 to 50 million persons who are exposed to non-fatal injuries as a result of these incidents, many of which lead to disability WHO [1].Ismail and Abdelmageed [2] indicate that the country could lose up to 11.8 billion Egyptian Pounds (about $US 2.1 billion) per year through road traffic accident alone. So, traffic accidents are the most serious impact of road traffic on the society. Egypt is considered the highest country in recording the highest fatality rates (Death /100,000 vehicle) as a result of road accidents, as shown in Figure 1. But, as a death rate by number of fatalities per 100,000 population, Egypt is ranked as twenty two according to information and decision making support center (IDSC) / Road accidents in Egypt [3].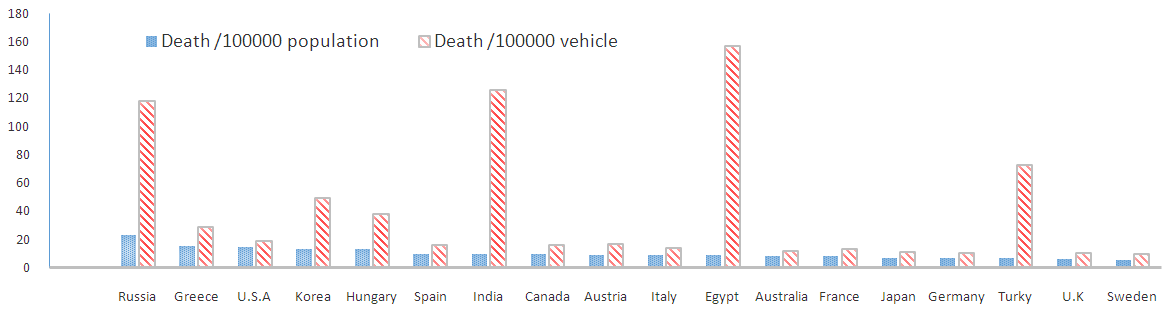 | Figure 1. Road Accident fatality rates in 2008 |
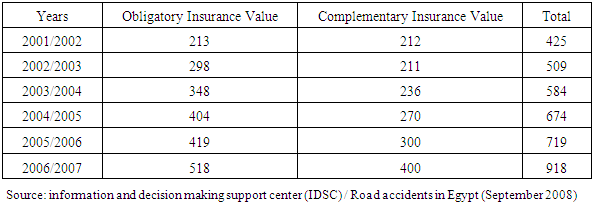
But the issue do not stopped at these numbers, but goes beyond them in the future, predicting the inflation of the problem size. This is due to many different reasons. One of the most important reasons is the simultaneous increase in the number of registered and used vehicles in Egypt, as they increased from 2.6 million vehicles in 1996 to 7.03 million vehicles in 2013, which leads us to expect the traffic problems exacerbation; and thus, traffic accident rates are expected to increase, Central Agency for Public Mobilization and Statistics (CAPMAS) [4].From Table 1 it can be seen that compensation value development awarded by insurance companies in Egypt for car accidents during the period from (2001/2002) to (2006/2007).Table 1. Compensation value development awarded by insurance companies for car accidents per Million Egyptian Pound
 |
| |
|
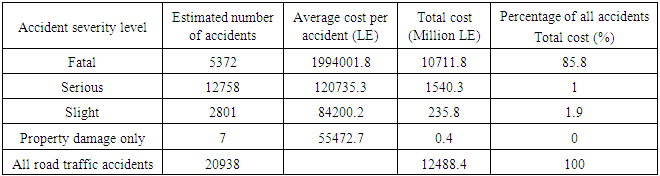
Economic loss by the road traffic accidents in Egypt estimated approximately 12 billion LE for the year 2008 as shown in Table 2. The losses can be assumed to cost the economy annually between 1 and 2% of the GDP value.Table 2. Total Cost of Road Traffic Accidents according to Severity Level in Egypt 2008, MiNTs [5]
 |
| |
|
According to the Table 2, average cost per fatal accident is estimated around 2 million LE. If number of fatal accidents would be reduced by half, gradually from 8000 in 2011 to 4000 in 2027, accumulating savings in fatal accident cost for 15 years (from 2012 to 2027) will reach up to 60 billon LE. Just comparing investment cost and savings cost, it will be easily judged for the economic viability, as long as the reduction target would be achieved. MiNTs [5].The accident costs themselves fall into two main categories: material and non-material costs. Material costs include property damage, administrative costs, medical and hospital costs, net lost production and congestion cause. The non-material costs such external costs are dominated however by the emotional and social costs of casualties resulting from transport accidents.Rune Elvik [6] stated that, four measures of accident costs are commonly used to account for the cost of accidents in different ways:Comprehensive Cost- a method of measuring motor vehicle accident costs that include the effects of injury on people's entire lives. This is the most useful measure of accident cost since it includes all cost components and places a dollar value on each one.Years Lost Plus Direct Cost- includes the same cost components as the comprehensive cost category; however, it replaces lost earnings, lost household production, and pain and lost quality of life with a non-monetary measure: lost years. Those costs in this category which are given a monetary value are known as direct cost.Human Capital Cost - includes all comprehensive cost components except pain and lost quality of life. Willingness-to-pay approach has many supporters, and from a theoretical point of view is the best approach, assessing willingness-to-pay empirically has turned out to be very difficult. Studies have been reported in many countries, but the results vary enormously. In view of this, there is a need for more research concerning how best to elicit willingness-to-pay for improved road safety.This research has examined the range of methods available for estimating accident costs and mechanisms for passing such costs on. After that it can be conclude regarding the various cost categories and estimation techniques.This research aims to make an initial estimation of the life value of Egypt cars' drivers, and the quest to use it in estimating the size of the annual economic and social losses incurred by the state as a result of traffic accidents.
2. Literature Survey
Different methods are available for estimating costs which are produced by different countries according to their needs or requirements. Here some popular methods are listed.1. Gross Output Methodology:2. Human Capital Methodology: 3. Net Output Methodology: 4. Life Insurance Methodology: 5. Court Award Methodology: 6. Implicit Public Sector Valuation Methodology: 7. Willingness-to-pay Methodology: Generally, accident costs can be estimated using either the avoidable costs approach or the WTP approach. The avoidable cost approach incorporates a valuation of fatalities based on the discounted value of future income of an average fatal traffic accident victim. This human capital valuation plus other costs such as hospital, police, and property damage costs. The human capital estimate is usually the largest proportion of avoidable cost estimates. Alternatively, a WTP approach can be used to derive a value of statistical life and serious injury, or to estimate values of WTP to avoid accidents. However, other unperceived costs usually still need to be added to determine comprehensive WTP based accident costs. WTP values can be determined using contingent valuation and stated preference surveys or by analysis of revealed preference data. Contingent valuation and stated preference methods involve surveys to determine the willingness of people to pay for products or attributes in hypothetical situations. Revealed preference methods derive values from people’s actual purchases and actual real-life decisions and choices. Contingent valuation and stated preference survey approaches were preferred because the context can be controlled and the responses are therefore more likely to be consistent and relevant to the application for which the value is being derived, Henry Le and etl, [8]Over the last two decades, in a number of countries, surveys to derive WTP based value of life estimates have typically used a contingent valuation technique, Viscusi and Aldy. [9]. Recently researchers Hasan A. Mohamed [10] in KSA, and Ainy and et al. [11] in Iran, and Mofadal AI and et al. [12] in Sudan accident costs have been derived using a willingness-to-pay (WTP) approach with contingent valuation (CV) method. Also, recently researchers Rizzi, L and et al. [13] and Hojman, Or-tuzar & Rizzi [14] in Chile and de Blaeij et al. [15] in Netherlands have experimented with stated preference surveys to derive values of statistical life and severe injury. The stated preference survey method involves a series of scenarios requiring people to choose between two routes with different levels of safety, travel time, and other characteristics. Statistical analysis is then used to derive the value of statistical life.Following a review of previous studies, using the stated preference approach shows that it have several advantages as follow: Applying this method at the same time as the travel time and vehicle operating cost stated preference surveys would improve the consistency be-tween the accident cost estimates and the other values. Using this method would also provide the opportunity to contribute to the latest research in this field. However, as this method has not been widely applied, there was a greater risk associated with relying only on this method to derive values. There might be unanticipated pit-falls when applying it in Egypt that would only become apparent during the actual surveys or even in the subsequent analysis. For this reason, it was considered prudent also to include some contingent valuation questions as part of the survey design.
3. Methodology
In order to strike a balance between using a reliable yet up-to-date method, it was proposed to include both methods in the survey. Survey respondents would first be asked contingent valuation questions that probe WTP for risk reduction in two different scenarios. Following that a stated preference choice will be undertaken. It was anticipated that using both methods would increase the certainty of obtaining reliable results and enable comparison of the accident values derived from both methods.
3.1. Sample Size
Recently, it becomes very popular to use Sample Calculator through the internet access to estimate the Sample size. Sample Calculators are utilized the following equation. In terms of the population selected, the sample size n and margin of error E are given by: | (1) |
 | (2) |
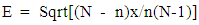 | (3) |
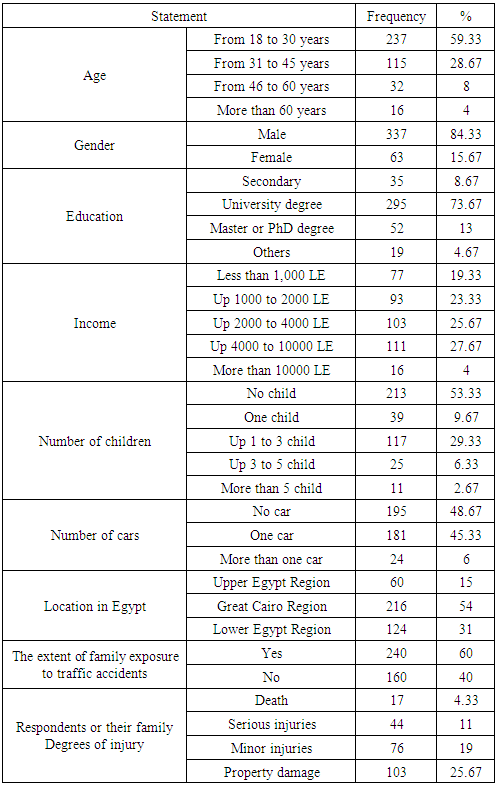
Where: N = the population size, r = the fraction of responses that you are interested in, and z(c/100) = the critical value for the confidence level c. Technically, the main factors affecting the sample size are:1- Confidence Interval2- Confidence LevelFor this research the Confidence Level is considered 95% and the Confidence Interval is considered ±5%. Running the abovementioned sample calculators the obtained sample size is 385. This research carry out a sample size of 400 that will reduce the confidence Interval to ±4.9%. The research has identified a sample size of about 400 persons, randomly selected according to spared of Egypt cities, and age of the group set that lie between 18 to 72 years, and finally by the type of the education levels, in order to facilitate the coverage of different income categories of the society as shown in Table 3.Table 3. Demographic Characteristics of the Sample
 |
| |
|
3.2. Data Collection
Different sources of data collections have been considered to achieve the main target of this research. Field survey of road users exposed to probability/risk to be involved in accidents is implemented. State-of-The-Art for previous literatures deal with estimation accident cost resulting from road accidents is undertaken.The main objective of this Study is to obtain a reliable accident cost (AC) estimate in Egypt. Estimate of optimistic cost can be utilized to ask the Authority Decision Makers to increase the allocated fund for traffic safety and understanding the economic feasibility of doing that. During the field survey, more than 500 personal interview surveys are conducted. The data obtained by direct interview surveys are supported by additional data through intercept survey. Intercept survey data are collected at tertiary institutions, food courts and shopping malls. Another type of intercept survey is conducted by utilizing the World Wide Web (WWW). The survey by WWW was designed by using the Google Drive Forms (GDF). The GDF link is posted on Facebook Groups. The data was then processed and assessed.The survey questionnaires to derive WTP accident cost (AC) included two techniques: Ÿ Contingent Valuation (CV) Ÿ Stated Preference (SP) The difference between these two techniques in the how to ask the question. The CV approach involved direct question. In this case, respondents are simply asked to state how much they were willing to pay for a reduction in the risk of getting killed in a road accident. SP techniques provide a more sophisticated method for obtaining individuals valuations by asking respondents with pairs of hypothetical realistic scenarios. Scenarios, trade different travel attributes such as travel time, cost and number of casualty to decide which alternative to choose. The results can be used to develop Choice Models to estimate AC. The section hereunder presents the design, analysis of the CV approach and results. Then, SP approach is presented in hereinafter section.
4. Contingent Valuation Approach
4.1. Questionnaire Design
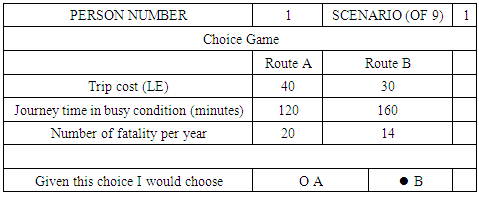
The research will depend on using a questionnaire form prepared for this purpose. This form was used by major previous studies in this field; notably the studies of Jones-Lee and et al. [16] and Henry Le and et al. [8] that conducted a comprehensive survey in the United Kingdom and Singapore, respectively. In this research some modifications based on Egypt and Egyptian local conditions and behaves are considered. It is planned to set up a questionnaire form such that it will filled within 10-15 minutes. Form contained 16 questions that fall into three broad categories:1. Factual and other questions- concerning vehicle ownership, daily kilometric, etc. as well as the usual questions concerning age, income and other personal details.2. Perception questions- intended to test the quality of individual perception of transport risk concepts.3. Valuation questions- intended to provide estimates of relevant marginal rates of substitution, relative valuation of fatal accidents.The accident CV questions were asked for different income categories. A total of 431 people completed this section of the questionnaire. The questions included previous three mentioned categories. The first part concerning vehicle ownership, daily kilometric, etc. as well as the usual questions concerning age, income and other personal details.The second part (2A) as shown in figure 2 explores whether people understand risk or they cannot. Different routes are presented with different level of road safety where Clearly Route A is safer one. The results shows that 31 of 431 with about 7% respondents answered this test question incorrectly. They did not understand the risk proposition and their subsequent answers are unreliable. Therefore, these people are excluded from further analysis.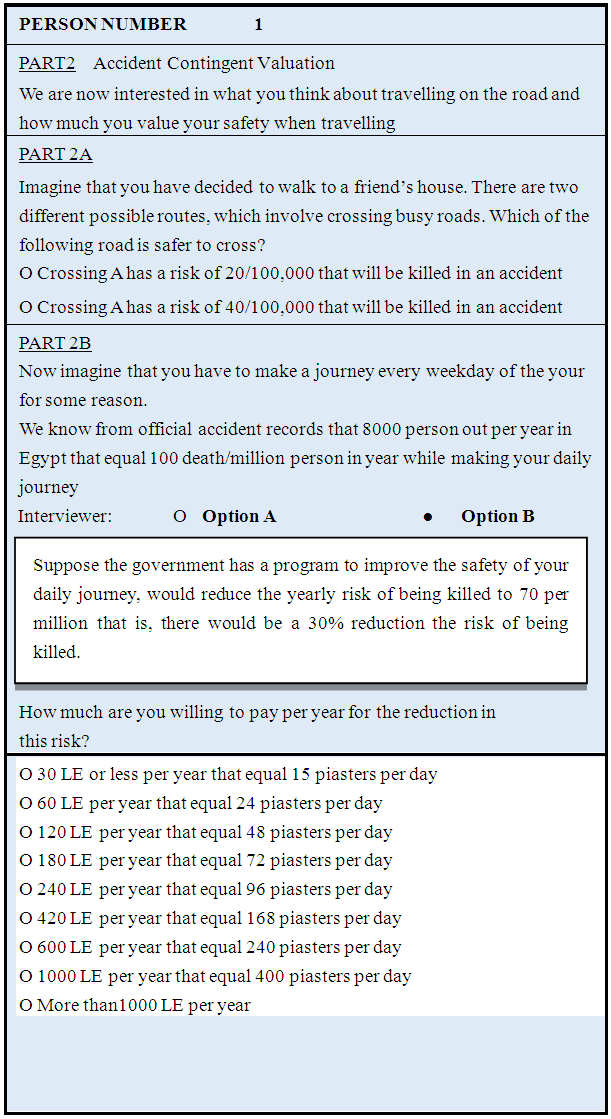 | Figure 2. Questionnaire Form |
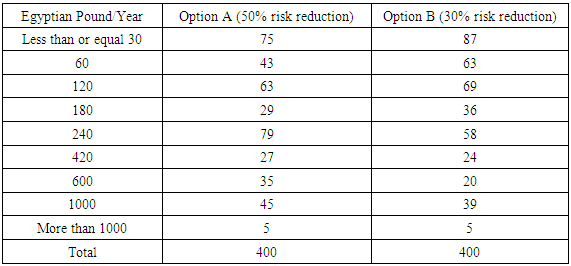
The second part (2B) explores how much the respondent is willing to pay per year for reducing the risk of being killed in an accident. Based on the last five years record by Egypt Traffic Police Authority, 10 people out of every one million car drivers/passengers are killed each year. The question includes two options A and B. Option A involved a 50% reduction in the risk of being killed, while Option B involved a 30% reduction.The reason for presenting two different risk reduction scenarios was to investigate whether this will be resulted in different willingness to pay values. After each amount per year the questionnaire addresses the respondent’s WTP per day for a reduction in accident risk. The idea is to help the respondent to choice their own alternative if the amount is expressed as a per day amount. The amount displayed in this question is derived by dividing the yearly amount given in questionnaire form by 250 (working days per year). Table 4 shows the annual CV values and the corresponding number of respondents for each option.Table 4. Annual CV Value (WTP for accident risk reduction)
 |
| |
|
4.2. Questionnaire Results
Figures 3, 4, 5 and 6 show the distribution of the willing to pay for respondents according to income, location categories, transport modes, and respondents or their family degrees of injury. From these Figures, it can be concluded that: 1. The willing to pay increase with respondent’s income levels. 2. The respondents live in great Cairo region attend to pay more than the others according to the extent of family exposure to traffic accidents in this region.3. The passenger car users have been willing to pay more than the other modes users.4. There is an effect of the respondents or their family degrees of injury on respondents willing to pay to eliminate the risk of death for theme and their families.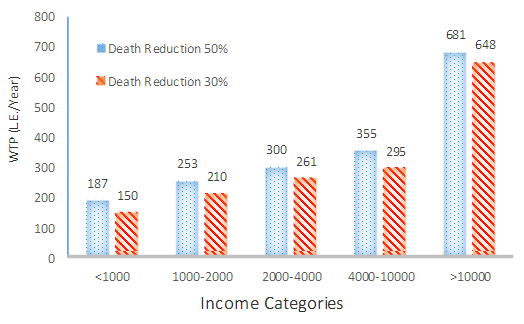 | Figure 3. The willing to pay and Respondent’s Income |
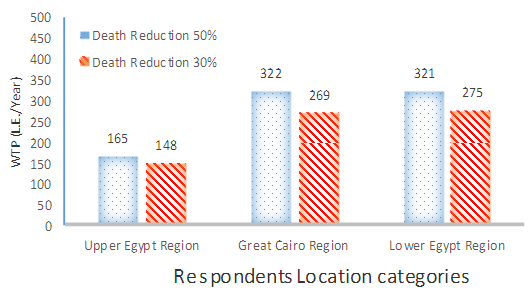 | Figure 4. The willing to pay and Respondents Location Categories |
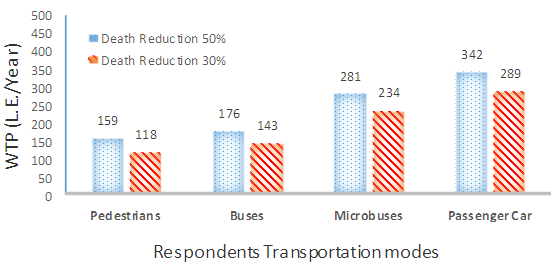 | Figure 5. The willing to pay and Respondents Transport Modes |
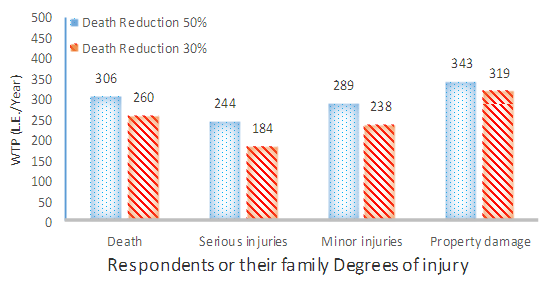 | Figure 6. The willing to pay and Respondents or their Family Degrees of Injury |
4.3. Accident Costs Using CV
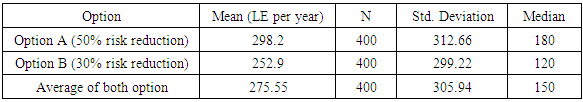
Mean values of annual WTP for accident risk reduction were calculated for Option A and Option B based on the responses in Table 4 after excluding the 10% of respondents who failed in the understanding of risk question. Table 5 shows the resulting values of risk reduction.Table 5. Value of Accident Risk Reduction (LE per year)
 |
| |
|
The mean value of accident risk reduction (VRR) was 298.2 LE per year for Option A (50% risk reduction) and 252.90 for Option B (30% risk reduction). The median value was 180 and 120 respectively. Miller and Guria [17] suggest that the median is the best estimate, if the survey does not weed out high values. But if these have been weeded out, the mean is more reliable.The actual risk of death in a traffic accident in Egypt is approximately 100 per million per year, therefore a 50% reduction in risk (Option A) equates to a reduction of 50 per million. Therefore to obtain the value of statistical life, the CV value (298.2 LE/year) is multiplied by 1,000,000/50, giving a value of 5,964,000 LE. For Option B the 30% reduction in risk equates to a reduction of 30 per million (30% of 100 per million). Multiplying the CV value (252.91 LE/year) by 1,000,000/30 gives a value of statistical life of 8,433,033. Also, it can be seen that while respondents were willing to pay for a reduction in the risk of being killed in an accident, they seemed unable to differentiate between low probabilities of being involved in an accident. This led to a wide range for the value of statistical life by CV 5,957,600 LE – 8,433,033 LE for the two risk reduction percentages considered.
5. Stated Preference Approach
5.1. Questionnaire Design
- Choice ContextGiven the primary objective of the study was to derive WTP valuations of time, operating costs and accidents for different modes, SP experiments could be designed in either a route choice or mode choice context. The route choice was selected because it could offer a realistic choice to respondents. In Egypt, using a mode choice context could run the risk of losing respondents who do not have a realistic alternative mode available.When developing SP experiments there was a trade-off between complexity and the number of SP experiments presented. Because the study was demanding in terms of the different parameter values required, it was better to present two simpler experiments than one overly complex experiment. In order to cover the range of parameters of interest two experiments of nine scenarios were presented to each respondent.- Experiment DesignIn designing the SP experiments it is necessary to determine how many different values, or levels, each of the variables included in the experiment should have. Generally the larger the number of levels the more accurate a variable may be estimated but this has to be weighed against the larger number of scenarios needed. The way in which the different levels of each of the variables are combined must be carefully determined. It is important to ensure that the variables are combined so that there are low correlations between them, otherwise multi-collinearity results and estimation problems may result. The standard procedure for determining how the different variables are combined is to use the ‘orthogonal’ designs presented by Kocur et al. [18]. An orthogonal design is a design where the correlation between the variables is zero.For the SP design to derive value of AC for car there were three variables of interest: travel time, trip cost (TC), and number of accidents. The number of scenarios needed was 27 based on each variable having three levels as shown in Table 6.Table 6. Example of Questionnaire Scenarios
 |
| |
|
In order for the designs to be robust it is important that the designs contain a good range of trade-offs and that the implied boundary values cover a good range. A boundary value is the value at which the utility between two modes is exactly the same and can be calculated for each scenario presented. The boundary values used in the designs was based on the results from the previous study results, and also from the Pilot Survey.The levels were selected as realistic as possible to respondents. The levels of journey time were based on their nominated typical journey, which was collected from the main questionnaire.The journey time of interest was the in-vehicle time, which was the overall door-to-door journey time minus any wait or walk time. The distance bands for car users were:Ÿ short: 15-30 minutes Ÿ medium: 31-45 minutesŸ long: more than 45 minutesThe trip cost were broadly related to the levels people faced at that time. Given imaginary situations were presented it was possible to deviate from existing conditions to a certain degree.The number of accidents per year was estimated using the average accident rates from the past five years for roads network in Egypt.The purpose of this experiment was to derive a value of WTP per trip by individuals for reducing the number of fatalities accident casualties, as well as a value of time travelling in busy conditions in relation to trip cost. Since the accident casualty rates were presented as a number per year, the value of risk reduction for a fatality was determined by multiplying the WTP with the total annual traffic using the selected route in a year. The approach was based on work carried out in this field by Hojman, Ortuzar & Rizzi [14] and Henry Le and et al. [8].An introductory screen for the Car Accident experiment, and a scenario in which a respondent would have to make a choice between two routes is a shown during the following link by Arabic version. https://docs.google.com/forms/d/10BXrWMcorW0b3xJPefXtCSwRI4j-HzKcxTIxLiFhm-c/viewform?usp=send_form
5.2. Analysis and Results
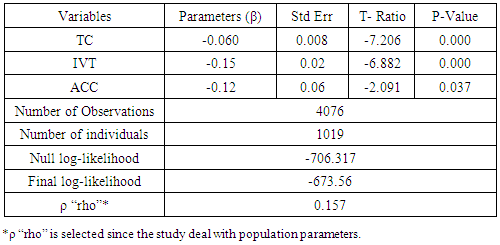
It is assumed in the multinomial logit model that the observations extracted from stated preference experiments are independent variables.Therefore, the multinomial logit model can be written as: | (4) |
Where: U= Utility function β= Parameters to be estimated for the three variables listed hereunder,IVT = In vehicle time (Time in busy conditions) TC = Trip Cost (EGP)ACC = Accidents FatalitiesThe estimated model for car users is shown in Table 7. For this model all the parameters are significant and of the expected sign. The goodness of fit as measured by ρ “rho” squared are 0.157 which is good. The values for avoided fatal casualties were derived by dividing the relevant accident parameter in Table 6 by the trip cost parameters, and shown in Table 7. Table 7. Car User Model
 |
| |
|
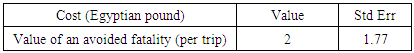
Table 8. Value of Avoiding a Fatal Casualty per Trip
 |
| |
|
Estimates of the Value of Statistical Life (VSL) was obtained by multiplying the WTP values per trip in Table 7 by the average annual traffic volume on the road network as estimated by the 2013 (GARBLT). The average weekday traffic for all links in the networks, weighted by link lengths, obtained from the Traffic Information Center (unit of GARBLT) was 10373 vehicles per weekday. This equates to an average annual traffic volume of 3,172,100 vehicles (using the STM weekday to annual expansion factor of 300). The Value of statistical life (avoided fatality) are estimated by 6,344,200 LE.
6. The Total Cost of the Life Loss in Egypt
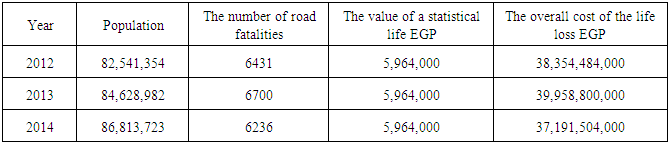
The both methods that have been adopted in this research are considered to provide a practical and reasonable approximation. Therefore, this research will be adopt the value of statistical life estimates derived from CV approach to calculate the cost of the life loss as a result of traffic accidents as shown in Table 9.Table 9. The Cost of the Life Loss as a Result of Traffic Accidents
 |
| |
|
The amounts indicated above represent the minimum limit of losses, as they took into account only the fatalities occurring as a result of only road accidents. These numbers will be higher, if they take into account all types of road accidents (whether accidents with serious injury, minor injury, or only damages) at the level of the country. According to previous studies in Egypt the value of injury loss is estimated by about 10.27% of the value of lost life and the value of the damages only as a result of accidents is estimated by 0.1% of the value of the lost life, Ismail and Abdelmageed [2].As the official statistics indicate that the number of road accidents in Egypt in 2014 has reached about 14403 accidents, and resulted in about 24.154 thousand patients, as well as only damages about 21188 accidents. With these estimates, the overall cost of road accidents in Egypt can be calculated as shown in the following Table 10.Table 10. The Cost of Road Accidents in Egypt According to 2014 Statistics
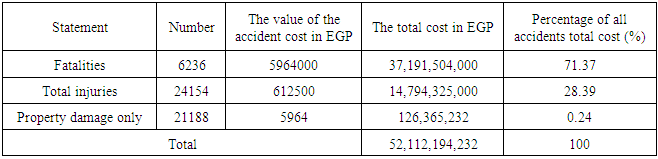 |
| |
|
The ratio of the cost loss to GDP confirms that the estimation results of this research are appropriate with the prices of 2014, as the percentage of these costs to GDP amounted in real values to about 2.27%, comparing 4.3% in KSA and 7.4% in the US estimates and about 3.2% of the Australian estimates.From this research it can carried out the average cost of a road traffic accident is about 3,618,148.59 compere with 8.5 thousand Egyptian Pounds for the year 1984. The corresponding average cost for 2008 is 500 thousand Egyptian Pounds that estimated by Human Capital approach [2].
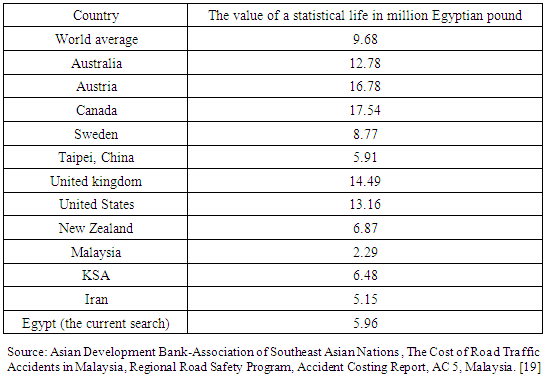
7. Overall Comparison with International Values
Many governments of the developed countries, for example, Australia, New Zealand, Sweden, Switzerland, United Kingdom, and the United States, have begun using the willingness-to-pay approach as a basis to the official economic evaluation of a statistical life. Table 11 shows a list of the mean of the Value of a Statistical Life for a number of developed and developing countries. It shows that the proposed value of about EGP 5.96 million in Egypt as the value of a statistical life is relatively low compared to the estimates of the other developed and developing countries.Table 11. The Estimated Values of a Statistical Life According to the Country
 |
| |
|
8. Conclusions
This study estimates the cost of road traffic accidents in Egypt for the year 2014. The estimation process is carried out using different techniques for the willing to pay and updating previous national cost estimates. The study estimates the cost of road traffic accidents in Egypt for 2014 by around 52 billion Egyptian Pounds with an average cost per accident of 3.6 million Egyptian Pounds.Reader may think that this cost is relatively high compared with Egypt GDP. The estimations of AC in other countries considered in this research shows that Canada and EU countries come on the first rank and followed by Middle East countries. Egypt shows almost the same cost of Middle East Countries. The authors think that due to high rate of accident in Egypt, Egyptian have the real feeling that they have to pay to reduce this high rate. This may explain why the obtained cost seems high if compared with Egypt GDP. This estimated cost is corresponding about 2.27% of GDP. Policy and decision makers are highly recommended to increase the governmental fund to improve traffic safety and economic feasibly is clearly proofed by this Study. The results obtained in this Study and those obtained by similar ones in other countries, suggest that willingness to pay method is an important technique to simulate the users opinion and to produce a reliable utility function modal.
References
| [1] | World Health Organization (WHO), Road traffic injuries, Fact sheet N°358, March, 2013. |
| [2] | Mohamed A. Ismail and Samar M. M. Abdelmageed, “Cost of Road Traffic Accidents in Egypt”. World Academy of Science, Engineering and Technology 42 (2010), pp.1308-1314. |
| [3] | Information and decision making support center (IDSC), “Road accidents in Egypt”. (2008), Final Report, Egypt. |
| [4] | Central Agency for Public Mobilization and Statistics (CAPMAS) Report. (2013) available online: http://www.capmas.gov.eg, last visit 28.06.2015. |
| [5] | Misr National Transport Study, The Comprehensive Study on The Master Plan For National wide Transport System In The Arab Republic Of Egypt, (2012), Final Report, Egypt. |
| [6] | Rune Elvik and etl, “The Economic and Social Cost of Road Accidents the Portuguese Case”. (2012) EDIUAL, pp: 157-162 p. |
| [7] | Elvik, R., “An analysis of official economic valuations of traffic accident fatalities in 20 motorized countries”. Accident Analysis and Prevention No.27, (1995), pp: 237–247. |
| [8] | Henry Le and et al, (2011), “Deriving Accident Costs using Willingness-to-Pay Approaches - A Case Study for Singapore” Australasian Transport Research Forum, available online http://www.patrec.org/atrf.aspx 2011. |
| [9] | Viscusi, W K and Aldy, J E (2002) “The value of a statistical life: a critical review of market estimates throughout the world”, Discussion Paper No. 392, Harvard Law School, Cambridge MA, November 2002. |
| [10] | Hasan A. Mohamed (2015) “Estimation of Socio-Economic Cost of Road Accidents in Saudi Arabia: Willingness-To-Pay Approach (WTP)”, Advances in Management & Applied Economics, vol. 5, No.3, pp: 43-61. |
| [11] | Ainy and et al. (2014) “Estimating Cost of Road Traffic Injuries in Iran Using Willingness to Pay (WTP) Method”. PLoS ONE 9(12): e112721. Doi:10.1371/journal. pone.0112721. |
| [12] | Mofadal AI and et al. (2015) “Analysis of pedestrian accident costs in Sudan using the willingness-to pay method”. Elsevier Ltd. |
| [13] | Rizzi, L I et al. (2003) “Stated preference in the valuation of interurban road safety”. Accident Analysis and Prevention 35. Pergamon Press, Oxford. |
| [14] | Hojman P, Ortuzar J d D, & Rizzi L I (2005) “On the joint valuation of averting fatal and severe injuries in highway accidents”. Journal of Safety Research No.36 (2005) pp:377-386. |
| [15] | de Blaeij A T, Rietveld P, Verhoef E T, Nijkamp P (2002) “The valuation of statistical life in road safety”: A stated choice approach, Vrije Universiteit, Amsterdam, Association for European Transport 2002. |
| [16] | Jones-Lee M.W., Hammerton H.et Philips P.R (1985), “The Value of Safety”: Results of National Sample Survey, Economic Journal, Vol.95, pp:49-72. |
| [17] | Miller, T.R., Guria, J., (1991). “The value of statistical life in New Zealand”. Market Research on Road Safety. Wellington, NZ, Ministry of Transport, Land Transport Division. |
| [18] | Kocur, Adler, Hauan and Aunet (1982) “Guide to Forecasting Travel Demand with Direct Utility Assessment”, US Dept of Transportation. |
| [19] | Asian Development Bank-Association of Southeast Asian Nations, “The Cost of Road Traffic Accidents in Malaysia”, Regional Road Safety Program, Accident Costing Report, AC 5, Malaysia. 2010. |

 Abstract
 Reference
 Full-Text PDF
 Full-text HTML