Electricwala Fatima1, Bagul Tushar Rajendra2, Divyang Soni3, Rakesh Kumar4
1Engineer, MAP TECHNOLAB Pvt. Ltd. Gandhinagar, Gujarat, India
2Research Scholar, Civil Engineering Department, S.V. National Institute of Technology, Surat, India
3Final year B. Tech Student, Civil Engineering Department, S.V. National Institute of Technology, Surat, India
4Associate Professor, Civil Engineering Department, S.V. National Institute of Technology, Surat, India
Correspondence to: Rakesh Kumar, Associate Professor, Civil Engineering Department, S.V. National Institute of Technology, Surat, India.
| Email: |  |
Copyright © 2015 Scientific & Academic Publishing. All Rights Reserved.
Abstract
Travel time reliability represents the temporal uncertainty experienced by travellers in their movement between any two nodes in a city network. The uncertainty of trip travel time influences mode choice (departure time, route, mode, and others). Due to lack of public transit system, the percentage of motorized three-wheelers act as an intermediate public transit system in small and medium Indian urban cities has been increased considerably. The current operation of intermediate transit system also fuels the unprecedented growth of cars and two-wheelers. This study examined the travel time reliability of Three - wheelers on six selected corridors in the city of Bardoli, Gujarat state, India. Traffic quality parameters, such as average daily speed, average delay, average daily congestion, average travel time, and travel cost using three wheelers were simulated in VISSIM environment based on field survey data. Driving characteristics of three wheelers were recorded using onboard the V-Box instrument. A test tree wheeler equipped with a V-Box was employed for assembled real world data on a study corridors. Speed acceleration frequency matrix and the normalized matrix was developed in MATLAB environment, and micro-trips from zero to zero speed were analyzed using the k-clustering technique. Stated and revealed preference survey were employed to assess the time reliability of shared three wheelers. Results from both the surveys showed that at present, buffer index of shared three-wheeler was varied in between 38 to 40% during morning and evening peak hours respectively. It was observed that fixed stoppage movement of three wheelers is having 17% less acceleration and decelerations time than without fixed stoppage. The without fixed stoppage Three - wheelers spent 80% of the time in acceleration and decelerations. With improved travel time reliability (62%), results showed significant improvement in a the mode shift towards the three wheelers from 2-wheelers and non-motorized commuters. The 100% mode shift was observed from present to reliable three-wheeler with fixed stoppage and route. This travel time reliable three-wheeler mode is also attracting car passenger by 23%. These conclusions can be used to form the foundation for the enhancement of the intermediate transit system in similar cities, in absence of public transport system.
Keywords:
Travel time index, Shared three wheelers, Fixed stoppage intermediate transit system
Cite this paper: Electricwala Fatima, Bagul Tushar Rajendra, Divyang Soni, Rakesh Kumar, Travel Time Reliability Analysis of Three Wheelers: An Indian City Case Study, International Journal of Traffic and Transportation Engineering, Vol. 4 No. 4, 2015, pp. 107-114. doi: 10.5923/j.ijtte.20150404.02.
1. Introduction
Motorized three wheel rickshaws are a part of the urban society and one of the chief modes of transport in Indian cities. Due small size, and lightweight body structure is well suited to manoeuvre through the hectic urban heterogeneous traffic [1]. One of the major thrusts of the public transit system is to reduce commuter’s dependency on car and two-wheelers to make the urban transportation system sustainable [2]. India’s cities have witnessed the traffic growth rate and correspondingly commuting demand in the post economic reform. The better living standards, which has increased demand for a better and more user-friendly urban transport system. It is important to have a public transit system that is accessible, reliable, convenient and affordable in Indian cities [3]. Existing lack of urban transportation infrastructures fuelled the high growth of private vehicles such as cars, two-wheelers and Para-transit modes (auto-rickshaw). The motorized auto -rickshaws are a form of intermediate public transport (IPT). The IPT provides two types of services for urban commuters (a) on demand service (b) shared auto-rickshaw (SAR) or informal public transport. A shortcoming of public transit services (PT) gap is filled by Intermediate Public Transport (IPT), or Para-Transit System in Indian cities [4]. There was an increment in million plus populated cities from 35 in 2001 to 55 [5]. The growth of urbanization is putting enormous pressure on transportation infrastructures to act in response to increased urban capacity. The effect of the radial growth of Indian cities is making dependent on cars and two-wheelers and may aggravate congestion and accident rate [6]. The motorized three wheelers play a vital role in India’s urban transport systems and have the capacity to provide service door to door. Under heterogeneous traffic stream, mix slow and fast moving vehicles are high and vehicles do not follow the lane discipline [7]. The three-wheeler is one of the fatest modes during peak hours in urban cities. Three- wheelers also represents an increasingly inefficient mode to travel in the changing dynamics of cities mobility in India [8]. Travel time variability is closely linked to the unpredictable variations in travel time of three wheelers. Travellers choose incorrectly under an uncertain environment as they are unable to estimate their travel time duration before starting their trips (i.e. Choosing a departure time) [9]. In the case of predictable variations, the travellers may adjust their departure time choice accordingly, and still be convinced of arriving on-time at their destinations [10]. It is true even if the transportation system operates in high congestion. Different studies show that a well-planned bus transit system encourages the modal shift from private to public vehicles [3]. The modal shift influenced by age, gender, time to walk to the station, and travel time reliability between private and public transits [11]. The trip time difference and travelling cost would also influence the modal shift [12]. Since travel time is a function of urban transport development, the specific public transit system can reduce travel time and thus encourage private vehicle users to use public transport system [13]. Attitudes and perceptions of people regarding travelling mode reliability are played a role in mode choice decisions [14]. Therefore, as the city is growing from small to medium, and so on, public transit or intermediate public transit reliability is vital to check the growing numbers of private vehicles including two-wheelers. The Indian city has to cope with an increasing urban travel demand by improving the existing intermediate public transport system and cannot be compensated by just increasing infrastructure space.In this paper, an attempt has been made to analyze the impact of the modal shift by scaling up the reliability of the existing three wheelers, an intermediate public transit system in the present urban traffic context. It will discuss travel time reliability service measures with the goal of proving the importance and relevance of intermediate public transport for transport planning in Indian cities.
2. Methodology
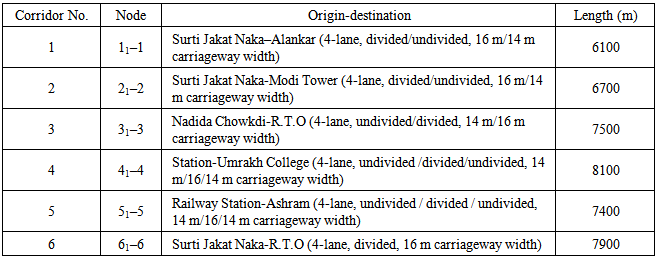
In this study area, Bardoli may be categorized as a medium sized urban city with a population of 6,75,963 covering a commuter travel area of 46.0 km2. Majority trips belong to educational, workers and business and working trip in the state of Gujarat, India [15]. The city has an intermediate transport system, and commuters use Paratransit and personal vehicles to commute to their desired destination with an average trip length of 6.0 to 12.0 km. The Shared Auto-Rickshaw (SAR) study route was defined based on physical characteristics of existing road stretch like carriageway width and future expansion scope as shown in Figure1. The node 61–6 of corridor no 6 is the central business district (CBD) and 4-lanes divided with a 16 m wide carriageway. Apart from CBD corridor, the other five study roads are having 4-lanes and undivided 14.00 m roadway width as mentioned in Table 1. All other five study corridor share few hundreds of meters distance with the 61–6 corridor. On the study corridors, speed and delay survey has been carried out along the side friction due to the parked vehicles potential route of the SAR transit on this corridor is quite high. Table 1. Study corridor for Physical characteristics of networks (Electricwala et.al. 2014)
 |
| |
|
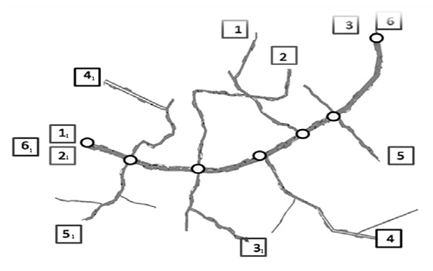 | Figure 1. VISSIM Snapshot and Six Corridors (Electricwala et.al. 2014) |
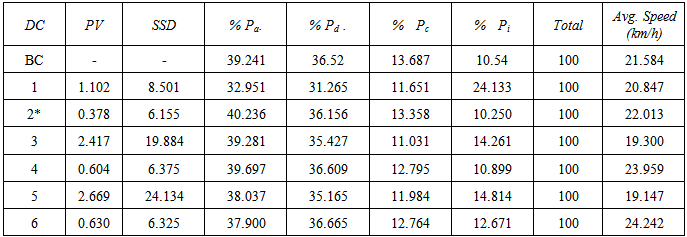
As per stated preference (SP) survey, it was observed that the 61% auto-rickshaws use CNG and 34% petrol for passengers trips for daily operations. The average number of trips made during week and weekend by a three wheeler per day is 21.50 trips with the average occupancy per trip is 2.6 passengers. It was observed that about 98% commuters use auto-rickshaw as a shared mode, which clearly indicates the role of three wheelers as an Intermediate Public Transport (IPT). About 80% of three wheelers commuters are workers, students, service, business person and floating population. The analysis shows that over 78% trips are for work Purpose, and the average trip length of auto-rickshaw passengers is about 3.5 km [16]. The socioeconomic profile of SAR ridership has also been obtained on six corridors from onboard Interview Survey (OIS) covering all types of Income Groups, Gender and Vehicle ownership in Bardoli, Gujarat, India. A total of 1250 three wheelers travelers interviewed, and each was presented 11 choice sets. Where travellers had to put forward his or her decision on the different available modes along with various alternative options for the improvement of travel reliability of three wheelers system. Modeling of stated preference (SP) data was analyzed based on the spatial and the socio-income differences of the individual travellers using Biogeme analysis [3].Similarly, RP survey was also conducted on over 1500 daily three wheelers commuters. At present, no designated stops for alighting and boarding exists on the corridor. Also, three wheelers frequency varies from 18 per hour during morning hours to 28 per hour during peak hours and is not fixed as it starts as and when it is filled up to its capacity. The period of arrival of three wheelers is between 3 to 6 minutes and sometimes arrive in bunches. The delay or variability in travel time propagated during travel in the corridor itself and became the cause of bunching of three wheelers. In the case of bunching, the average travel time per passenger was extended. The more three wheelers users suffer from the uncertain delay than benefiting from the non-stopping of the successive vehicle. It is due to the uncertain stopping of three wheelers, which allow more alighting and boarding passengers.Further, to estimate the driving cycles characteristics of three wheelers, performance box is a self-contained GPS data logger, and Performance Meter was used. Data collected using onboard measurement technique by using V-box to record speed time profile as three-wheeler travel along predetermined routes by conducting surveys with fixed and without stoppage including weekend scenario. A 10Hz fully calibrated GPS engine was used to provide accuracy and precision. The data stored on a removable SD flash card. Micro-trips generated by best incremental from zero to zero speed [17]. Field data of three wheelers travel characteristics database analysed for finding the best progressive that stored all the information regarding that micro-trip of three wheelers on the given study road stretch. The Normalized speed–acceleration matrix (Nm) was estimated based on speed acceleration frequency matrix (Fm) [16]. The speed acceleration frequency matrix is the frequency of occurrence of acceleration, deceleration, cruise and the idle corresponding to a speed value. From the normalized matrix (Nm) travel characteristics were computed such as the % in acceleration (Pa), % deceleration (Pd), % time in cruise (Pc), % time in idling (Pi) and the average velocity with respect to the following base data (speed > 5km/hr and acceleration <|0.5km/h/s|), % acceleration (acceleration>0.5 km/h /s), % deceleration (acceleration<-0.5 km/h /s), % idle time (acceleration<|0.5 km/h/s| and speed<5 km/h), Average Speed [18]. The speed – time profile and the speed – distance profile created by the Performance Box during the survey as shown in Fig.2. In the present study, inter-period data from morning peak hour and evening peak hour of the weekday are compared. Study stretch considers in Table 1 road segment has similar road geometry along the whole length. Sample runs conducted during morning peak hours (5.30 am to 10.30 am) and evening peak hours (6.30 to 10.00 pm) by driving three wheelers fitted with performance box within the traffic stream. Three junctions and two links are present along the selected main corridor. As shown in Fig. 2, the average speeds are found to be 20.2 kmph for the morning trip and 17.8 kmph for the evening journey. These low average speeds are due to numerous stoppages for the three-wheelers. In both the figures, the sudden change to zero speed denotes stoppages. The longer stoppages are at the junction or traffic hindrances whereas shorter stoppages are for picking up passengers. As shown in Figure 2, the number of stoppages is far lesser than that in morning and evening peak hours of three wheelers. Due to reduced traffic congestion in morning hours, the stoppages are mostly for passenger pickup at fixed places in the corridor. The average speed calculated and quite higher for three wheelers, i.e., 42.8 kmph. As per Fig. 2, the average speed reduces to 39.6 kmph because of a greater number of stoppages for the above part and highly oscillatory nature of the speed owing to side friction. The highly oscillatory nature of the graph between 0 sec and 500 sec is due to the side friction and traffic congestion in the narrower part of the corridor. The three wheelers transit differs greatly in terms of their driving characteristics with and without fixed stoppage as shown in Table 2. It is owing to the fixed and pre-assigned stoppages for three wheelers [19]. On the basis of minimum performance value (PV) and SSD, three wheelers driving cycle in fixed and without fixed stoppage in was estimated as shown in Table 2 [20]. The without fixed stoppage results show that driving cycle has less performance value i.e. 6.155 and sum squared difference value i.e. 0.378 as compared to other five driving cycle parameters as shown in Table 2.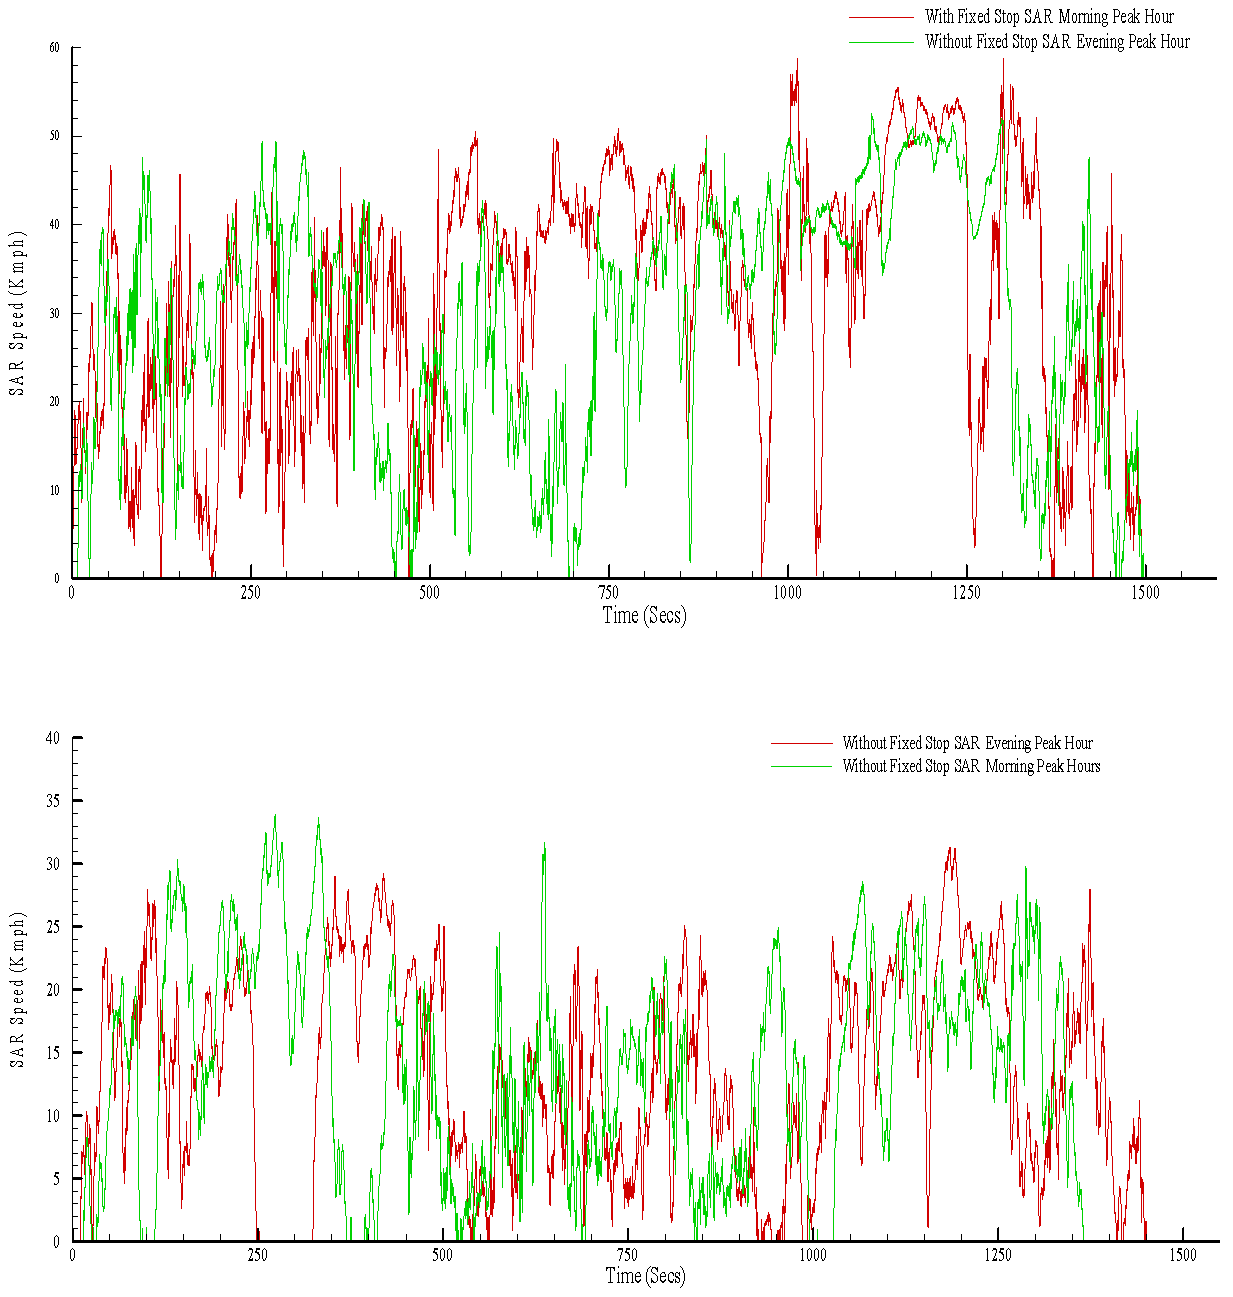 | Figure 2. With and without fixed stoppage of three wheelers during morning and evening peak hours |
Table 2. Three wheeler driving pattern without fixed stoppage
 |
| |
|
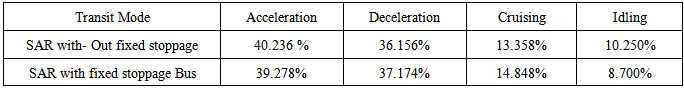
Similarly, for fixed stoppage, the three wheeler driving cycle characteristics were also estimated for the study area as shown in Table 3. The selected driving cycle for fixed and without fixed stoppage (2*) is provided in the table. 4. The final driving cycle in with and without stoppage on the study stretch driving cycle developed for 270 seconds. It is less than peak and with high acceleration and deceleration and less timing in cruising (14.848%), and at idle (8.700 %) respectively. It was noticed that due to higher traffic congestion and speed variation, the average speed of fixed stoppage SAR drops to 40.8 kmph. It is still greater than that of an without fixed auto-rickshaw during the same evening hours. The VISSIM model making process was same as [3, 21]. It consists of (a) identification of geometry data of representative corridors (b) traffic composition data (c) analysis of representative corridor data (d) VISSIM (version 6.0) coding and (e) calibration using representative corridor. To have the representative behaviour of the heterogeneous traffic environment, i.e. corridor 61-6 was selected to calibrate and validate as arterial road and corridor 21–2 as a sub-arterial road. To illustrate in practice for estimating travel time, the proposed model, a set of simulation experiments has been conducted with the VISSIM model of Bardoli. The VISSIM model comparison between the observed and the measured three wheeler flow values for one of the studied road, a similar analysis, has been conducted for all other five road stretch. The comparison is based on the analysis of the U-Theil's statistics. The corresponding values were obtained as U = 0.034475 UM = 0.390502 Us = 0.39755 R2 = 0.965538 RMS = 0.059425. The U, R2 and RMS values show a best-fit agreement between the experimental data and the VISSIM model, although the bias and the variance proportions were at the limited of the acceptability of the model.Table 3. Three Wheeler driving pattern with fixed stoppage
 |
| |
|
Table 4. Driving Characteristics of bus and shared 3-Wheeler
 |
| |
|
3. Three Wheelers Travel Time Analysis
The purpose of this case study was to evaluate travel time reliability, and in doing so provide a model for how three-wheelers could use travel time reliability to prioritize Intermediate public transport operation for improvements in the city of Bardoli. For calculating a similarly daily travel time of three-wheelers, users were estimated as given in Eq.1.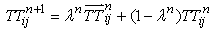 | (1) |
Where,  is without fixed stoppage, travel time by three wheeler,
  is with fixed stoppage travel time by three wheelers, 'i' is on any stretch of the road during 'j' peak and non-peak hour on day 'n'.
  is a weight parameter
  The weight factor varies from 1to 5 based on the side friction on the selected road during the test drive. The one end to the other end, travel time was measured and compared against average simulated travel time using VISSIM Model. As travel time, data was available during peak and non-peak hours of three wheelers. Hence, mean observed travel times data could not be accurately estimated. Therefore, average simulated travel times and individual three wheeler observations were used to determine travel time. The Fig. 3-4 also shows travel times values corresponding to the mean ±2 standard deviations of the estimated travel time. It was assumed that VISSIM model travel times follow a normal distribution; these values define an interval containing 95% of simulated travel times. Except free flow conditions, peak and non-peak hour travel time (88%) observations are within these ranges. Finally, the buffer index was chosen as the primary measure of travel time reliability of three-wheeler used for this study. It is estimating by subtracting the 95th percentile travel time (0.05 confidence level) from the average travel time on each corridor. The average travel time represents the percentage of extra travel time that most commuters would need to add on to their trip to reach node as mention in Fig. 3 & 4. The Figures mentioned above indicates a qualitative travel time value. There is variation among all corridor as to the peak and non-peak hours travel time and buffer index. During peak hours, all corridor has the buffer index varies from 40% to 50%.
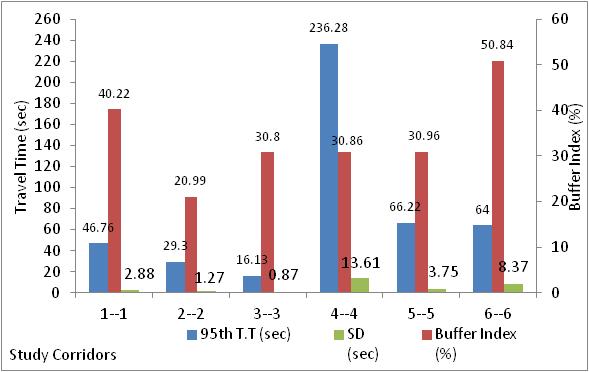 | Figure 3. Non-Peak hour Travel time in study road stretch |
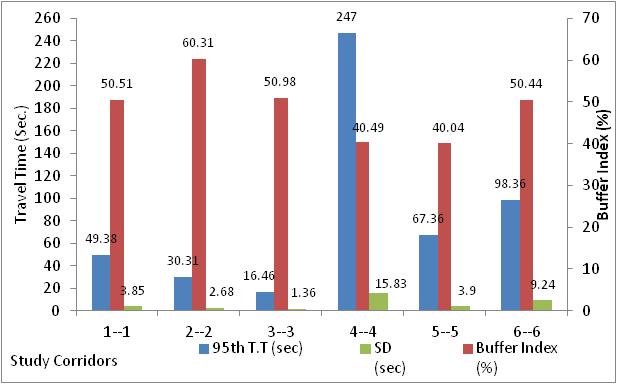 | Figure 4. Peak hour Travel time in study road stretch |
4. Results and Discussion
For the passenger, the difference between planned and delay departing SAR is of great importance. Scheduled SAR might lead to waiting the full headway time and delay SAR only extend the waiting time by the amount of delay. Variability of the supply side thus affects the waiting time of commuters in an asymmetrical way, and fuels mode shifts toward personal vehicles. To account for travel reliability variation in without fixed stoppage and with fixed in SAR transit system, travel time for each segment during all the trips in morning and evening peak periods is found out using 95% confidence limits. Using 95th percentile travel time, travel time indices such as travel time index, buffer time index, planning time index and percentage of variation were estimated. Travel time and trip length have a negative influence that suggest that the usefulness of an SAR without fixed stoppage decreases as the values of these terms increase. As per the income groups, higher income groups are less likely to use SAR as suggested by the negative coefficients. The stated preference survey results show a remarkable shift of 78.58% to 89.40% from without fixed stoppage SAR to with fixed stoppage of SAR transit system respectively. The differences between the travel time reliability indices such as buffer index, travel time index, and planning time index as shown in Fig. 5(a), (b), (c),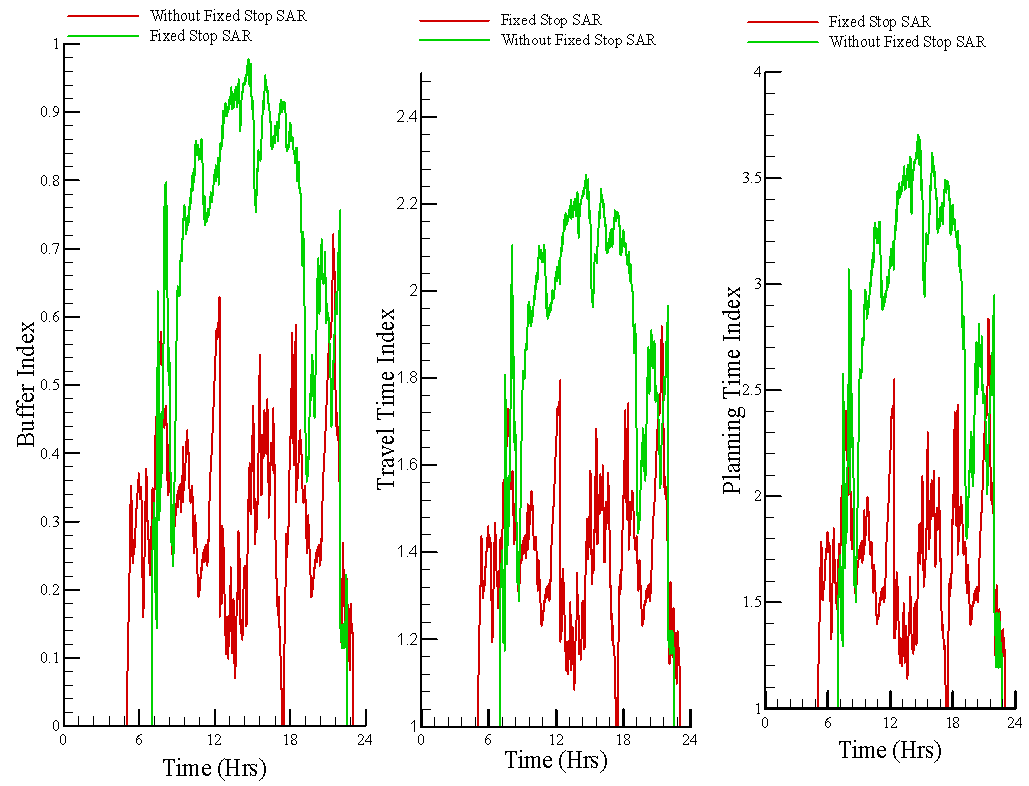 | Figure 5. (a) B.I of SAR (b) TTI of SAR (c) PTI of SAR |
The null values of in the figures before 5 am for fixed stoppage SAR service and 7 am for SAR transit denote unavailability of the particular service during that time. As mentioned in Fig. 5(a-c) that each index is showing approximately the same trends. However, in particular, the planning time index, seems to overstate the pattern more than the travel time index or the buffer index. The buffer time index is probably the most conservative measure to use because of its tendency to dilute the trends along a roadway.It is evident from Fig. 5 (a-c) that the values of the three indices are highly greater for the majority of the time for without fixed stoppage SAR as compared to the fixed stoppage SAR transit system. The average values of buffer index, travel time index and planning time index for the fixed stoppage SAR transit system are 0.22, 1.32 and 1.54 respectively as compared to without fixed stoppage SAR are 0.65, 1.67 and 2.84 respectively. The higher travel time reliability of fixed stoppage SAR is attributed to the alighting and boarding at fixed stoppages on the corridor that are independent of the passenger count or their respective destinations. Without fixed stoppage auto-rickshaw has some stoppages at uncertain locations that depend on its occupancy and destinations of the individual traveler. The figure above indicates that each index studied would show approximately the same trends along a study stretch., Although the planning travel time index, in particular, seems to exaggerate the trends more than the buffer travel time index or the travel time index. The buffer travel time index is probably the most conservative measure to use because of its tendency to dilute the trends along a study stretch. According to revealed preference (RP) studies, buffer index values were calculated to be 38% and 40% for fixed stoppage SAR and without fixed stoppage SAR respectively under the existing scenario. The reliability of fixed stoppage SAR is higher than without stoppage SAR in the present condition owing to lesser waiting time and higher frequency. The designated stoppages for the SAR were proposed to be eight fixed places in the corridor, and its frequency was suggested to increase to 8 to 16 per hour. These changes modelled in VISSIM, and its result data was given to daily commuters.As expected, the reliability of the fixed stoppage SAR system was found to increase which is evident from the reduction in buffer index from 38% to 22% as shown in Fig 4(a). Stated Preference studies show a modal shift of 13.45% to 26.09% from cars to fixed stoppage SAR for an educational trip. Two-wheelers have a modal shift of 12.60% to 18.90% that is lesser than that in cars and without fixed stoppage SAR. However, it was found that modal shift values improve substantially with an increase in travel time reliability of fixed stoppage SAR transport system. Values of travel time indices change accordingly with better incident response systems, road improvements avoiding bottleneck points, and better traveller information. When these factors, group together, will enhance the speed of SAR, the travel within city attracts maximum modal shift from two-wheelers by almost double to 24.48%. It was due to commuters may arrive at random, or they may plan their arrival, according to the fixed stoppage of SAR. If a traveler is planning their arrival at the departure stoppage, schedule adherence by SAR is important.
5. Conclusions
The aim of this paper is to understand the overall impact of an efficient SAT transit system with higher travel time reliability with fixed stoppage. With designated number of stoppages (eight on the main corridor), SAR, intermediate transit proves to be more user-friendly and time-saving as compared to SAR travel with an uncertain number of stoppages. The drving cycle of three wheeler developed to estimate the travel time on six corridors. Results shows that after improvement of relaibility factor, modal shift of 13.45% to 26.09% from cars to fixed stoppage SAR for educational trip and the travel within city attracts maximum modal shift from two-wheelers by almost double to 24.48%..With high maximum modal shift ranges, intermediate public transportation will result in substantial reduction in the number of private vehicles and thereby ease traffic woes such as numbers of accidents and congestion.
ACKNOWLEDGEMENTS
Author, Ms. Fatima Electricwala, would like to sincerely thank her diploma project members, Mr. Amit Gajera, Mr. Kishan Kanani and Ms. Vidhi Joshi for their support during traffic data collection in city of Bardoli for successful completion of project and research work.
References
| [1] | Srdjan M. Lukic, Priscilla Mulhall, Gilsu Choi, Mustafa Naviwala, Sairam Nimmagadda, Ali Emadi "Usage Pattern Development for Three-Wheel Auto Rickshaw Taxis in India" Conference: Vehicle Power and Propulsion IEEE Conference - VPPC, 2007. |
| [2] | Mani, A., Pai, M., Aggarwal, R. "Sustainable Urban Transport in India, Role of the Auto- rickshaw Sector". EMBARQ, New Delhi, 2012. |
| [3] | Electricwala Fatima, Rakesh Kumar, "Introduction of public bus transit in Indian cities", International Journal of Sustainable Built Environment, 3, 27–34, 2014. |
| [4] | Mohan, D., and D. Roy “Operating on Three Wheels: Auto-Rickshaw Drivers of Delhi.” Economic and Political Weekly, January 2003. |
| [5] | Government of India, Press Information Bureau, “India Stats: Million Plus Cities in India as per Census 2011,” October 31, 2011. |
| [6] | Fatima Electricwala, Rakesh Kumar, "Identification of Black Zones on National Highways: A Case Study of an Indian City" International Journal of Traffic and Transportation Engineering, 2(6): 135-141, 2013. |
| [7] | Arasan V. T. and S. H. Kashani, "Modeling platoon dispersal pattern of heterogeneous road traffic". Transportation Research Board 82nd Annual Meeting, Washington, D. C., USA, 2003. |
| [8] | Tiwari, Geetam. "Key Mobility Challenges in Indian Cities". International Transport Forum, on 25-27 May in Leipzig, Germany, on Transport for Society, 2011. |
| [9] | Carlos Carrion, David Levinson, "Value of travel time reliability: A review of the current evidence". Transportation Research Part A 46, 720–741, 2012. |
| [10] | Prem Chand Devarasetty, Mark Burris, W. Douglass Shaw, "The value of travel time and reliability evidence from a stated preference survey and actual usage". Transportation Research Part A 46, 1227–1240, 2012. |
| [11] | Callum Sleep, Sekhar Somenahalli, Jonas Magiera, Masoud Lotfi, Jack Bruce, "Analysing Bus Transit On-Time Performance at the Stop Level Using AVL Data", Proceedings of the Eastern Asia Society for Transportation Studies, Vol.9. 2013. |
| [12] | Ronghui Liu and Shalini Sinha, "Modelling Urban Bus Service and Passenger reliability, Institute for Transport Studies", University of Leeds, Leeds LS2 9JT, UK. 2007. |
| [13] | Lyman, K., Bertini, R.L. "Using Travel Time Reliability Measures to Improve Regional Transportation Planning and Operations" 87th Annual Meeting of the Transportation Research Board January 13–17, 2008. |
| [14] | Gabriela Beirão, J.A. Sarsfield Cabral, "Understanding attitudes towards public transport and private car: A qualitative study" Transport Policy, Volume 14, Issue 6, November 2007, Pages 478–489, 2007. |
| [15] | Census of India, "District Census Handbook, Series -25 Gujarat, Surat district, Part I & II", 2011. |
| [16] | Fatima Electricwala, "Implementation of Bardoli City Bus", Diploma Dissertation, Dr. S&SS Ghandhy College of Engineering and Technology, Surat, 2011. |
| [17] | Kamble, Sanghpriya H, Tom V Mathew and G.k. Sharma. "Development of real-world driving cycle: Case study of Pune, India," Transportation Research Part D 14: 132-140, 2009. |
| [18] | K.K Gandhi, V.A.Zvonow, Harbans Singh, “Development of a driving cycle for fuel economy in a developing country” Transportation Research Part A: General Volume 17, Issue 1, Pages 1-11, 1983. |
| [19] | Nesamani, K.S., Subramanian, K.P., Development of a driving cycle for intra-city buses in Chennai, India. Atmospheric Environment 45 (2011) 5469-5476, 2011. |
| [20] | Wafaa Saleh, Ravindra Kumar, Howard Kirby, Prashant Kumar. "Real world Driving Cycle for Motorcycles in Edinburgh" Transportation Research Part D 14: 326-333, 2009. |
| [21] | VISSIM Package 6.0 Version. 2013. PTV Planung Transport Verkehr AG, Germany., 2014. |
 Abstract
 Reference
 Full-Text PDF
 Full-text HTML