-
Paper Information
- Paper Submission
-
Journal Information
- About This Journal
- Editorial Board
- Current Issue
- Archive
- Author Guidelines
- Contact Us
International Journal of Traffic and Transportation Engineering
p-ISSN: 2325-0062 e-ISSN: 2325-0070
2015; 4(4): 103-106
doi:10.5923/j.ijtte.20150404.01
Examining the Effect of Inaccurate Traffic Impact Analysis on Roadway Infrastructure
 Abstract
 Reference
 Full-Text PDF
 Full-text HTML
Mehrnaz Doustmohammadi1, Michael Anderson2, Ehsan Doustmohammadi3
1Industrial and Systems Engineering, University of Alabama in Huntsville, Huntsville, USA
2Civil and Environmental Engineering, University of Alabama in Huntsville, Huntsville, USA
3Civil, Construction and Environmental Engineering, University of Alabama at Birmingham, Birmingham, USA
Correspondence to: Michael Anderson, Civil and Environmental Engineering, University of Alabama in Huntsville, Huntsville, USA.
| Email: |  |
Copyright © 2015 Scientific & Academic Publishing. All Rights Reserved.
Traffic impact analyses are performed to assess the existing roadway infrastructure and its ability to move traffic near a proposed development. These analyses are produced following a traditional methodology where trips are generated, distributed, assigned and the final volumes are assessed to determine delay and level of service. This paper examines a development for which a traffic impact analysis was performed, and manual counts after the development opened are higher than the originally predicted volumes to determine the impact to drivers with respect to delay and level of service experienced to determine if there are substantial effects or design considerations that might have been different had the increase in traffic volume been known. The paper examines different access points and intersection locations near a development and concludes that right in-right out access points are not subject to inaccurate predictions while tradition single stop controlled access points can experience large increases in delay.
Keywords: Traffic Impact Study, Level of Service, Delay
Cite this paper: Mehrnaz Doustmohammadi, Michael Anderson, Ehsan Doustmohammadi, Examining the Effect of Inaccurate Traffic Impact Analysis on Roadway Infrastructure, International Journal of Traffic and Transportation Engineering, Vol. 4 No. 4, 2015, pp. 103-106. doi: 10.5923/j.ijtte.20150404.01.
Article Outline
1. Introduction
- Traffic congestion can lead to lost productivity, environmental concerns and safety issues due to travel time delays, increases in air pollution and accidents. When traffic becomes congested, drivers must decide whether to wait in the congestion or use other routes to bypass the congestion that may or may not be designed to handle that level of traffic. In an attempt to prevent congestion from happening in a proactive manner, traffic impact analyses are performed to predict demand on the transportation network [1, 2]. The ability to accurately predict traffic impacts has become more important recently as the funding to improve roadway facilities continues to decrease [3]. Recently, several papers have addressed the accuracy of traffic impact analysis for large retail development [4, 5, 6], however, these paper do not necessarily address the implications of being wrong in the predictions.The purpose of this study is to determine the impact of under predicting traffic volumes when conducting a traffic impact analysis and the implications to the access points of the facility and the of the prevailing roadway network. To perform the study, the results of a traffic impact analysis are compared with actual traffic volumes to determine projected and actual levels of service, using a range of possible traffic configurations. The actual values were obtained through a counting program of a facility several months after opening. The analysis was performed using Synchro software to determine the impact of potential differences in traffic volume at nearby intersections and facility access points. The results show that there is a wide variety of issues associated with being wrong in the traffic forecast and the design of the intersection can have a large influence on the result.
2. Data and Study Design
- In this study, traffic data were collected and were compared to the initial traffic data from the original traffic impact analysis performed for the development. The traffic entering and exiting the facility was collected in 15 minute interval for five typical weekdays in February and March. To assess the impact of the difference in traffic volume, the original study numbers were compared to five different traffic volume scenarios, in an attempt to gain a holistic analysis, or extreme traffic volume analysis. The five traffic scenarios were defined as:Low combination: This scenario was based on totaling the lowest number of cars for each 15 minute interval, regardless of day, to create a peak hour traffic that was the lowest possible combination.Lowest day: This scenario was based on the lowest amount of cars on a single day of the five days in the study.Average day: This scenario used an average traffic for the five days of data collection.Worst day: This scenario was based on the highest amount of cars on a single day of the five days in the study.Worst Combination: This scenario was based on totaling the highest number of cars for each 15 minute internal, regardless of day, to create a peak hour traffic that was the highway possible combination.It is important to note that all five scenarios developed in this work exceeded the original traffic prediction, indicating that the original traffic impact analysis under predicted the traffic volumes associated with the development.In addition to the five scenarios, there were five intersection/access point considered in the analysis. The locations are based on the original study and contained the originally predicted level of service. The scenarios were simulated in SYNCHRO software. Each scenario was tested at each location. The locations are shown in Figure 1 and defined as:Westside access to the facility which is a right in-right out access point (location 9),Southeast access to the facility which is a single stop controlled intersection (location 2), Northeast access to the facility which is a single stop controlled intersection (location 16), Northeast intersection, which is a signalized four leg intersection near the development (location 7), andNorthwest intersection which is a signalized four leg intersection near the development (location 4).There are no south intersections included in the study as there is no access to the south from the development, the west side roadway has a barrier to prevent left turning traffic from the development and the east side roadway has no development to the south.
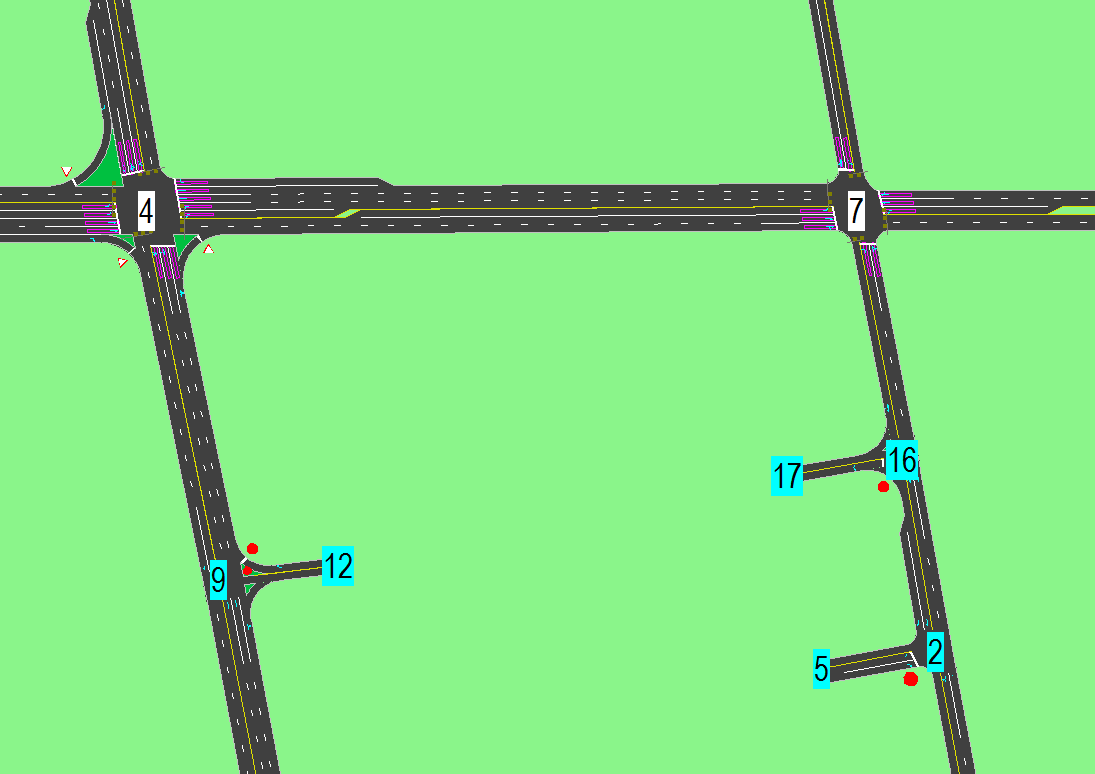 | Figure 1. Location of the intersection/access points |
3. Analysis and Results
- The analysis of the impact of being wrong with respect to the traffic estimated through the impact analysis was determined by using the simulation model to analyze the level of service and delay for each location using the difference traffic configuration presented previously. The analysis will go through each location independently and each location is evaluated using standard delay and level of service values [7].
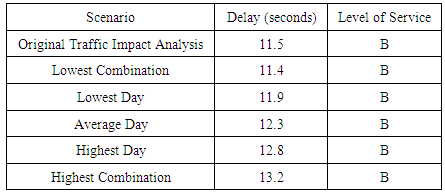
3.1. Westside Access
- The first location analyzed was Westside Access. As mentioned, this is a right in-right out single stop controlled intersection. Because of the intersection configuration, the only delay associated with the intersection is the westbound right turns leaving the facility, as all other movements are uncontrolled. The results of SYNCHRO runs are shown in Table 1.
|
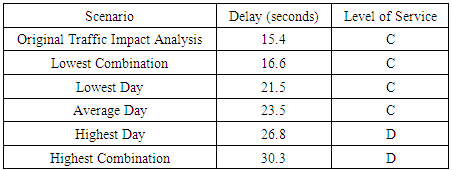
3.2. Southeast Access
- The second location analyzed was the southeast access. As mentioned, this is a single stop controlled intersection with left and right turns into and out of the development. This access is a secondary access to the facility as there is limited development to the south along the eastern roadway. For this location, the eastbound left turns represent the significant movement where delay will occur. The results of SYNCHRO runs are shown in Table 2.
|
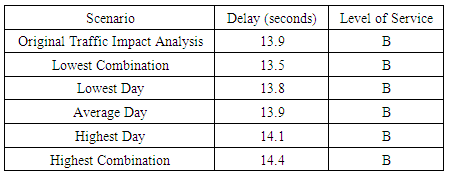
3.3. Northeast Access
- The third location analyzed is the northeast access to the development. This location is a single stop controlled intersection and serves as the main entrance point to the development. Again, the main movement of concern is the eastbound left turns as drivers will have negotiate this movement with traffic passing by and returning from the exit further south. The results of SYNCHRO runs are shown in Table 3.
|
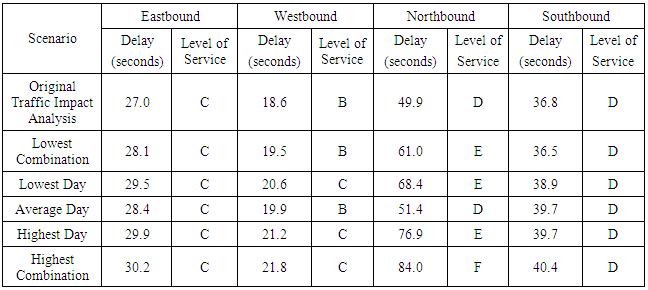
3.4. Northeast Intersection
- The fourth location analyzed was the signalized intersection northeast of the development. For this location, all four approaches were analyzed. The results of SYNCHRO runs are shown in Table 4.
|
3.5. Northwest Intersection
- The fifth location analyzed is the signalized intersection northwest of the development. Similar to location four, for this location all four approaches were analyzed. The results from the simulation were such that the original traffic impact analysis and the different traffic scenarios all resulted in a level of service of F for this intersection, with the delay only increasing from 149.2 seconds per vehicle in the original study to 153.1 seconds per vehicle in the extreme traffic situation. As this is such a minor increase, this intersection was not analyzed further.
4. Conclusions
- This paper examined the impact of making incorrect traffic forecasts in a traffic impact analysis. While only one location was analyzed, it can be seen that the impacts can vary greatly depending on location and type of intersection. For the two main access locations to the facility, the Westside Access and Northeast Access, the increases in traffic volumes had very different impacts. The Westside Access right in-right out didn’t show a significant increase in delay while the Northeast Access location actually doubled in delay for the highest traffic combination. This result supports the design efficiency of the right in-right out access for reducing delay. Also, the increased delay for the single stop controlled intersection at the Northeast Access could potentially lead to traffic congestion in the parking lot and crashes at the locations due to impatient drivers.