-
Paper Information
- Paper Submission
-
Journal Information
- About This Journal
- Editorial Board
- Current Issue
- Archive
- Author Guidelines
- Contact Us
International Journal of Traffic and Transportation Engineering
p-ISSN: 2325-0062 e-ISSN: 2325-0070
2015; 4(3): 94-101
doi:10.5923/j.ijtte.20150403.03
Effects of Motorcycles on Saturation Flow Rates of Mixed Traffic at Signalized Intersections in Ghana
 Abstract
 Reference
 Full-Text PDF
 Full-text HTML
Charles Anum Adams1, Mohammed Abdul Muhsin Zambang2, Richter Opoku - Boahen3
1Civil Engineering Department, Kwame Nkrumah University of Science and Technology, Kumasi, Ghana
2Civil Engineering Department, Tamale Polytechnic, Ghana
3Civil Engineering Department, Takoradi Polytechnic, Ghana
Correspondence to: Charles Anum Adams, Civil Engineering Department, Kwame Nkrumah University of Science and Technology, Kumasi, Ghana.
| Email: |  |
Copyright © 2015 Scientific & Academic Publishing. All Rights Reserved.
Saturation flows which are important for the design of signalized intersections and capacity analysis depend on the vehicle mix in the traffic stream. Traffic mix in the Savannah Accelerated Development Authority (SADA) zone in Ghana may be classified as mixed due to the high proportion of motorcycles; this makes it very different from the rest of Ghana. In this study, passenger car unit values and saturation flow rates were determined at three signalized intersections in the Tamale metropolis. Traffic volume at the three signal intersection approaches were videotaped during the peak to ensure saturation flow and queuing conditions. The three hour films were played on a laptop computer and the traffic flow manually classified into four groups: motorcycles, tricycles, car/taxis and buses/trucks. The data were analyzed using regression techniques to determine saturation flow. Average saturation flow values of between 3252 pcu/hr and 3810 pcu/hr were observed with the high values being as a result of the high proportion of motorcycles in the traffic. The results show that the higher the motorcycles on any approach the lower the headway and the higher the saturation flow.
Keywords: Mixed Traffic, Motorcycles, Passenger Car Unit, Saturation Flow Rate, Signalized Intersections
Cite this paper: Charles Anum Adams, Mohammed Abdul Muhsin Zambang, Richter Opoku - Boahen, Effects of Motorcycles on Saturation Flow Rates of Mixed Traffic at Signalized Intersections in Ghana, International Journal of Traffic and Transportation Engineering, Vol. 4 No. 3, 2015, pp. 94-101. doi: 10.5923/j.ijtte.20150403.03.
Article Outline
1. Introduction
- Signalized intersections are an essential part of a road network, particularly in urban areas where traffic congestion has always been a problem. [1] defines saturation flow as the maximum constant departure rate of a queue from the stop line of an approach lane during the green period. Traffic operation at signalized intersections would be much easier to analyze if all vehicles in the traffic stream were identical. However, saturation flow is influenced by the proportion and type of vehicles in the traffic stream. Therefore, passenger car unit (PCU) values are usually assigned to various categories of vehicles in order to normalize the saturation flow to a common base of passenger car units per hour (pcu/hr).Mixed traffic situations with high composition of motorcycles is common in most developing countries. According to [2], more than 80% of the total transportation modes are two – wheelers in Hanoi, Vietnam, whiles there are approximately 7.5 million registered motorcycles in Malaysia with an increase in motorcycle ownership from 0.13 in 1990 to 0.28 motorcycles per person in 2006. In Korea, authorities have prepared a special area in front of signalized intersection stop lines to accommodate the high volume of motorcycles. Other countries like Taiwan have introduced a segregated flow concept to improve the performance of traffic mixed with motorcycles [3]. In the city of Bangalore, India, two-wheelers constitute more than 70% of the total volume, while cars comprise 15%, autos 4% and the remaining include vehicles such as buses, vans and tempos [4]. In Nigeria, Uganda and Kenya motorcycles serve as a mode of Para transit service to deliver people and goods [5-6]. The vehicle population of Ghana in 2011 stood at 1,122,700 with an average registration of 60,000 vehicles annually representing an average of close to 10% annual growth [7]. In 2010, the Driver Vehicle Licensing Authority (DVLA) registered 102,330 motor vehicles out of which 36,097 were motorcycles representing about 35.28%, which is the highest in any vehicle category registered in 2010 [7]. This indicates that, the use of motorcycles as a mode of transport in Ghana is becoming increasingly popular especially in the Savanah Accelerated Development Authority (SADA) zone.The SADA zone comprises the three northern regions of Ghana namely Upper East Region, Upper West Region and Northern Region and stretches to include the districts contiguous to the Northern region that are located in the North of the Brong Ahafo region. The SADA zone occupies 40% of Ghana’s land area and 30% of the population [8]. Tamale is the capital town of the Northern Region, motorcycles constitute more than 44% of the vehicle population in the Tamale metropolis[9] and more than 59% of all screenline counts are motorcycles and tricycles.This traffic situation makes traffic stream characteristics in the SADA zone very different from the rest of Ghana and therefore the designer has to consider local values of PCU and saturation flows. The nature of the traffic is very similar to those found in countries such as Uganda and Sierra Leone where motorcycle population is high.
2. Saturation Flow Rate Measurement Techniques
- All the existing methods of measuring saturation flows assume that saturation flow rate is fixed during a saturated green signal. Three distinguished measurement methods have been proposed: Headway method, Regression technique, as well as Transport and Road Research Laboratory (TRRL) method.The Headway method according to [10-11] estimates the average time headway between the vehicles discharging from queue as they pass the stop-line. The first several vehicles are skipped to avoid the effect of vehicles' inertia in the initial seconds of green time. The saturation flow rate is calculated as reciprocal of the mean headway.Regression technique as argued by [12-14] is used to develop an equation involving saturated green time, number of vehicles in various categories, and lost time. The TRRL method requires that vehicles are counted in three saturated green intervals. The saturation flow is calculated as the number of vehicles in the middle interval divided by the length of this interval [15]. All these methods are appropriate for actual saturation flow profiles that have the plateau shape indicating uniform departure from the stop line after the initial starting lost time. Use of a single saturation flow rate to calculate a delay introduces a bias to the estimate of deterministic delay. An optimization technique was proposed by [16] to fit theoretical profiles and to improve the estimation of the deterministic delay.[17-18] found that the average headway method is the best for predicting saturation flows, lost times and PCU factors. The TRRL method also gives good estimates of saturation flows and lost times, although it sometimes underestimates the lost times. Comparing these two methods, the former one requires data in time headway format which is usually very difficult to collect, especially in non-lane based traffic conditions, where due to the lack of lane discipline, vehicles form a queue with no clear pattern and during subsequent discharge due to the penetration effect narrower vehicles occupy the front of the queue and discharge in a group. Although it is possible to record individual headways of vehicles crossing the stop line, nonetheless the headway method cannot be applied because the vehicles are not moving in a line and one vehicle may have more than one leader. Therefore, the headway ratio method could not be applied in this study. Due to the difficulties in measuring headways of vehicles in non-lane based traffic conditions and due to the fact that total approach width is adopted for analysis of saturation flows in the current study, the option of counting is more appropriate in this respect.Although the TRRL method requires data in simple classified vehicle count format, it does not allow one to calculate PCU values which are essential for saturation flow (in pcu/hr) measurement. Due to this limitation it is also not considered here as an alternative method. The option left is the regression method which gives saturation flow and PCU values simultaneously and is therefore attractive. However, investigation by [19] revealed that while the synchronous regression method produced a good approximation of PCU factors as well as saturation flow, corresponding values produced by the asynchronous multiple regression method underestimate the true factors from those of the headway ratio method. Hence, the synchronous counting method is more attractive in terms of data collection and analysis.
3. Methodology
3.1. Study Sites and Intersection Layout
- There are five (5) signalised intersections in the Tamale metropolis but three were studied due to their similarity in intersection geometry and characteristics of traffic and driver behaviour. The three (3) intersections that were used in the study were located on the Tamale – Kintampo road, Hospital road and on the Tamale – Bolga road. These have been labelled A, B and C respectively. Figure 1 and Figures 2a, 2b and 2c show aerial images depicting the layout of the intersections.
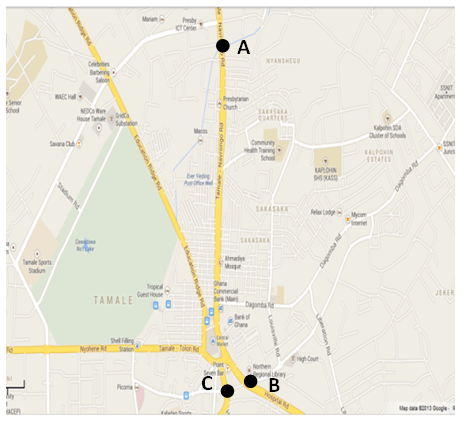 | Figure 1. Location of Intersections A, B and C |
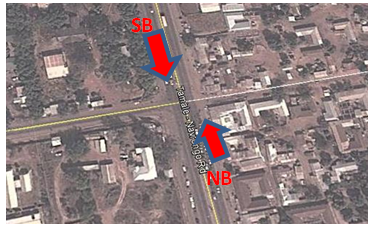 | Figure 2(a). Tee Intersection A |
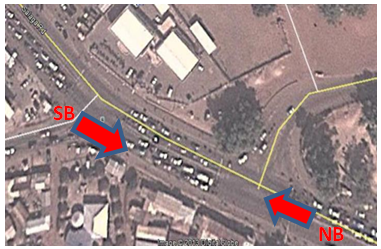 | Figure 2(b). Tee Intersection B |
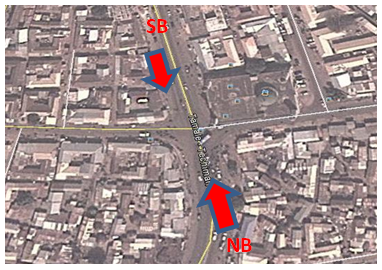 | Figure 2(c). Cross road Intersection C |
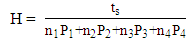
3.2. Estimation of Headway and Saturation Flow (in pcu/hr)
- The PCU values were evaluated using multiple linear regression analysis, in which the saturated green time is a function of vehicles passing the stop line during that green time. It was assumed that the relationship between dependent and independent variables is linear and the regression function can be represented in a general form as given in (1).
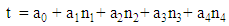 | (1) |
|
 | (2) |
 | (3) |
 | (4) |
 | (5) |
 | (6) |
4. Results and Discussion
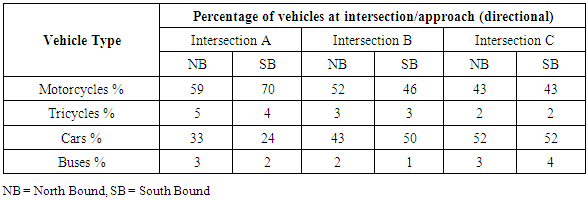
4.1. Traffic Composition
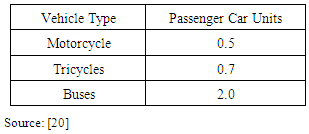
- For each of the three (3) intersections, the main road was identified and studied. Table 2 shows the directional distribution and classification of vehicles traversing each main road approach at the respective intersections.At least 43% of all vehicles observed during the study for the three hour period at each intersection were motorcycles which are the major mode of private transportation in the metropolis, cars/ taxis constituted the next highest category with at least 24%. Busses/trucks and tricycles were less than 5%. As a result of the high percentage of motorcycles in the traffic, motorcycles normally stop beyond the stop line, thereby reducing the area of manoeuver at the intersections especially at intersection A where the motorcycle percentage is over 60% of the traffic.
|
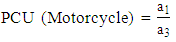
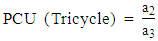
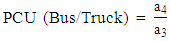
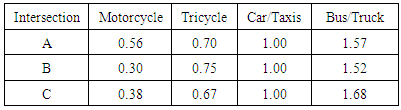
4.2. Estimation of Passenger Car Unit (PCU)
- From the regression analysis, the PCU factors of each group were obtained when the coefficient of that group was divided by the coefficient of the car group as shown in Table 3. An average PCU factor of 0.4 was thus obtained for motorcycles considering all the approaches studied.
|
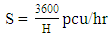
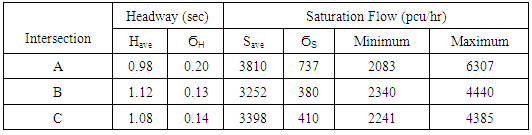
4.3. Headway and Saturation Flow (in pcu/hr)
- The average headway and saturation flows obtained are shown in Table 4.
|
|
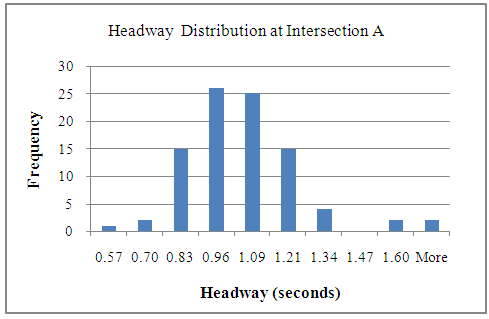 | Figure 3(a). Headway distribution at Intersection A |
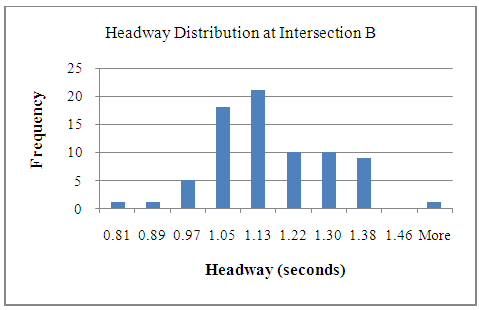 | Figure 3(b). Headway distribution at intersection B |
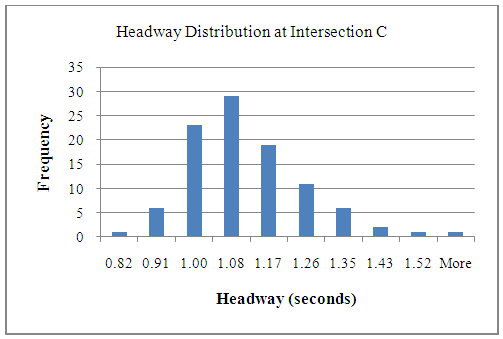 | Figure 3(c). Headway distribution at intersection C |
4.4. Effect of Motorcycles on Headway
- The headway distribution at the three intersections is presented in Figures 3(a), 3(b) and 3(c). Mean observed headways were 0.98 seconds, 1.12 seconds and 1.08 seconds at intersections A, B and C respectively. Intersection A had 59% motorcycles at the Northbound approach and 70% at the Southbound approach, Intersections B and C on the other hand had 52% and 43% at the Northbound approach with 46 and 43% at the Southbound approach respectively. The high percentage of motorcycles at Intersection A has a great influence on the comparatively lower headway. The presence of motorcycles in the traffic stream creates variability in the flow as the presence of these motorcycles ahead of and in between vehicles influences the speed selection and therefore the headway and spacing between vehicles. The number of motorcycles at B and C are lesser which accounts for the slight increases in the headways.In order to study the relationship between percentage of motorcycles in the approaching traffic and the headway, a linear relationship was explored using the data from the three intersections. Figure 4 presents a plot of the average headway and percentage of motorcycles crossing the stop line during each saturation green time cycle at the approaches. The regression coefficient indicates that, there is a very weak or no correlation between headway and percentage of motorcycles for the over 70 cycles observed. Due to lack of lane discipline and the fact that motorcycles arrange themselves in front and between vehicles in a non-uniform way, the headway of vehicles does not correlate with the number of motorcycles. This means that in the estimation of headway, unlike in a uniform flow traffic regime where saturation headway may be obtained after neglecting the first few vehicles and taking the headway, for mixed traffic intersections, the headway does not only depend on the number of motorcycles in the flow but their performance and arrangement in and between vehicles.
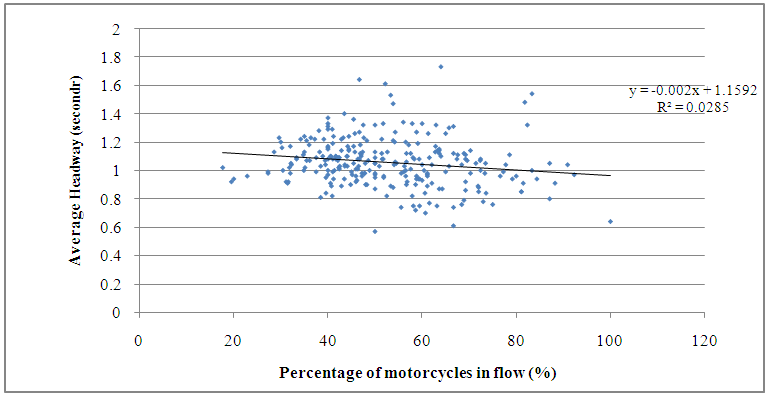 | Figure 4. Average headway against percent of motorcycles |
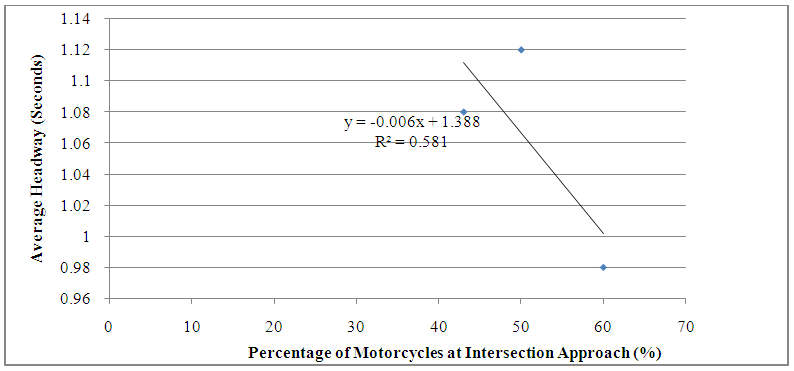 | Figure 5. Average headway against percent of motorcycles |
4.5. Effect of Motorcycles on Saturation Flow at Intersection Approach
- Figure 6 gives an exploratory regression of the saturation flow past the approaches during green time indication. There is no correlation or a very weak positive correlation between the number of motorcycles in the flow and the saturation flow. The data is too erratic to produce a uniform saturation flow rate.
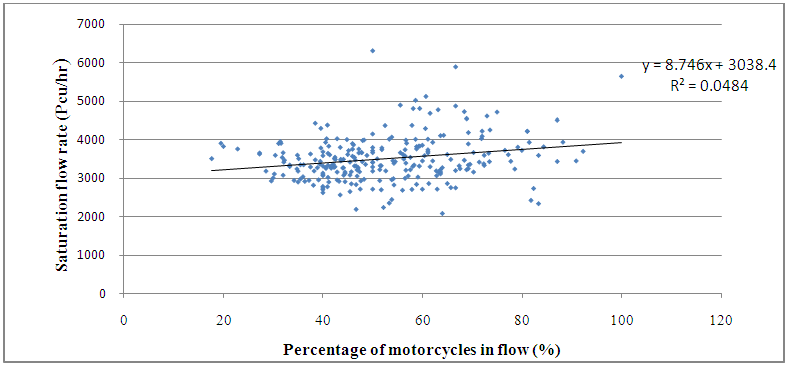 | Figure 6. Saturation flow against percent of motorcycles |
 | Figure 7. Saturation flow against percent of motorcycles |
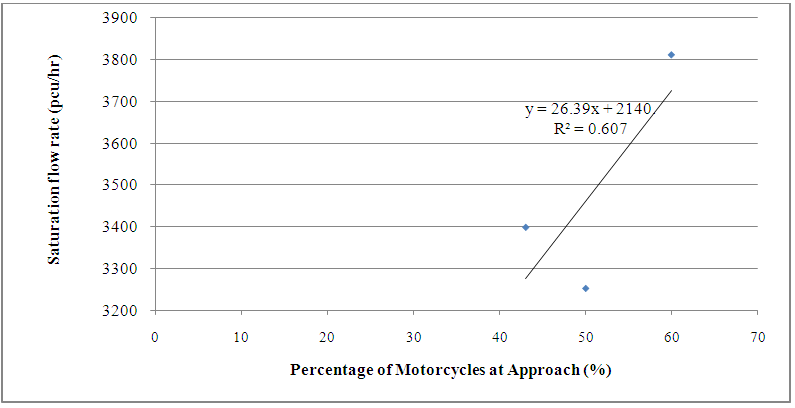
5. Conclusions
- - Observed average saturation flow rates for the intersection A, B and C were 3810, 3253 and 3398 pcu/hr respectively. Higher values of saturation flow result from a high proportion of motorcycles in the traffic stream. Hence the saturation flow rate at the intersections is strongly affected by the presence of motorcycles.- The greater the proportion of motorcycles at the approach, the lesser the headway