Obasanjo O. T., Francis Martina
Department of Geography, Ahmadu Bello University, Zaria, Kaduna State, Nigeria
Correspondence to: Obasanjo O. T., Department of Geography, Ahmadu Bello University, Zaria, Kaduna State, Nigeria.
| Email: |  |
Copyright © 2015 Scientific & Academic Publishing. All Rights Reserved.
Abstract
In spite of the important role transport play in any urban area, transport services are frequently insufficient to meet commuters demand with the services provided suffering from low output. This study assesses the quality of intra urban bus services in Kaduna metropolis as perceived by bus commuters. This study relied on systematic sampling of eight major terminals from which 357 bus commuters were purposively interviewed. Descriptive and inferential statistical techniques were used to summarise the data collected. The study revealed that majority of the commuters (70.3%) walk between 1-500 metres to reach bus stops and 66.9% waited between 1-20 minutes before the arrival of bus. A cross tabulation between the age by walking distance of bus passengers shows a clear difference in the walking distance of passengers to bus stops by age distribution. Also the study revealed that there is a strong relationship between the level of education and the problems encountered by commuters (r = 0.70 and Kendall’s Tau = 0.744). Similarly, Phi value = 0.72 and Cramer v = 0.51 indicate a strong relationship between the bus passenger capacity and the problems passengers encountered. Most passengers are not satisfied with the level of bus services provided. The study therefore recommends that certain policy actions such as the use of conventional buses, bus priority measures among others need to be taken in order to improve the quality of intra-urban bus services in Kaduna metropolis.
Keywords:
Quality, Intra-urban, Passengers, Bus services
Cite this paper: Obasanjo O. T., Francis Martina, Quality of Intra-Urban Passenger Bus Services in Kaduna Metropolis, Nigeria, International Journal of Traffic and Transportation Engineering, Vol. 4 No. 1, 2015, pp. 1-7. doi: 10.5923/j.ijtte.20150401.01.
1. Introduction
Public transport systems provide the most efficient means of moving large numbers of people, especially in densely populated urban centers. In addition to the well-being of its users, public transport plays a vital role in the productivity of cities which, in turn, has a direct bearing on the national economy (World Bank, 2001, Lyndon and Todd, 2006). Public transport is often defined as a system whereby passengers or goods are carried by either private or public carriers for money (Adeniji, 1982). Public transport connotes the act or means of conveying large number of people as opposed to conveyance by individual vehicle carrying very few people at a time. In other words, public transport is a system in which a greater number of people are moved at a time along principal transport corridors (Badejo, 1990). In most cities of developing countries such buses are the major mode of public transport and are often the only one affordable to the poor. The bus is a large motor coach or vehicle for carrying many passengers, usually along a regular route.The bus system has the potential of being used as a policy tool to reduce the number of cars on urban roads and so reduce traffic chaos in the city. It also has the potential of extending transportation services to a greater proportion of urban residents who do not have private cars and cannot afford frequent taxi fares (Andeleeb et al, 2007). The demand for public bus transport in developing countries is very high as a result of many people being within the low income bracket. Nonetheless, the available alternative modes for public transport are very limited and few in developing countries compared to developed countries.Despite the vital role intra-city buses play in any urban area, their services are frequently insufficient to meet the demand which leads to poor quality of services, overcrowding, environmental pollution among others (Ali, 2010). The buses used for intra-urban passenger services in developed countries are mass transit buses which have the capacity to accommodate twenty or more passengers, depending on the type (Transjakarta, 2011). Furthermore, intra-urban bus services in advanced countries operate on schedule and are constructed with passenger safety in mind, with equipment’s such as glass shattering hammers, emergency doors and fire extinguisher in case of fire outbreak or emergency. In addition, such buses often follow lanes restricted to other traffic and in some cases separated by concrete blocks on the street that become part of the bus right-of-way.In Kaduna metropolis, the situation is different from what obtains in developed nations. Here in Kaduna metropolis, the growing demand for intra-urban bus services is not met by government-owned bus services and this has encouraged the growth of unorganized private small bus operators. Consequently, commuters’ legitimate needs are not met because their services are inefficient. The fundamental goal of the Federal Government of Nigeria (2010) is to develop an adequate, safe, environmentally sound, efficient and affordable integrated transport system within the framework of a progressive and competitive market economy. An “adequate transport system” means that available transport infrastructure and services should meet the needs of Nigerians for access to the market, place of work and to basic social services. A “safe transport system” means that all reasonable standards are set and actions taken to prevent accidents and minimize the number of potential victims and the destruction of property. An “environmentally sound transport system” means that reasonable, effective action will be taken to minimize atmospheric and other pollution by the establishment of appropriate regulatory standards. An efficient transport system means that the transport services are provided in such a way that it will reduce costs and improve service quality. This implies progressive reduction of social cost, the control of other external costs of transport, and the expenditure of public funds in a way that is properly justified and carefully managed. An affordable transport system means that adequate transport services can be enjoyed by all classes of Nigerians at reasonable cost, and where market mechanism fails to provide this, the Government will intervene to support the provision of essential transport services. An integrated transport system means effective connectivity between port, rail, road, inland waterways and air, thereby making use of the advantages of different modes to ensure seamless movement of goods and people and better utilization of resources (F.G.N, 2010).Customer satisfaction with transportation services can be placed in the framework of stakeholder (passengers) interest. From this perspective customer satisfaction with bus transportation can be used to find reasonable solution to problems (Ali, 2010). The more frequent passengers have to change buses to get to their destinations, the less satisfied they will be with bus service (Olagunju, 2011). Olagunju (ibid) also cited Oni (1996) saying Nigerian cities commuters’ are not provided with good bus stand facilities. Very few permanent buses stands, offer appropriate physical structures and facilities for people to board or disembark from the buses. Passengers often stand by the road side or on the road. Moreover, there is no shelter from the scorching sun or heavy rain. For a long wait at the bus stands, there is no alternative but to remain standing. In the evening not many stops are well lighted and this can be a cause of consternation. Many buses that ply the city have minimal inspection requirement and are quite dilapidated. They continue to operate on city streets for lack of systematic monitoring and supervision of their physical and mechanical conditions. With extensively damaged exteriors, non-functioning lights, broken windows, dented and bent bumpers etc., they epitomize how many buses are able to avoid official inspection and maintenance while endangering public safety. The quality of both living and working environment in Kaduna metropolis are eroded by massive traffic jam, excessive noise, air unfit to breath, overcrowding and difficulties in going to work and journey back home. The quality of transport services is an amalgam of many attributes, such as timeliness, reliability, security, safety, comfort and cleanliness (Mfinanga and Ochieng, 2006). Timeliness and reliability are viewed as preconditions which have to be satisfied before other attributes can assume their full importance. However, in order to achieve timeliness and reliability, a bus must be protected from traffic congestion. This means that more attention must be given to bus ways, bus lanes and bus priority at junctions. This paper examined conditions in which passenger buses in Kaduna metropolis meet the attributes of quality of bus services as stated by Mfinanga and Ochieng (2006). In the past two decades, the city of Kaduna has being experiencing rapid population increase and physical expansion due to influx of immigrants from rural areas to the city. The growth has been accompanied by a substantial expansion of city’s boundaries and much higher level of industrial, economic and social activities. These have led to the extension of low income unplanned settlement at the city peripheries and workers from the area exerting increasing pressure on already inadequate transport facilities. Ezema (2004) observed that the high cost of purchasing cars and maintenance in Nigeria, the spreading of sub-urban and transformation of villages into dormitory settlements, have also created residential-to-work transportation problems in metropolitan cities as a result of inefficient bus transit system. The fundamental objective of this paper is to assess the quality of intra-urban passenger bus services in Kaduna metropolis with the view of determining its efficiency in terms of waiting time, convenience and safety of commuters.
2. Materials and Methods
The sources of data for this research include both primary and secondary sources. The primary source was achieved through physical observation and interviews for the collection of data, while the secondary sources include information from journals, textbooks and related material for this research. Kaduna metropolis has more than 20 routes that link its transport network with more than 87 major/minor bus stops (Kaduna State Ministry of Works and Transport, 2012) and about 3,615 registered buses for intra-urban services (NURTW, 2012). Because of these numerous road networks, number of bus stops, number of buses, time constraint and limited resources and in line with Aderet et al., (2008) suggested that sample size should be small in order to improve the quality and accuracy of research work, only 8 centres were selected as sample for this study. Systematic sampling technique was used in the selection of sample points. The sample points selected were Barnawa, Kabala-west, Kasuwa, Kudenda, Narayi, Romi, Tudun-wada and Ungwan Rimi. Bus drivers and commuters were purposively interviewed. A sample of 357 respondents from the research area was interviewed. The fact that the number of commuters moved by these buses daily cannot be ascertained, a ratio of two to one passengers per bus (2:1) was used to determine the number of commuters. Descriptive and Inferential statistical techniques were used to summarize the data collected. Using SPSS, correlation analysis was use to check for relationship between variables while Cramer’s V and Phi were use to examine the relationship between bus capacity and the problems passengers encounter. The study area is Kaduna, was secured in 1902 by a colonial proclamation when the area was declared an administrative station, after the occupation of Northern Nigeria by the British. A military and administrative camp was cited and surveyed in this particular location by a detachment of the West African Frontier Forces (WAFF) then located in Kano and Zungeru (ibid). After the survey, the gently rolling guinea savannah grassland area was recommended for development purposes as the northern protectorate headquarters. Kaduna is in the class of Nigerian modern cities that originated in direct response to the administrative and economic initiatives of the colonial period. This settlement came to prominence in 1917 when Lord Lugard relocated the seat of government of the protectorate of the Northern Nigeria from Zungeru to Kaduna. Lord Lugard arrived Kaduna location, his new administrative headquarters, by the Lagos-Kano rail that was built in 1909 and commissioned in 1911. He preferred Kaduna to Zungeru as the headquarters of the Northern Protectorate for more effective governance, control and communication with British troops stationed in Zaria. It became the capital of Nigeria’s former Northern Region from 1917 to 1967. It was the capital of North Central State from 1967 to 1976, the capital of Kaduna State from 1976 to 1987 and is still the capital of new Kaduna State after Katsina Province was excised from the old Kaduna State to form Katsina State in 1987. It emerged from an army encampment to become a centre of administration, commerce, industry, education and military establishments in the Northern part of the country (Chawa, 1989). The modern city of Kaduna was founded within the powerful Zazzau Emirate in an area inhabited by the Gbagyi (Gwari) a predominantly non-Muslim ethnic group. Their rural settlements were largely scattered in this savannah grassland though they were self-sufficient. The population operated a subsistence Agricultural economy after occupying the environment in the 13th and 14th centuries before the gradual settling down of the Hausa among them, especially north of the present Kaduna (Lock, 1967).
3. Results and Discussion of Findings
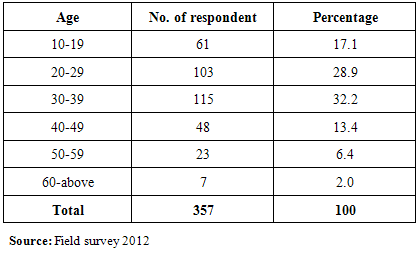
In analyzing and evaluating the quality of intra-urban passenger bus services, the age distribution of bus passengers determines the level of patronage of bus services within the metropolis. The age of bus passengers sampled is between 10, 60 years and above. Table 1 shows the age distribution of bus users in Kaduna metropolis. The information shown in table 1 indicates that 32.2% of passengers interviewed are within the ages of 30-39 years, 28.9% falls within 20 -29 years while 2% are 60 years and above. Cumulatively, the age group between 20 and 49 years accounted for the 74.5 percent; this age range indicates the most active group in the society.Table 1. Age distribution of passengers
 |
| |
|
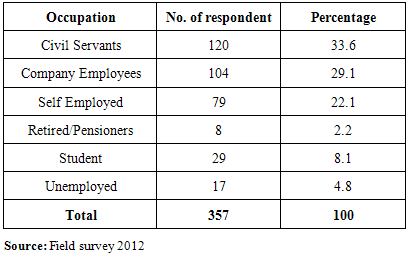
This suggests that the productive group of workers in Kaduna metropolis use bus services in large numbers. 2% from the table shows that only few number of old and retired people use buses. This could be attributed to lack of energy in terms of physical strength to engage in economic activities thereby limiting their movement and demand for bus services. Also, most of the retirees have moved from the urban areas to the rural areas which reduce their involvement in economic activities as compared to the economically active age group.Passengers OccupationBus Passengers occupation is an important aspect of the patronage of bus services. Daily mobility needs arise primarily because of the need to meet occupational demands or requirements. Bus passengers with different occupational status tend to move to their various places of work, business, social and educational purposes. Table 2 revealed that 33.6% which constitute the largest proportion are civil servant while 29.1% work in private sector.Table 2. Passengers occupation
 |
| |
|
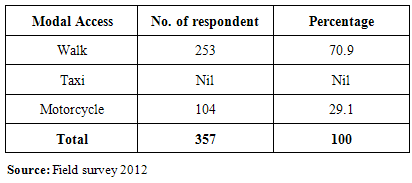
Deduction from this result implies that civil servants and private sector employees who are classified as commuters are the major users of buses within Kaduna metropolis. The low representation from the retired category (2.2%) confirmed the notion stated earlier in the age distribution table of bus passengers, that old people do not use bus services very often. Table 2 also indicates that unemployed people patronize bus services than the elderly citizen. The reason for the high patronage of bus services in the metropolis by civil servants and company employees can be inferred that Kaduna metropolis being an administrative centre and the former headquarter of Northern Province may account for the large concentration of these economic activities. More so, commercial activities are high in the area with the presence of several industries. Also, apparent absence of government organized official transport for civil servants may be responsible for the high patronage of commercial passenger bus operators by civil servants.Passengers Access to Bus StopModal access to bus stop constitutes part of the journey that is made by bus commuters. The survey identifies two main forms of access to bus stop in Kaduna metropolis. Table 3 shows that majority of the respondents access the bus stop by walking while 29.1% access the bus stop with motorcycle. The use of taxi recorded zero mainly because their services are limited to some areas where there are no bus services. The inference from this is that, there seems to be lack of transport coordination within the metropolis. This is unlike other developed countries like Britain and Lagos state in Nigeria with park and ride scheme where one can arrive at the bus stop or terminal with car, park it and take the bus to the final destination.Table 3. Passengers access to bus stop
 |
| |
|
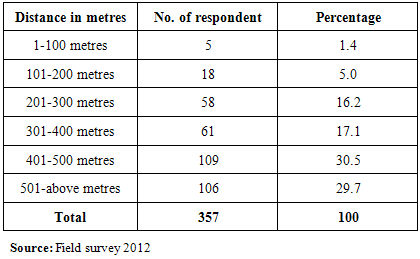
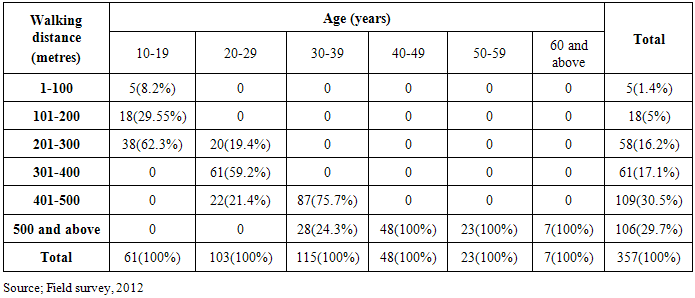
Walking distance to bus stop by bus passengersPassengers’ walking distance from origin or destination to the nearest bus stop is one of the important elements that determine the quality of bus services in any given urban area. Walking distance of a bus passenger can be defined as the distance passengers walk before reaching the nearest bus stop from origin or destination to catch bus services. One major observation during the survey is that quite a large number of respondents could not estimate the actual time they transverse but could visualize the physical distance it takes them to walk from origin to bus stop. Again, care must be taken in accepting and using the physical distance estimate provided by respondent in this study even though their timing seems to be fairly reliable, the fact remains that many of the bus passengers indicated that they walk along the bus route and when they see an approaching bus, they wave it down. If the bus is not yet filled-up, it stops for them to hop in. This might account for the walking distance provided by many of the commuters in the interview to be shorter in some cases.Table 4. Walking distance to bus stop by bus passengers
 |
| |
|
The World Bank (1987) explained that in reasonable well served urban areas, passengers are expected to find bus stop within 300-500 meters from their home or work place. Distance in excess of 500 meters may be accepted in low density area. In a densely populated area like Kaduna it is expected to walk between 300-500 meters to reach bus stop. In Kaduna metropolis, this study revealed that 70.3% walk between 1-500 meters while 29.7% walk 500 meters as shown in Table 4 above. Those using motorcycles fall within this category. This means that commuters walk short distance before reaching the bus stop. The reason is not far from the facts that bus stops are within the residential areas making it easy for commuter to access them.From table 5, the result by age shows a different pattern. Among the age range of 10-19years, 5(8.2%) of the respondents covers within 1-100metres walking distance to the bus-stop, 18(29.55%) walk a distance of 101-200metres to the bus-stop, while 38(62.3%) of the passengers walk a distance of 201-300metres to the bus-stop and among the same age range of 10-19years and none covers within walking distance of 301-400,401-500, and above 501metres respectively, to the bus-stop. Among the age range of 20-29years, none of the respondents are within walking distance of 1-100metres, 101-200metrer and above 501metres respectively, to the bus-stop. However, 20(19.4%) of passengers among the same age range walk a distance of 201-300metres, 61(59.2%) are within 301-400metres walking distance to the bus-stop. Similarly, 22(21.4%) usually walk a distance of 401-500metres to the bus-stop. Among the age range of 30-39years, 87(75.7%) walk a distance of 401-500metres, 28(24.3%) usually walk a distance of above 501metres to the bus-stop while, none of the respondents are within walking distance of 1-100,101-200, 201-300 and 301-400metres respectively, to the bus-stop. Among the age range of 40-49years, only 48(100%) of passengers walk distances of above 501metres to the bus-stop, 23(100%) of passengers among the age range of 50-59 years walk distances of above 501metres while 7(100%) of respondents within the age range of above 60years usually walk a distance of above 501metres to the bus-stop. These results inform us that there were clear differences in the walking distances of passengers to the bus-stop, by age distribution of these passengers. Respondents within the age range of above 30years walk less distances compare to those below 30years. This is because those within the age range of above 30years are within the working population and can afford to have their own private means of transportation than those below 30yrs, while those below 30 years still have physical strength to cover certain distances before boarding a vehicle.Table 5. The passengers’ age by walking distance
 |
| |
|
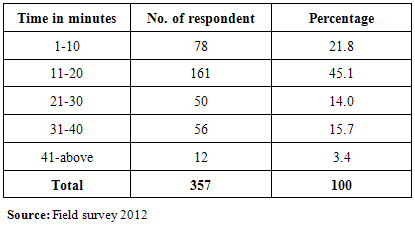
Waiting time of bus passengersAn important characteristic of a transport service is the time passengers have to wait before boarding a vehicle. In this study, waiting time for bus is defined as the time passengers spent at the bus stop between the passenger arrival at the bus stop with the intention of catching bus and the time the bus a passenger boarded departs from the bus stop. The average passengers waiting time as devised by the World Bank (1987), ranges from 1-10 minutes indicating high quality of services and the maximum time passengers are expected to wait for the arrival of buses at the bus stop ranges from 11-20 minutes.Table 6 reveals that majority of the passengers 66.9% spend between 1-20 minutes at bus stops while 3.2% spends 41 minutes and above. This indicates that the quality of bus service in Kaduna metropolis with respect to waiting time is moderate using the World Bank standard. The reason for the moderate waiting time can be linked to the walking distance the bus passengers indicated.Table 6. Passengers waiting time at bus stop
 |
| |
|
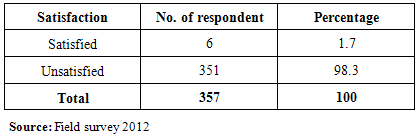
Passengers’ service satisfaction Service satisfaction indicates the performance of bus services in relation to convenience, safety and transport fare. Table 8 shows that 1.7% of the respondents are satisfied with the level of bus services while 98.3% are not satisfied with the level of services provided by buses in the area. This indicates poor level of bus services in the study area.Table 7. Passengers service satisfaction
 |
| |
|
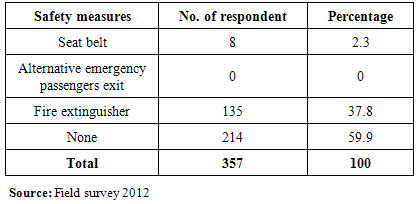
Table 8. Safety measures by bus passengers
 |
| |
|
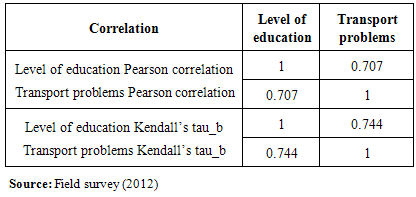
Bus passengers not satisfied with the bus services emphasized that the problem of overloading, delay in picking and dropping, the general behaviour of the bus crew particularly the bus conductor to the passengers and fare inflation, makes them not satisfied with the services. Overloading is one of the main causes of accident. It makes the driver to be uncomfortable while driving and make the buses to wear out easily because the buses carry more than their designed capacity. Similarly, passengers get tired easily when overloaded resulting to discomfort and more casualties will be recorded in the event an accident occurred. Picking and dropping of passengers by buses is time consuming. It delays passengers from reaching their destination at the appropriate time. Safety measures in the busesSafety measures in a bus tell how efficient and effective a bus safety service could be, which will eventually encourage the bus passenger to patronize the bus. In most developed part of the world that uses conventional buses, before any bus ply the road for commercial purpose, safety measure must be put in place. Some of these safety measures include seat belt, air bag, fire extinguisher, alternative emergency exit and glass shattering hammer. Table 8 revealed that 59.9% of the respondents viewed that most of the buses in use in the metropolis have no safety measures in place while other respondents viewed that the buses have seat belt and fire extinguisher as safety measure.This indicates that whenever there is an emergency in the bus, casualties will be high because of the absence of safety measures in the bus.Using the Pearson correlation and the Kendall's tau-b correlation coefficients, the result reveals that the Pearson correlation coefficient r = 0.707, p>0.001 shows that there is a strong association between the level of education and the problem passengers’ encounter in usage of buses.Table 9. Correlation between level of education and transport problems
 |
| |
|
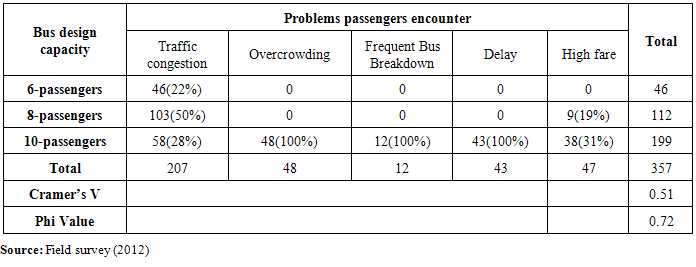
Similarly, Kendall's tau-b is a nonparametric measure of correlation which indicates the direction of the relationship. The absolute value indicates the strength: The larger the value, the stronger the relationship. Hence the Kendall's tau-b of 0.744 indicates a strong relationship between the level of education and the problem passengers encounter in usage of buses. The relationship is statistically significant at 95 percent.This study identified two modes of access to bus stop which include walking and the use of motorcycle with walking dominating by 70.9%. Also, 70.3% of commuters walk within one to 500 metres to reach bus stop and 66.9% waited between one to 20 minutes before the arrival of bus. Pearson’s correlation r = 0.707 and Kendal’s tau_b = 0.744 shows a strong relationship between level of education and transportation problems encounter by bus passengers. Similarly, Cramer V value = 0.51 and Phi = 0.72 shows a strong relationship between capacity and the problems bus passengers encounter.Table 10. Relationship between bus capacity and problems passengers’ encounter
 |
| |
|
4. Conclusions
In spite of the moderate waiting and walking distance encountered by commuters in Kaduna metropolis, bus services still suffer poor output. This is because of long in-vehicle time, bad seat, and untidy bus, lack of safety measures, overloading, traffic congestion and poor maintenance of buses by bus operators. Apart from these short comings, there is still room to strike a balance between the suppliers and users of public transport buses in Kaduna metropolis. Based on the study, it is recommended that the use of conventional buses should be adopted as against the use of mini buses in the metropolis. This will reduce the number of cars and buses plying the road consequently reduce traffic congestion, pollution, overcrowding and other associated problems, Bus priority measure should be encouraged by the State Government in order to facilitate fast and efficient movement of buses within the metropolis. This can be achieved by introducing Bus Rapid Transit (BRT) and Coordination of all modes of transport within the metropolis is highly desirable because rail services and road passenger services are available for use; they are just waiting to be coordinated. Motorcycles should serve as a feeder to bus services for passengers. Bus terminals in the metropolis need to be defined and upgraded to ensure they do not hinder the performance of services on that route. Route system within the metropolis should be enforced so as to provide adequate coverage of bus services in the entire city. There should be uniform rule controlling public transport operators in the city or regulations stating the level of services which public bus operators must provide. More roads should be constructed to link the Northern and Southern part of the metropolis so as to reduce the traffic congestion experienced on the major road linking the metropolis. Ticketing system of transport fare charges should be adopted. This will reduce to great extent the possibilities of exploiting passengers and create uniformity of fare in buses that ply the same route. Bus transport services should be run by companies rather than individuals for easy regulation and sanity in the transport system. However, individuals who can afford to buy bus or buses can lease them to the companies provided they meet up with the company standard.
References
| [1] | Adeniji, K., 1982, Solving Nigeria’s Transport Problems with Particular Reference to Intra-Urban Transport. Lecture Developed at the Polytechnic Ibadan. May, 12th, 1982, pp. 25. |
| [2] | Aderet, H. J., Mellerbergh, G. J. and Hand, D. J., 2008, Advance on Research Methods: A Consultant Companion. Huizen. Therlands: Johannas. Van Kessel Publishing. |
| [3] | Andeleeb, S. S., Mohmadul, H. Ahmed, R. I., 2007, Reforming Inner-city Bus Transport in a Developing Country: A Passenger Driven Model, Journal of Public Transportation. Vol. 10, No. 1.pp. 1-23. |
| [4] | Ali, A. N., 2010. An Assessment of the Quality of Intra-Urban Bus Services in the City of Enugu, being a Paper Presented at the Empirical Research in Urban Management.No.6 (15). May, 2010. |
| [5] | Badejo, B. A., 1990, Private Operations of Public Bus Services. The Case of Lagos Metropolitan Nigeria, Unpublished PhD Thesis University of London, UK. |
| [6] | Barbie, E., 2007, The Practice of Social Research. Eleventh edition PP. 198 Thompson Wadsworth, USA. |
| [7] | Chawa J., 1989, A-Z Tourist Guide to Kaduna. NDA Consultant, Kaduna. |
| [8] | Ezema, C. N., Problems of Road Traffic Management in Enugu Urban. Unpublished B.Sc Project, Department of Geography, University of Nigeria, Nsukka, 2004. |
| [9] | Federal Government of Nigeria, 2010, Draft National Transport Policy. |
| [10] | Kaduna State Ministry of Works and Transport (KSMWT), 2012. |
| [11] | Lock L., 1967, Kaduna a Survey of the Capacity Territory for the Government of Northern Nigeria. Max Lock and Partners, London. |
| [12] | Lyndon, H. and Todd, A. L., 2006, Evaluating New Start Transit Program Performance: Comparing Rail and Bus, Victoria Transport Policy Institute, Canada. |
| [13] | Mfinanga, D. A. and Ochieng, M. O. A., 2006, Development of a Model for Assessing Urban Public Transport Level of Service in Cities of Developing Nations. African Journal of Science and Technology (AJST) Science and Engineering Series.Vol.7, No. 2. |
| [14] | National union of road transport workers (NURTW) 2012, bus town service unit. Main Office, Kantin-Kwaripark, Kaduna. |
| [15] | Olagunju, K., 2011, Road Sense, Veragap Nig. Ltd. |
| [16] | Oni, S. I., 1996, “Urban Transport System and Traffic Management” A Paper Presented at the Seminar on Urban Transport Policy for Nigeria. Organized by Federal Urban Mass Transit Agency (FUMTA) from 6th to 8th August, 1996. |
| [17] | Transjakarta, 2011, Wikipedia, the Free Encyclopaedia. |
| [18] | World Bank, 1987, Bus Services: Reducing Costs, Raising Standard. Technical Paper No. 68. |
| [19] | World Bank, 2001, Urban Mobility: Profitability and Financing of Urban Public Transport Micro-enterprises in Sub-Saharan Africa-an Overview of Regional Study conducted in Abidjan, Bamako, Harare and Nairobi. |
 Abstract
 Reference
 Full-Text PDF
 Full-text HTML