-
Paper Information
- Previous Paper
- Paper Submission
-
Journal Information
- About This Journal
- Editorial Board
- Current Issue
- Archive
- Author Guidelines
- Contact Us
International Journal of Traffic and Transportation Engineering
p-ISSN: 2325-0062 e-ISSN: 2325-0070
2014; 3(6): 239-244
doi:10.5923/j.ijtte.20140306.02
Improving Traffic Fluidity and Road Safety Using Cellular Automata
 Abstract
 Reference
 Full-Text PDF
 Full-text HTML
S. C. Fowdur, S. D. D. V. Rughooputh
Department of Physics, University of Mauritius, Reduit, Mauritius
Correspondence to: S. C. Fowdur, Department of Physics, University of Mauritius, Reduit, Mauritius.
| Email: |  |
Copyright © 2014 Scientific & Academic Publishing. All Rights Reserved.
This paper analyses options for reducing congestion along a section of the motorway in Mauritius of length 7.56 km. The section consists of 6 roundabouts and is heavily congested during the afternoon peak hours. Using Traffic Cellular Automata, we first model the impact of substituting either one of the roundabouts with a flyover bridge and find that the congestion level remains unchanged. Furthermore, we find that even if one roundabout is present, the congestion level will still remain unchanged. The only solution is to substitute all the roundabouts by flyover bridges that would allow uninterrupted traffic flow. Besides we find that the number of possible rear-end crashes would also be significantly reduced.
Keywords: Congestion, Rear-end Crashes, Traffic Cellular Automata
Cite this paper: S. C. Fowdur, S. D. D. V. Rughooputh, Improving Traffic Fluidity and Road Safety Using Cellular Automata, International Journal of Traffic and Transportation Engineering, Vol. 3 No. 6, 2014, pp. 239-244. doi: 10.5923/j.ijtte.20140306.02.
Article Outline
1. Introduction
- Road traffic accidents and congestion have been recognized as being adverse elements which contribute to the suffocation of economic growth in the developing countries, due to the high cost related to them. Hence they are of social and economic concern. In 2005 the cost of road accidents in Mauritius was evaluated to some 2.6 billion Mauritian rupees [1] while the cost of congestion at around at around MUR 2B per year [2]. Besides road accidents result in the death of around 150 persons every year and some 200 more are seriously injured. Therefore there is an increasing need for measures to increase road safety. Road safety and traffic congestion are two issues which are still retaining much attention worldwide [3-6]. Traffic simulation techniques are now widely used throughout the world by road traffic planners and engineers to assist in decision making. Simulation in transportation is important because it can study models too complicated for analytical or numerical treatment, can be used for experimental studies, can study detailed relations that might be lost in analytical or numerical treatment and can produce attractive demos of present and future scenarios. Traffic Cellular Automata (TCA), in recent years, has turned out to be an excellent tool for the simulation of large-scale traffic networks [7-13].Two methods used for road safety works are Crash Analysis and Traffic Conflict Analysis. Crash Analysis consists of evaluating traffic safety by using accident (crash) data compiled by the relevant authorities. In Mauritius Crash data is collected by the Road Safety Unit (RSU). The aim of Crash Analysis is to identify hazardous locations and causal factors or to evaluate new safety programs implemented in a traffic system. On the other hand Traffic Conflict Analysis is a method that does not require any accident data. Such analysis can also be performed using TCA. Traffic conflict can be described as an event involving the interactions of at least two vehicles where at least one takes evasive actions to avoid an imminent collision [14]. The advantage of using conflict analysis on crashes is the possibility of examining even the near-crash events which are not available in crash report information [15]. In such analysis the situations that may lead to accidents are identified. Measures obtained from the model can be used as safety indicators. Svensson [16] has suggested some criteria that can be used to justify the usefulness of a measure as a safety indicator [16]. His suggestions are that the proximal safety indicators have to:• complement the crash data and occur more frequently than crashes,• have a statistical and causal relationship with crashes, and• enclose some near-crash characteristics in a hierarchical scale that describe all severity levels at the top and very safe movements at the bottom.Thus, for a measure to be taken as a safety indicator, then it needs to occur more often than the crashes such that its frequency can be used to draw some inferences about the safety/crashes on the concerned area. The second suggestion emphasizes the power of the measure to predict crashes. The final suggestion emphasizes their power to qualitatively describe crashes compared to other traffic parameters like speed and volume [15].
2. Methodology
2.1. Traffic Cellular Automata
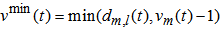
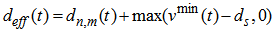
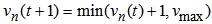
- TCA fall in the category of microscopic models that in particular can be used to simulate dense networks like cities [17]. The model we implemented in our simulator has been adapted from that proposed by Hafstein et al. [12] which in turn was inspired by the one proposed by Nagel and Schreckenberg in 1992 [18]. The differences between our model and the one implemented by Nagel and Schreckenberg are:(i) the model uses smaller cells of length 1.5m,(ii) a slow-to-start rule [19] has been applied,(iii) the model includes anticipation,(iv) two classes of vehicles are used. Passenger cars occupy 4 cells while Vans, Lorries and Buses (VLB) occupy 6 cells.Consider three vehicles n, m and l occupying consecutive positions as shown in Fig.1.
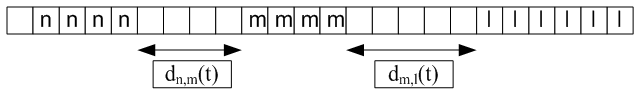 | Figure 1. Segment of road occupied by 3 vehicles |
 | (1) |
 | (2) |
 | (3) |
2.2. Accident Analysis Using Cellular Automata
- Accidents do not occur in traffic simulation models because safety conditions are strictly imposed on vehicle movement. The presence of safety distance makes micro simulation tools too ideal to model real world traffic. In 1997 Boccara et al. [22] proposed conditions that must be met by a vehicle in a TCA model for there to be a rear-end crash. These conditions are:(i) The gap of the subject vehicle is less than or equal to the maximum speed [dk,t ≤ vmax]—i.e., it will arrive at the position of the leading vehicle in the next iteration.(ii) The leading vehicle is moving at the current time step [vk-1, t ≥ 0].(iii) The leading vehicle stops suddenly at the next iteration [vk-1, t+1 = 0].The speed of the following vehicle being equal to the number of free cells in front of it, in the next time step it will reach the position of the next vehicle and a collision will take place. Yang et al. [21] have modified the necessary conditions for a traffic crash to occur in the framework of the stochastic CA traffic model. The modified conditions are as follows:• The speed of subject vehicle is exactly equal to the number of empty cells [vk,t = dk ] - i.e., the position of the leading vehicle can be reached by a careless driver who will increase speed by one unit above the safe speed.• The leading vehicle is moving at the current time step [vk-1, t ≥ 0].• The leading vehicle stops suddenly at the next iteration [vk-1, t+1 = 0].From these conditions it can be seen that a collision will only occur if the front vehicle is decelerating. The results obtained by Yang et al. support that accidents do not occur only at low densities. This finding was possible because the number of stopped vehicles was the only variable used in predicting crashes [15]. These conditions have been used in the paper to determine Nc , the number of possible rear end crashes over a number of time steps T. The accident probability per vehicle per time step is then calculated using the equation:
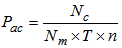 Where, Nm is the total number of vehicle motions during T and n is the average number of vehicles per time step.
3. Region under Study
- Mauritius is an island located in the Indian Ocean with a land area of 1865 km2. As at end of 2010, the population of the Republic of Mauritius stood at 1,283,415. The total road length on the island is of 2066 km. The motorization rate in Mauritius is of 230 and is likely to reach around 350 by the next decade [23]. Port Louis, the capital city, faces severe congestion problems in the morning and afternoon peaks. Solutions to alleviate congestion along the south-bound heavily congested Port-Louis to Curepipe corridor have already been investigated in Ref. 24 and 25. This paper concerns the North-Bound traffic which flows along the motorway from the Quay-D roundabout to the Terre Rouge roundabout as shown in Fig.2. A series of 6 roundabouts is located along a road stretch of 7.56 km. The implementation of TCA to the network is as shown in Fig.3.
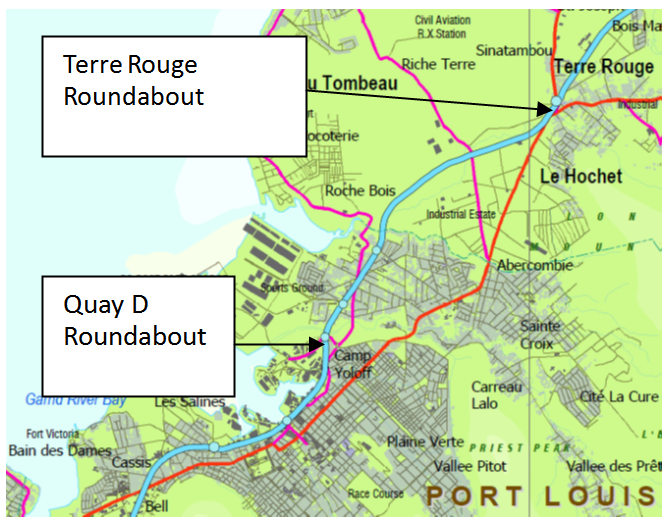 | Figure 2. Road stretch for Quay D roundabout to Terre Rouge roundabout |
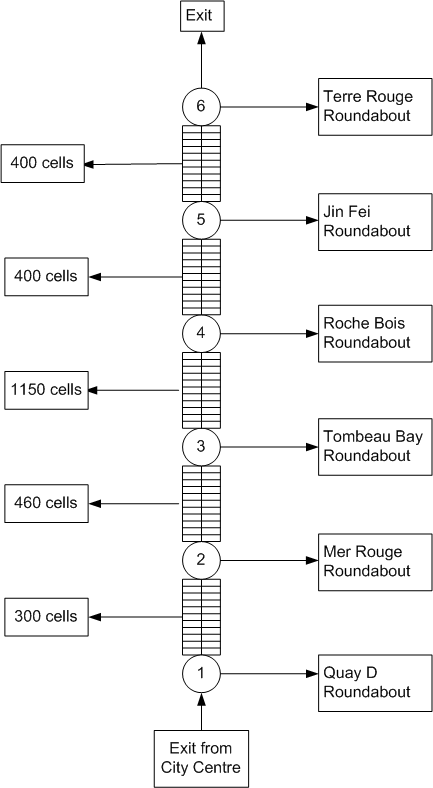 | Figure 3. Implementation of TCA along the road stretch |
4. Results and Discussions
4.1. Road Congestion
- We first simulated with the actual traffic network to obtain the hourly flux and the travel time along the motorway segment. We then investigated the effect of individually eliminating each roundabout. We next investigated the effect of separately maintaining only one roundabout on the segment and of eliminating all the roundabouts. In the case investigated only the Jumbo round-about is maintained while the others are replaced by flyover bridges. The results obtained are summarized in Fig.4 and Fig.5.
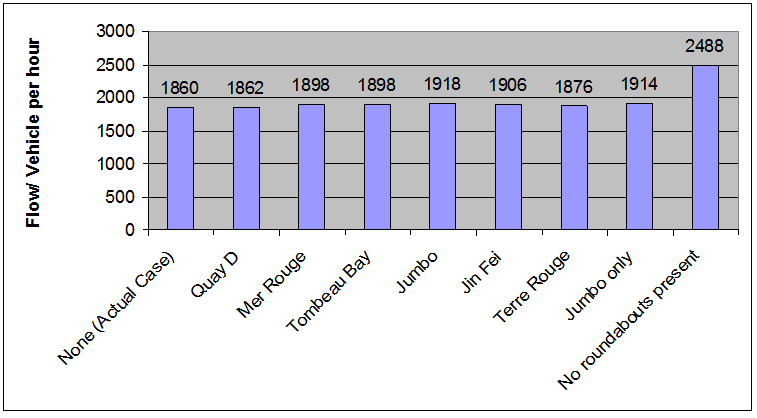 | Figure 4. The hourly flow of vehicles for the different scenarios |
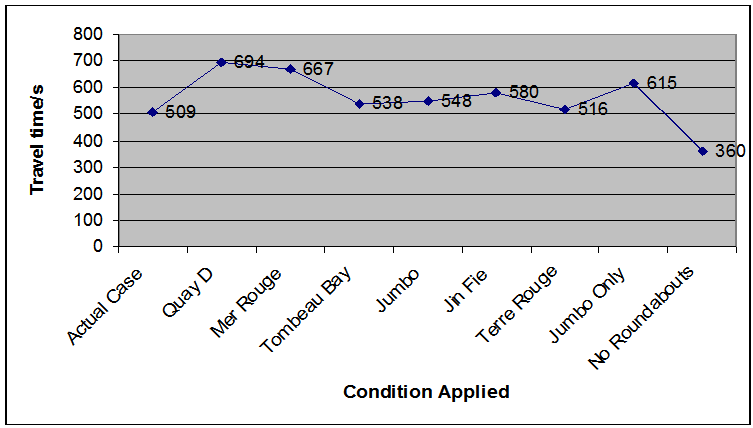 | Figure 5. Travel time for the different scenarios |
4.2. Road Accident
- In this section we provide the counts of the number of times the conditions for there to be a rear-end crash have been met. We focus solely on the actual case and the case where all the roundabouts have been replaced by flyover bridges. The results are summarized in Table 1.
5. Conclusions
- This paper investigates the possibilities of reducing congestion along a road stretch consisting of a series of roundabouts. The impact on the flux, travel time and rear-end crash possibilities of substituting the roundabouts by flyover bridges is investigated using TCA. It has been found that the only possibility of reducing congestion is to replace all the roundabouts with flyover bridges. A second finding of this paper is that a considerable decrease in rear-end crash possibility is obtained by substituting roundabouts by flyover bridges. Some of the limitations of the study are:1. Accident data over a period of only 4 years was available for the study.2. Feasibility studies as to whether sufficient space is available for the construction of flyover bridges at each roundabout has not been performed.
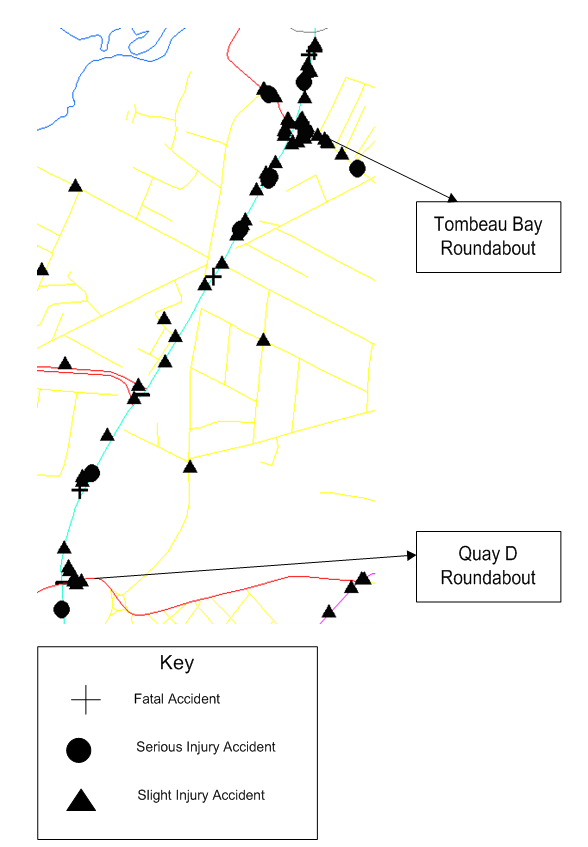 | Figure 6. Plot showing the location of accidents along part of the road stretch |
References
| [1] | TMRSU, 2006 Traffic Management and Road Safety Unit (TMRSU), 2006, Road Accidents in Mauritius Statistics and Analysis, Republic of Mauritius, TMRSU. |
| [2] | Mauritius Road Decongestion Program. http://www.mauritiustollproject.net/ [1 April 2011. |
| [3] | Jimoh Y. A., Itiola I. O., Adeleke O. O., Traffic Performance Analysis and Cost Comparison of Data Collection Methods for an Urban Rotary, International Journal of Traffic and Transportation Engineering, Vol. 3 No. 5, 2014, pp. 222-231. doi: 10.5923/j.ijtte.20140305.03. |
| [4] | Erick P. Massami, Evaluation of Road Traffic Congestion in Dar es Salaam City Based on Fuzzy Sets, International Journal of Traffic and Transportation Engineering, Vol. 2 No. 6, 2013, pp. 142-148. doi: 10.5923/j.ijtte.20130206.02. |
| [5] | F. Electricwala, R. Kumar, Identification of Black Zones on National Highways: A Case Study of an Indian City, International Journal of Traffic and Transportation Engineering, Vol. 2 No. 6, 2013, pp. 135-141. doi: 10.5923/j.ijtte.20130206.01. |
| [6] | S. Gurupackiam, T. Khan, M. Anderson, S. Jones, A Snapshot of Lane-specific Traffic Operations under Recurrent and Non-recurrent Congestion, International Journal of Traffic and Transportation Engineering, Vol. 3 No. 4, 2014, pp. 199-205. doi: 10.5923/j.ijtte.20140304.04. |
| [7] | B. Jia, R. Jiang and Q.-S. Wu, Int. J. Mod. Phys. C 15, 381 (2004). |
| [8] | Ch. Mallikarjuna and K. Ramachandra Rao, Cellular automata model for heterogeneous traffic, Journal of Advanced Transportation, 2009, 43, 321-345. |
| [9] | Lawrence W. Lan and Chiung-Wen Chang, Inhomogeneous cellular automata modeling for mixed traffic with cars and motorcycles, Journal of Advanced Transportation, 2005, 39, 323-349. |
| [10] | P. J. Gundaliya, Tom V. Mathew and S. L. Dhingra, Heterogeneous traffic flow modelling for an arterial using grid based approach, Journal of Advanced Transportation, 2008, 42, 467-491. |
| [11] | Haizhong Wang, Daiheng Ni, Qian-Yong Chen and Jia Li, Stochastic modeling of the equilibrium speed–density relationship, Journal of Advanced Transportation, 2011, 45. |
| [12] | S. Hafstein et al., Computer-Aided Civil and Infrastructure Engineering 19, 338 (2004). |
| [13] | Ministry of Flemish Government, 2001, Design mobility plan Flanders, Belgium. Available from:http://viwc.lin.vlaanderen.be/mobiliteit/ [2 January 2011] |
| [14] | Parker, M.R. Jr., and Zegeer, C.V., 1988, Traffic Conflict Techniques for Safety and Operations: Engineers Guide, FHWA, U.S. Department of Transportation, Washington, D.C. FHWA-IP-88-026. |
| [15] | V. Muchuruza, 2006, Simulation of traffic crashes using cell based microsimulation, Thesis (Phd), Florida State University. |
| [16] | Svensson, Å., 1998, A Method for Analyzing the Traffic Process in a Safety Perspective, Thesis (PhD), University of Lund. |
| [17] | J. Esser and M. Schreckenberg, Int. J. Mod. Phys. C 8, 1025 (1997). |
| [18] | K. Nagel and M. Schreckenberg, J. Phys. I 2, 2221 (1992). |
| [19] | R. Barlovic, L. Santen, A. Schadschneider and M. Schreckenberg, Eur. Phys. J. B 5, 793 (1998). |
| [20] | S. C. Fowdur and S. D. D. V. Rughooputh, J. Mod. Phys. C 20, 459 (2009) |
| [21] | Yang, X. Q., Ma, Y. Q., and Zhao, Y. M., 2004, Boundary Effects on Car Accidents in a Cellular Automaton Model, Journal of Physics A: Mathematical and General, Vol. 387, pg. 4743–4752. |
| [22] | Boccara, N., Fuk´s, H., and Zeng, Q., 1997, Car Accidents and Number of Stopped Cars due to Road Blockage on a One-lane Highway, Journal of Physics A: Mathematics General, Vol 30. pg 6167-6173. |
| [23] | Government of Mauritius. http://www.gov.mu [1 April 2011]. |
| [24] | S. C. Fowdur. and Rughooputh. S.D.D.V. Evaluation of Congestion Relief Proposals in a Capital City, Journal of Applied Mathematics, Hindawi, (2012), Article ID 420195. |
| [25] | S.C. Fowdur, S.D.D.V Rughooputh, 2013, An Application of ATSC to overcome the Pigou-Downs paradox, Int. J. Mod. Phys. C, Vol. 24, No. 6 (2013) 1350039. |