Stephen A. Arhin1, Errol C. Noel1, Olaoluwa Dairo2
1Department of Civil and Environmental Engineering, Howard University, Washington, USA
2Graduate, Department of Civil and Environmental Engineering, Howard University, Washington, USA
Correspondence to: Stephen A. Arhin, Department of Civil and Environmental Engineering, Howard University, Washington, USA.
| Email: |  |
Copyright © 2014 Scientific & Academic Publishing. All Rights Reserved.
Abstract
Transit reliability is a critical measure of performance since it is a major factor used by customers in making decisions on travel by rail and bus systems, especially in urban areas. Several performance metrics are used to assess the reliability of a transit system which include on time arrivals and customer satisfaction. The Washington Metropolitan Transit Authority (WMATA) established an arrival range of two minutes earlier and seven minutes later than the advertised scheduled arrivals at bus stops as the range for on-time performance. Most regional transit agencies, however, use a one minute earlier and five minutes later than the advertised scheduled arrivals at bus stops as their on-time performance range. This research determined the extent to which WMATA’s buses satisfy its performance goal of 78% for on-time arrivals. The bus arrival data was also used to determine WMATA’s on-time performance under the one-minute early and five-minutes-late arrival range used by several urban transit agencies from across the United States. For WMATA’s 2-minute early and 7-minute late arrival range, the buses were found to be on-time approximately 82% (on average) of the time during the morning travel. In the evening, for the same range, on average, 68% of the buses were considered to be on-time. This resulted in an overall on-time performance of 75% which is a modest improvement over the 2010 on-time performance of 74%. Using the 1-minute early and 5-minute late arrival range employed by several regional transit agencies, the buses were found to be on-time approximately 67% of the time during the morning and 55% in the evening, resulting in an overall on-time performance of 61%.
Keywords:
Transit Reliability, On-time Arrival, Bus Systems
Cite this paper: Stephen A. Arhin, Errol C. Noel, Olaoluwa Dairo, Bus Stop On-Time Arrival Performance and Criteria in a Dense Urban Area, International Journal of Traffic and Transportation Engineering, Vol. 3 No. 6, 2014, pp. 233-238. doi: 10.5923/j.ijtte.20140306.01.
1. Introduction
Transit reliability is a critical performance measure in recent years as local and state governments increase investment in bus and rail for urban travel. The increasing congestion on America’s roadways, the need for a cleaner environment, and constraints in building new highway facilities have stimulated increased use of mass transit systems for urban travel. Although commuters consider numerous factors in making urban commute decisions, access, cost, safety and reliability are the more dominant concerns. Transit provides mobility to those who cannot or prefer not to drive, and offers access to jobs, education and medical services. Transit reduces congestion, gasoline consumption and the nation’s carbon footprint [1]. In 1997, public transportation saved 646 million hours of travel delay and 398 million gallons of fuel in the U.S., saving $13.7 billion in congestion costs [2]. It has been estimated that the use of public transportation reduced carbon dioxide (CO2) emissions by 6.9 million metric tons in 2004 [3]. Communities can reduce traffic congestion and the adverse environmental impact of transportation by improving travelers’ confidence in the reliability of transit systems. Operators of urban transit make major investments to achieve reliability goals. Transit reliability management strategies could lead to better evaluation of changes that could improve ridership and load factors [4]. Public transit agencies have developed multiple indicators to measure quality of service. On-time performance, headway adherence (the time between two vehicles passing the same point traveling in the same direction on a given route), and run time adherence are some of the measures commonly monitored by transit agencies [5-7]. Unreliable service significantly impacts transit, passengers and potential future passengers, and is therefore a major concern to transit managers. The degree of adherence to advertised schedule arrival times and headways can also significantly affect customer satisfaction and perception of service quality. If buses do not run on schedule, service could be perceived as unreliable, resulting in long waiting times, loss of patrons and random crowding. Poor service translates to a decrease in ridership and revenue as well as potentially higher costs for overtime and use of extra buses to provide backup capacity. The Washington Metropolitan Transit Authority (WMATA) provides regional rail and bus transit service to the District of Columbia and its neighboring counties in Virginia and Maryland. Most of the bus routes are on arterial roadways in the DC metropolitan area. This research investigated schedule adherence and variability for the regional bus transit service in the District of Columbia. Arrival times of buses on a selection of arterial bus routes were observed in the field and used to assess WMATA’s accomplishment in meeting its performance against its goal of 78% for on time arrivals. WMATA’s range for on-time arrival at bus stops is within 2 minutes earlier and 7 minutes later than the published schedules.
2. Research Objectives
The objectives of this research are as follows:1. To determine the level of performance of the two-minutes-early and seven-minutes-late arrival criteria for the bus stops set by WMATA.2. To assess the on time performance of WMATA’s buses using the general used arrival range of 1-minute-early and 5-minutes-late. In this study, it is hypothesized that the mean deviations from WMATA’s on-time range is consistent along the bus stops on the corridors studied. The same hypotheses was tested using the most common industry on-time performance of 1 minute earlier and 5 minutes later than the scheduled arrival times.
3. Literature Review
Service reliability is a growing priority for transit agencies struggling to provide service that is both high-quality and cost-effective [8]. A high level of compliance is essential for attracting and retaining riders, particularly in areas where patrons have access to alternative modes of transportation [9]. Efficient scheduling and utilization of vehicle capacity increase the reliability of service and provide significant benefits to transit agencies and passengers alike [8]. In addition to containing operating costs, improved reliability lowers average passenger wait times, reduces bus crowding, and ensures greater predictability. The factors relevant to schedule reliability depend largely on service frequency, whether or not timed transfers are involved, and the functional purpose(s) of travel [10]. One of the key measures of transit reliability for all occasional transit users is schedule adherence. When buses conform to schedule, passengers are able to better coordinate their arrivals with other modes of transportation, resulting in average wait times that are generally less than the scheduled headway. In addition, headway is one of the most important indicators of reliability. In high-frequency service transit systems, headway of ten minutes or less is deemed acceptable [11]. Extreme variation in headway could result in bus bunching and the use of more vehicles to serve the same number of passengers. The variability of service and its effect(s) on traveler behavior may also be used to gauge service reliability [12]. In order to provide reliable service, transit vehicles need to be on schedule while maintaining pre-determined headways and minimizing the variance of passenger expectations [13]. Transit providers generally make decisions on on-time bus arrival time ranges in order to classify a service as reliable or unreliable. These ranges are generally based on the level of service the transit operator can cost-effectively deliver, while satisfying customer expectations. Patrons on low-frequency service routes often use posted schedules and personal experience at the stops to plan their arrival time at the stops and determine their expected wait time. Passengers on high-frequency routes generally assume some randomness in arrival times, since they typically have little confidence in the posted schedule, and already know that their waiting time would be low. With input from the public or government agencies, transit providers often provide a range around the scheduled time within which the transit bus is considered to be on time. Generally, the on time range depends on the type of route, scheduling practices and location on the route. For low-frequency service routes, where on time performance is critical to patrons, schedule deviations should be minimized, since they affect passenger wait times. Thus, transit service providers often specify the deviation in minutes from scheduled arrival time. Arrivals within the deviation limits are considered “on time.” The extent of the deviation is often dictated by scheduling practices, travel time variability, and customer expectations [14]. Passengers on high-frequency routes generally prefer minimizing schedule deviations at bus stops. The general literature reviewed showed that most transit agencies use a 1 minute early to 5 minutes late range for on time performance [15]. This range is used for regional bus service in Seattle, San Mateo, Oakland, BART, Portland, and Connecticut, among others. One of the strictest on-time ranges is used by San Francisco’s Muni that requires all buses to arrive no earlier than 1 minute before and no later than 4 minutes after the scheduled arrival time, with a voter-mandated on-time performance goal of 85%.
4. Research Methodology
4.1. Study Corridors
Fifteen transit bus corridors, which are representative sample of the transit bus system in the District of Columbia metropolitan area, were selected for this study. The bus routes also have published bus stop arrival times, and adequate gaps between bus stops for onboard data collection. The corridors were as follows:1. Ballston-Farragut Square (Line 38B)2. Rhode Island Avenue-New Carrollton (Line 84)3. Brookland Potomac Park (Line H1)4. Garfield Anacostia Loop (Line W6)5. 14th Street (Line 53)6. Sheriff Road-Capitol Heights (Line F14)7. Mayfair-Marshall Heights (Line U6) 8. North Capitol Street (Line 80) 9. Rhode Island Avenue (Line G8)10. Capitol Heights-Benning Rd (Line U8) 11. Pennsylvania Avenue (Line 36)12. Crosstown (Line H4)13. Connecticut Avenue (Line L2)14. 16th Street Limited (Line S9)15. Benning Road H Street Express (Line X9)
4.2. Data Collection
Actual bus arrival times at each bus stop were obtained by manual onboard recording at the selected bus stops on weekdays over one-year duration (June 2012 - June 2013). A previously prepared data recording sheet was employed. The information gathered include the route name, bus stops name, date, time, scheduled arrival times, blank spaces for entering actual arrival times at bus stops, the name of the recorder, and the start and end times of the observations. For each route, the inbound and outbound arrival times at each bus stop were recorded while on board the bus for morning (AM: 7:00 am to 9:30 am) and evening (PM: 4:00 pm to 6:00 pm). Thus, each data collection technician rode the bus inbound, recording the actual arrival times for the selected bus route, and did the same for the outbound route. The data collection effort was aborted in cases of traffic accidents or incidents, adverse weather conditions, or other unforeseen circumstances that could result in excessive delays. In all, 2,220 arrival times of buses at 148 bus stops were documented. The survey forms were returned and reviewed, after which the data was extracted for analysis.
4.3. Data Reduction, Statistical Analyses and Hypothesis
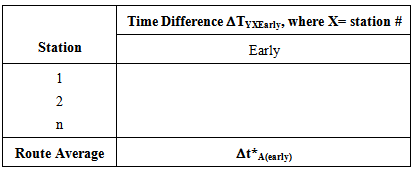
The arrival times were compared with the scheduled arrival times at each bus stop for each route. Bus arrivals between two minutes early and seven minutes late (according to the advertised scheduled arrival times) were considered “on time.” Actual deviations from the advertised scheduled arrival times were computed for each bus stop and classified as either “on time” or “not on time.” The overall mean deviation of actual arrival from the scheduled arrival time was computed and used to determine the reliability of the measured bus arrival times, using a 95% confidence level. General trends in scheduled arrival times at each bus stop for both inbound and outbound routes in each corridor were also analyzed.If the early arrival time of Bus Y on corridor A at bus stop #1 is T1 (and T2 is the scheduled arrival time), then the deviation in early arrival time, ΔTYxEarly, (where X=1, 2, 3,…n, denote the bus stop numbers) at station X can be calculated by: 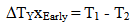 | (1) |
For the entire period of the data collection, n data points of the parameter ΔTYxEarly were deduced for the same corridor Y from which the average for “early” arrivals was computed. For each bus, the following information was then determined for each corridor. Table 1 presents a typical data summary for early arrivals for Bus Y on a corridor.Table 1. Typical Data Summary for Early Arrivals for Bus Y on Corridor A
 |
| |
|
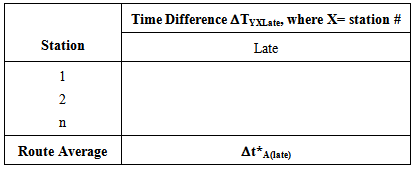
Similarly, the same data was compiled for “late” arrivals outside of the advertised scheduled arrival times, the sample of which is presented Table 2.Table 2. Typical Data Summary for Late Arrivals for Bus Y on Corridor A
 |
| |
|
WMATA considers a bus to be on time if the bus arrives between 2 minutes earlier and 7 minutes later than the scheduled arrival time. Therefore, a bus will be considered “not on time” when it arrives earlier than 2 minutes before the scheduled time or later than 7 minutes after the scheduled arrival time. These can be expressed mathematically as: | (2) |
 | (3) |
where ∆tE and ∆tL are the respective average early and late deviation times from the advertised schedules. Due to the small number of corridors used in this study (n = 15), the Students’ t-test was used to test the hypotheses (2) and (3) at 5% level of significance, with the assumption that the sample is normally distributed. The test was conducted for both the inbound and outbound routes of the same corridors. A p-value is the probability that a given random variable of a summary statistic is larger in magnitude than an observed value of that statistic. Based on a one-tailed test at 5% significance level, we fail to accept the null hypothesis (Ho) if the associated p-value of the computed Students’ t-statistic was less than 0.05. A similar analysis was conducted based on the commonly used on time arrivals of 1 minute early to 5 minutes late. The hypothesis for that is presented as follows: | (4) |
 | (5) |
5. Results
5.1. Average Percent of on Time Arrivals at Bus Stops
The summary of the average percent of on time arrivals at each bus stop for each bus route was tallied and summarized as a percentage of the total number of arrivals in Table 3 for AM and PM. The summary is based on both WMATA’s 2-minute early to 7-minute late arrival range, and the 1-minute early to 5-minute late arrival range, preferred by most transit agencies. Table 3. Average Percent of On time Arrivals for AM and PM Travel on Routes
 |
| |
|
For the two-minutes-early to seven-minutes-late window of the scheduled arrival times, overall, the mean on time arrival at the bus stops on the selected routes was 82% in the morning and 68% during the afternoon travel periods. WMATA’s goal of achieving at least 78% on time bus arrivals was met during morning transit service, generally, but was woefully lacking during evening operation. Overall, the on time performance for the buses was determined to be 75%, on average. When the 1 minute early to 5 minutes late range was considered, the mean on time arrival at the bus stops on the selected routes was 67% in the morning and 55% in the afternoon travel periods. Overall, the average on time performance was 61%.
5.2. Average Deviations from Schedule Arrival Times
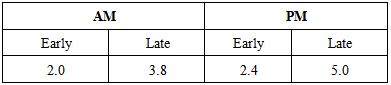
Table 4 shows the summary of the average deviation (in minutes) of arrivals before and after the scheduled arrival times along each route for the inbound and outbound travel for both the morning (AM) and evening (PM) travel. These deviations represented the difference between the actual and scheduled arrival times. The early arrival time differences were separated from the late arrival times after which the mean for each group was computed.Table 4. Mean Deviations (Minutes) from Scheduled Arrivals at Bus Stops
 |
| |
|
The table shows that the overall mean early arrival deviation times for the morning and afternoon travel were respectively 2.0 and 2.4 minutes while those for the late arrivals at the bus stops were found to be 3.8 and 5.0 minutes.
5.3. Results of Tests of Hypothesis
The student’s t-statistic and associated p-values were computed based on the one-tail hypothesis test for the hypotheses previously described. Based on the one-tailed test at 5% significance level, we fail to accept the null hypothesis (Ho) if the associated p-value of the computed Students’ t-statistic is less than 0.05. The null hypothesis represents either -2 ≤ Δt ≤ 7 for WMATA’s on-time arrival and -1 ≤ Δt ≤ 5. The summary of the statistical analyses is presented in Table 5. Table 5. Statistical Significance of Mean Arrival Deviations
 |
| |
|
From the table, during the AM travel, on average only 35% of the bus stops were determined to be statistically within WMATA’s on-time arrival range. In addition, only 17% were statistically within the on-time arrival range when the 1 minute early and 5 minutes late range was considered. Similarly, for the PM travel, on average, the percentage of bus stops that were determined to be statistically significant were 24% and 20% for the -2≤ Δt ≤ 7 and the -1≤ Δt ≤ 5 respectively.
6. Discussions
Passengers generally tend to gauge the reliability of buses using scheduled arrival times at bus stop. When considering WMATA’s “on time” arrival range of 2 minutes-early and 7-minutes late within the advertised scheduled arrival times, the results of the analysis showed that, on average, the buses generally arrived on time at the bus stops on the routes selected approximately 82% of the time in the morning and 68% during the afternoon travel periods. This results in an overall average of 75% on time arrivals at the bus stops, which is 3% below WMATA’s goal of 78%. On the other hand, these on time percentages decreased to 67% and 55%, respectively, for the AM and PM travel when the on-time of 1-minute-early to 5-minutes-late was considered, which resulted in an average of 61% on time performance. Each route showed a combination of early and late arrival percentages that were not consistent. The results from this study showed that the routes exhibited a combination of higher or lower early or late arrivals. The potential for late or early arrival of buses could be attributed to several factors discussed in the literature, which may include congestion, and spillover traffic.From the results, the overall mean early arrivals for morning and evening travel periods were determined to be 2.0 and 2.4 minutes, respectively. This shows that WMATA’s range of the 2-minutes early arrival is generally met only during the morning travel. Neither the AM nor PM travel met the 1-minute early arrival range. Similarly, the mean late arrival deviations, on average, were found to be 3.8 and 5.0 minutes for the AM and PM travel, respectively. These average deviations meet WMATA’s 7-minutes late arrival range. The statistical significance of the mean arrival deviations were also tested at 5% level of significance. This study tested the significance of the hypothesis that the buses will arrive within WMATA’s 2-minutes early and 7-minutes late range. Using a one-tailed test at 5% significance level, this assertion could not be rejected for 35% of the bus stops in the morning and 24% for the evening travel. The corresponding assertion for the bus stops were lower (17% for AM and 20% for PM) when the 1-minute early and 5-minutes late arrival range was considered. Overall, on average, only 29% of the bus stops satisfied the hypothesis based on WMATA’s arrival on-time arrival range, while only 18% of the bus stops were statistically significant based on the -1≤ Δt ≤ 5, at 5% level of significance.
7. Conclusions and Recommendations
Only one of the several factors used to measure bus transit reliability was tested. It has been recognized that transit on-time arrival performance and travel time reliability may have a significant impact on the attractiveness of transit to many current and prospective riders. In addition, transit agencies are continually working to keep the current as well as attract new ones. From the results, considering WMATA’s on-time arrival range at bus stops, the buses were found to be generally on time on average 75% of the time during the AM and PM travel. However, on average, only 35% met the statistical test (using 5% level of significance) during the AM travel, and 24% during the PM travel. When the -1≤ Δt ≤ 5 arrival range was considered, the buses were found to be on time 61% of the time, on average, for both AM and PM travel, of which only 17% (on average) statistically met the criteria in the morning. In the evening, 55% of the buses were considered to be on time; however, only 20% of those (on average) statistically met the criteria. Overall, on average, 71% of the bus stops failed to statistically meet WMATA's range, and an even higher percentage (82%) did not meet the -1≤ Δt ≤ 5. Based on the representative bus routes studied, the deviation observed for arriving before the scheduled times averaged 2.0 to 2.4 minutes (2.2 minutes on average). The equivalent deviation for arriving late ranged from 3.8 to 5.1 minutes (4.5 minutes on average). From these results, it would appear that WMATA’s performance is close to that used by most transit agencies. The following recommendations are provided based the results and field observations:• Consider adopting the -1≤ Δt ≤ 5 on-time arrival range of the advertised schedules to bring WMATA’s transit system in line with most transit agencies. • Scheduled arrival studies should be conducted periodically on additional representative bus routes. The results should be used for schedule adjustment and monitoring progress toward the generally used on-time arrival range.If available, Automated Vehicle Location (AVL) System data should first be validated and used periodically to capture the reliability performance of transit buses in Washington DC.
ACKNOWLEDGEMENTS
Appreciation is extended to the Mineta Transportation Institute (San Jose University) for funding this study as part of the U.S. Department of Transportation University Transportation Research Centers Program.
References
| [1] | J. Neff and L. Pham, “A Profile of Public Transportation Passenger Demographics and Travel Characteristics Reported in On-Board Surveys,” May 2007,http://trid.trb.org/view.aspx?id=839606. |
| [2] | Y. J. Nakanishi, “Bus Performance Indicators: On-Time Performance and Service Regularity,” Transportation Research Record: Journal of the Transportation Research Board 1571, no. 1, pp. 1-13, 1997. |
| [3] | V. R. Vuchic, Urban Transit: Operations, Planning and Economics: Wiley, 2005,http://sutlib2.sut.ac.th/sut_contents/H100154.pdf |
| [4] | M. Hammerle, M. Haynes, and S. McNeil, “Use of Automatic Vehicle Location and Passenger Count Data to Evaluate Bus Operations,” Transportation Research Record: Journal of the Transportation Research Board 1903, no. 1, pp. 27–34, 2005. |
| [5] | H. S. Levinson, “The Reliability of Transit Service: An Historical Perspective,” Journal of Urban Technology 12, no. 1, pp. 99–118, 2005. |
| [6] | T. J. Kirnpel, “Time Point-Level Analysis of Passenger Demand and Transit Service Reliability” 2000,https://www.pdx.edu/sites/www.pdx.edu.cus/files/DP00-5.pdf. |
| [7] | M. P. Boilé, “Estimating Technical and Scale Inefficiencies of Public Transit Systems,” Journal of Transportation Engineering 127, no. 3, pp. 187–194, 2001. |
| [8] | G. Chang and H. S. Mahmassani, “Travel Time Prediction and Departure Time Adjustment Behavior Dynamics in a Congested Traffic System,” Transportation Research Part B: Methodological 22, no. 3, pp. 217–232, 1988. |
| [9] | H. S. Levinson, “Supervision Strategies for Improved Reliability of Bus Routes,” NCTRP Synthesis of Transit Practice no. 15, Sept. 1991,http://trid.trb.org/view.aspx?id=359865. |
| [10] | C. Chen, A. Skabardonis, and P. Varaiya, “Travel-time Reliability as a Measure of Service,” Transportation Research Record: Journal of the Transportation Research Board 1855, no. 1, pp. 74–79, 2003. |
| [11] | Chicago Transit Authority, “Survey Reveals CTA Customer Satisfaction Remains Steady,” 2004,http://www.transitchicago.com/news/archpress.wu?action=displayarticledetail&articleid=109253. |
| [12] | Transit Capacity and Quality of Service Manual, Transportation Research Board, 2003. |
| [13] | H. P. Benn (1995), “Bus Route Evaluation Standards,” TCRP Synthesis of Transit Practice no. 10,http://trid.trb.org/view.aspx?id=426098. |
| [14] | A. K. Boame, “The Technical Efficiency of Canadian Urban Transit Systems,” Transportation Research Part E: Logistics and Transportation Review 40, no. 5, Sept. 2004: 401–416, doi:10.1016/j.tre.2003.09.002. |
| [15] | A. M. El-Geneidy, J. Horning, and K. J. Krizek, “Analyzing Transit Service Reliability Using Detailed Data from Automatic Vehicular Locator Systems,” Journal of Advanced Transportation 45, no. 1, pp. 66–79, 2011. |
 Abstract
 Reference
 Full-Text PDF
 Full-text HTML