Jimoh Y. A., Itiola I. O., Adeleke O. O.
Department of Civil Engineering, University of Ilorin, Ilorin, Nigeria
Correspondence to: Itiola I. O., Department of Civil Engineering, University of Ilorin, Ilorin, Nigeria.
| Email: |  |
Copyright © 2014 Scientific & Academic Publishing. All Rights Reserved.
Abstract
Effective management of urban congestion derives directly from accurate data collection and analysis at intersections. This study reports the outcome of a comparative investigation of the cost and efficiency of electronic and manual methods of collection of traffic delays for an urban rotary with the purpose of selection of the most preferred strategy for measurement at junction delays. The operation of traffic at peak period at Tanke roundabout Ilorin, Nigeria was evaluated with observatory (manual) and video-graphic for the data capture and analysis. A Sony video-graphic digital camcorder, type GIF, and full size image (460329) was used to collect data on the flow rate and pattern operation at typical morning and evening peak periods, the data were analysed with corresponding cost, accuracy, easiness and convenience. Three improvement options; geometry modification to 2-lane on all the legs, 2-4 phase traffic signalization alone and geometry modification plus 2-phase signalization, were evaluated for a probable level of serviceability for the junction. The roundabout presently operating at LOS F respectively improved to LOS C for the geometry modification, the 2-4 phase fixed traffic signalization; but LOS A for the combined geometry/2-phase signalization strategy. The cost of data capture was ₦8,700 for the time lapse videography and ₦11,000 formanual method which implies that the video-time lapse data capture and analysis was 26% cheaper than the manual observatory counting method, and thus recommended as preference for an urban rotary delay management.
Keywords:
LOS, Flow rate, Traffic signalization, Traffic delay, Rotary junction and geometric features
Cite this paper: Jimoh Y. A., Itiola I. O., Adeleke O. O., Traffic Performance Analysis and Cost Comparison of Data Collection Methods for an Urban Rotary, International Journal of Traffic and Transportation Engineering, Vol. 3 No. 5, 2014, pp. 222-231. doi: 10.5923/j.ijtte.20140305.03.
1. Introduction
Among the preferred potential alternatives to traffic control signals at traffic intersections is the rotary, probably because it assures of better benefits, MUTCD (2003) and FHWA (2003). However, improvement of the operation at rotary intersection can offer safety and better management of the probable congestion and delays in terms of accuracy, efficient and cost-effectiveness data capture throne as first direct step. Most of the times, traffic streams at junctions and at peak periods operate at forced flow, low speeds and traffic grid lock at the roundabout, especially when capacity is being impacted into considerable challenging and negative effects which cannot be solved by the traffic rules alone. Proper congestion management to ensure efficient movement of people, goods and services, strong economic and political ties between regions and eventual regional transport development is much desired (Onakomaiya and Ekanem, 2007); which is both dependent on traffic signalization control and facility capacity modification. Traffic data capture with observatory manual approach has some inherent problems, because at peak period, it is highly probable for an enumerator to (i) count one vehicle twice and or inadvertently omit vehicles in a traffic stream, and (ii) incorrectly determine the timing of the ¼ hour counting period due to overwhelming volume of traffic to be surveyed. Thus, a computer-driven approach for the quantification of the traffic congestion and other parameters at a grid lock-up traffic rotary may be more preferred, if appropriately quantified with an automatic approach.The aim of this study was therefore to develop a comparative analysis of the cost of manual and e-driven strategies for data collection and analysis of junction delays with the purpose of determining the better choice for data management for urban congestion in a developing nation. The objectives included the:(i) determination of the quantitative effect on the operation of introduction of changes to the geometric features of an urban rotary. (ii) establishment of traffic operating parameters at typical morning and evening peak periods with the manual observatory counting method at the Tipper junction, Ilorin Nigeria. (iii) establishment of the corresponding prevailing traffic parameters using the video-graphic (digital) data capture. (iv) computation of the cost for each method of data collection at the study urban traffic rotary intersection. (v) design of the traffic signalization phasing that would improve the LOS to desirable level of urban traffic, and hence (vi) choice of the relatively more economical method for data collection at the urban traffic rotary between the manual observatory and the video time-lapse method.
2. Materials and Methods
2.1. Study Rotary Description and Geometry
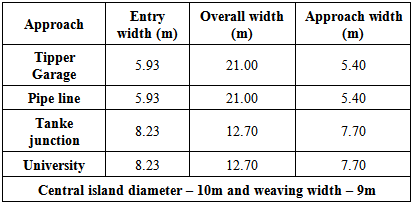
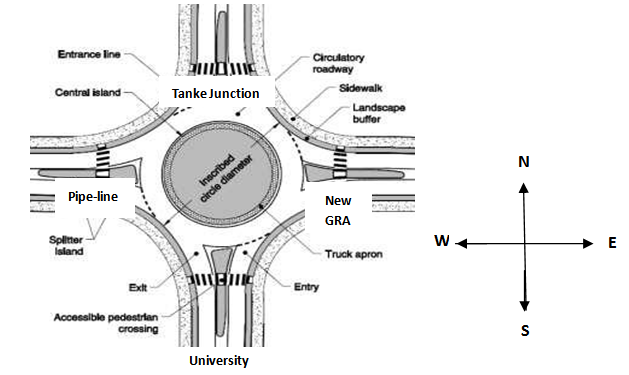
The study intersection is the Tanke tipper garage roundabout Ilorin; Kwara State, Nigeria. It is a rotary intersection consisting of four 2-lane dualized legs, namely University Approach, Tanke junction Approach, Pipeline Approach and New GRA Approach, while the fifth is a small appendage to the pipeline whose traffic is extremely insignificant. Table 1 presents the inventory of the various geometric features, while fig 1 gives the corresponding layout.Table 1. The inventory of various features of Tanke rotary
 |
| |
|
 | Figure 1. Layout of Tanke Roundabout |
2.2. Study of Traffic Operational Parameters at Tanke Tipper Rotary
2.2.1. Manual Data Collection
Prior to the commencement of data collection, a suitable location (spot) at Tanke Tipper garage roundabout was identified for the manual counting that ensures adequate protection against disturbances from vehicles passing-by during the manual counting and traffic movement. Two traffic enumerators were placed on each of the four approaches to count and record for every 15minutes, the number of vehicles passing and those that are turning left, turning right and through traffic for each respective approach simultaneously at the usual traffic peak periods of 7-9am (morning) and 4-5pm (evening). The data were captured on Monday [05 – 03 – 2012] for a typical weekday and Saturday [12 -03 – 2012] for typical weekend. The eight (8) observers were each provided with a stop watch and writing materials. Table 2 presents the traffic movement patterns for the two hours for the four approaches of New GRA, University, Pipeline and Tanke Junction correspondingly.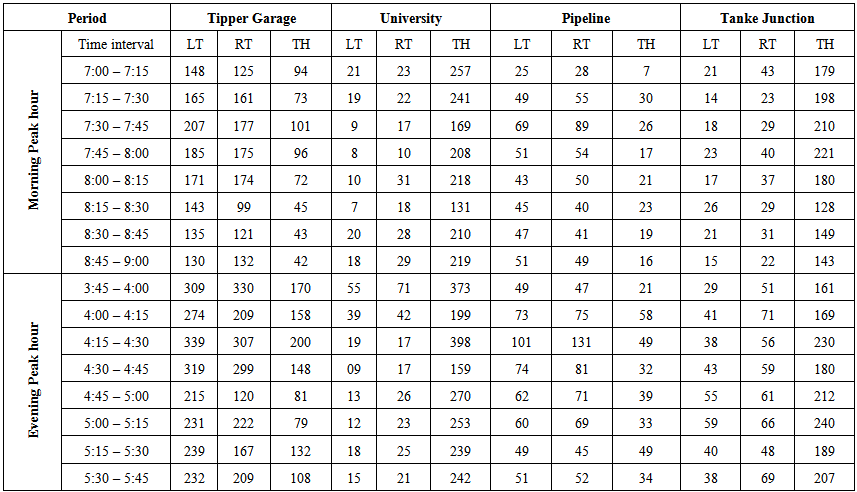 | Table 2. Morning and Evening Peak Hour Traffic Movements (veh) on the Approaches of the Roundabout |
2.2.2. Traffic Data Capture with Video Time Lapse Method
A Sony digital camcorder, type GIF, and full size image (460x329) with high quality resolution was set up at a selected location, ensuring that disturbances by vehicles passing-by during the coverage of the roundabout traffic movement were appreciably reduced. To ease the video coverage and ensure high accuracy of data collection, the Sony camcorder was set – up on a tripod stand on the top of a building complex (Dulex complex) about 10meters to the roundabout. Plates 1-4: show the video time lapse captured images of traffic movement at the intersection legs. The video coverage and the manual counting were done simultaneously.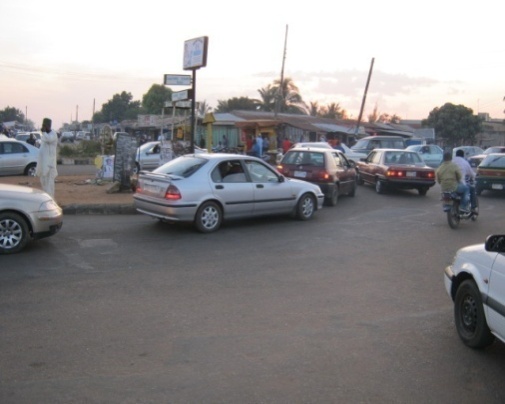 | Plate 1. Video image of traffic at New GRA approach |
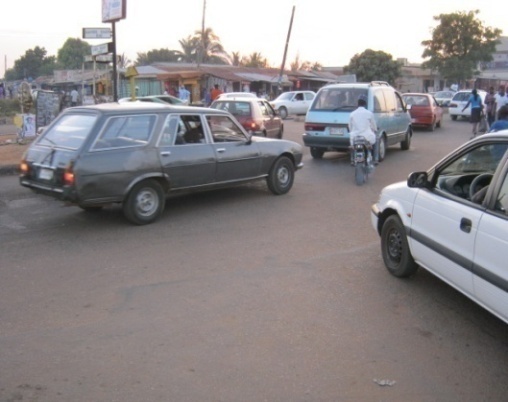 | Plate 2. Video image of traffic at Pipeline approach |
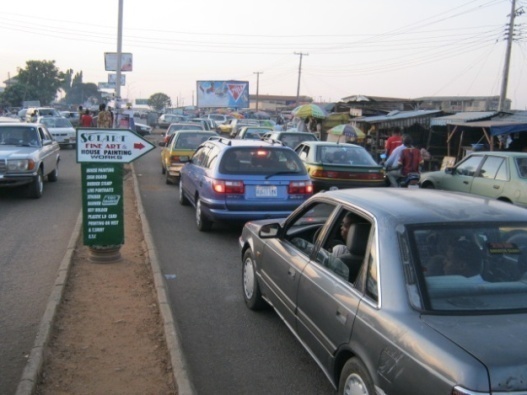 | Plate 3. Video image of traffic at University approach |
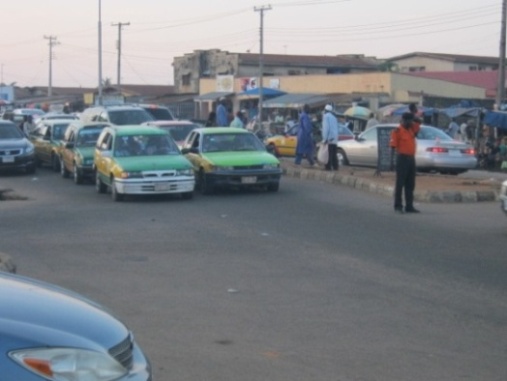 | Plate 4. Video image of traffic at Tanke Junction approach |
Traffic data was generated from the recorded video traffic scenarios for every 1/4hr with initiation of the play, pause, forward, rewind, and stop features of the audio-visual functions. The traffic volume with corresponding movement patterns were noted and transcribed on a specially prepared sheet. Tables 3-10 present the summary of the generated traffic movement pattern at the various legs for the typical weekday peak.
3. Results and Analysis
3.1. Geometry and Capacity of Tanke Intersection
Using the Transportation Research Laboratory capacity model (equations 1 and 2; Kimber, 1980) and the geometry of the intersection (Table 1), the capacity intersection (Q) and practical capacity (QP) of the Tanke small rotary was computed. | (1) |
 | (2) |
Where Q = capacity of the whole intersection (Vph),  = Sum of basic road widths (not half widths) used by traffic in both directions to and from intersection, (m), A = Area of junction widening; i.e., the area within intersection outline which lies outside the area of the basic cross roads (m2), and K is efficiency coefficient which depends on site conditions, taken as 70 for the four legged intersection. Also with the modification of the present one-lane geometry of all the legs of the rotary intersection to 2-traffic lanes in the ratio of 1:1.5, the existing and new proposed capacity of the Tanke roundabout were Q = 4969Vph, and
  = 4224vph and 6676vph respectively.
3.2. Computation of Traffic Operating Parameters from Manual Data
The operating characteristics considered relevant for the junction include the circulating volume (F), maximum flow (FMAX), degree of saturation (S), mean delay for each leg (di) and whole intersection and respective delay queue length (Lqi). These parameters were computed with equations 3-8 and the results summarized in Tables 3 and 4 respectively for manual and video data capture. | Table 3. Summary of the operating traffic parameters for manual method |
 | Table 4. The Summary of the operating traffic parameter for video-time lapse capture |
 | (3) |
Where FTG is the circulatory volume for Tipper garage approach; VEBTH is the east bound through entry volume; VEBLT is the east bound left turn entry volume; VSBLT is the south bound left turn entry volume | (4) |
TRRL (1980) model for a two-lane approach | (5) |
 | (6) |
Where T= 0.25, VX=1184vph and FMAX=1574vph during the morning peak period. | (7) |
đ= Average control delay for junction (sec/veh); Vi= Flow rate for movement (veh/sec) | (8) |

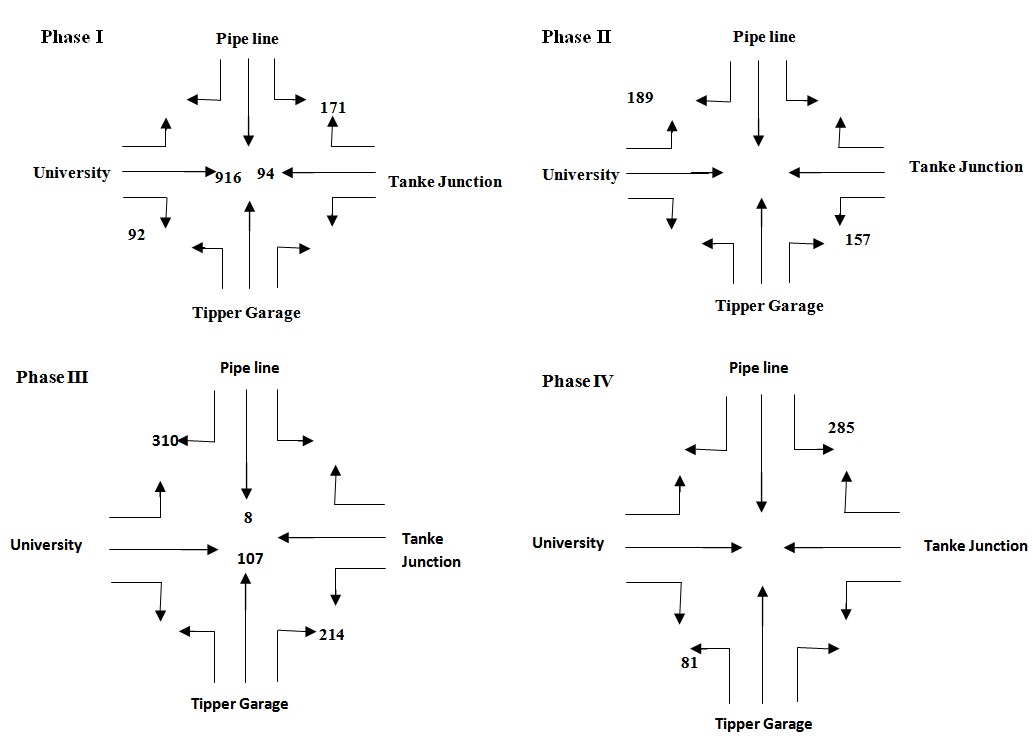 | Figure 2. Schematic diagram showing traffic turning movements and adjusted volumes for 4-phase signalization at Tanke roundabout (7-8am) |
3.3. Design of a 4-Phase Traffic Signal for Tanke Rotary
The saturation flow rate is the flow in vehicles per hour that can be accommodated by the lane group assuming that the green phase were displayed 100 percent of the time (i.e., g/Co = 1.0). Using the video data, the saturation flow rate prevalent for each lane group was computed as enumerated in Table 5 and used for the development of the signal phase scheme.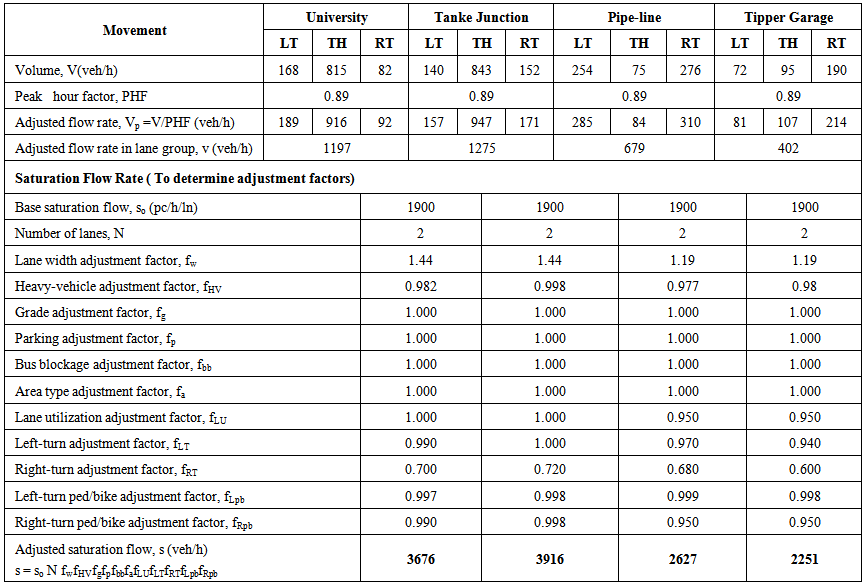 | Table 5. Volume adjustment and saturation flow rate parameters |
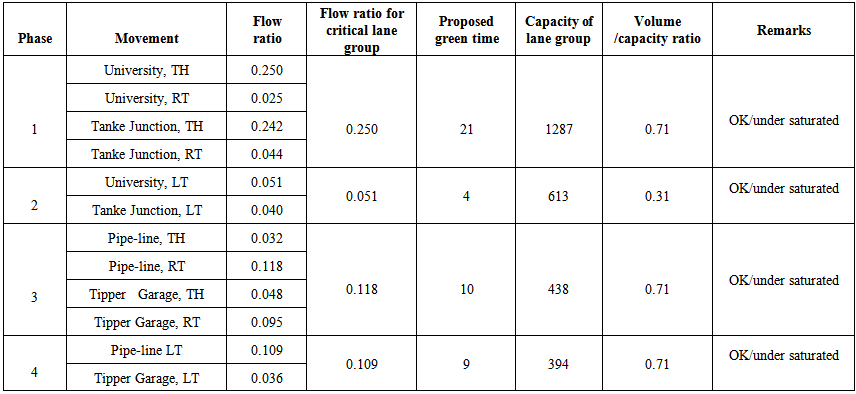 | Table 6. Signal phase, Effective green time, Lane group capacity and Remarks |
 | Table 7. Level of service for proposed 4-phase signalization scheme |
The Optimum Cycle length  Critical v/c Ratio(XC) and the signalized control delay were determined with equations 9-17. The optimum cycle length (Co) was expressed using Eq. 10 (Kadiyali, 2005), and the prevailing LOS established according to the computed delay based on the provisions of HCM (2006). The intersection was determined using equation 15, 16 and 17 (HCM, 1994) and as adopted for similar analysis of an urban intersection in Ilorin city, Nigeria (Jimoh et al, 2012).
 | (9) |
 | (10) |
 | (11) |
 | (12) |
 | (13) |
 | (14) |
 | (15) |
 | (16) |
 | (17) |
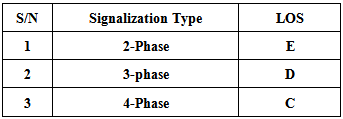
Where Vi =actual or projected demand flow rate for the lane group; Si=saturation flow rate, Y = Flow ratio for a given lane group; XC= critical v/c ratio for intersection; Y= summation of flow ratios for all critical lane groups i; C= cycle length (s); and Lq= total lost time per cycle, computed as lost time, (tL). Allocation of Green time (g), Capacity (C) and Volume/Capacity ratio (X) determination, d= control delay per vehicle (s/veh); d1= uniform control delay assuming uniform arrivals (s/veh); PF= uniform delay progression adjustment factor, which accounts for effects of signal progression; d2= incremental delay to account for effect of random arrivals and oversaturation queues, C= Cycle length in seconds; G = Effective green time for lane group in seconds; X = Volume Capacity (v/c) ratio for lane group; T= Duration of analysis period in h; K = Delay adjustment factor that is dependent on signal control mode; I= Upstream filtering/metering adjustment factor; c = lane group capacity, in veh/hr; PF = progression factor. For pre-timed control and for situation where there is no initial queue at the beginning of the analysis period, PF = 1.0, K = 0.5, i = 1.0, d3= 0.The weighted average control delay for the whole intersection (using equation 7), was developed and used to establish the prevailing LOS.The average control delay for the intersection, d is 26sec/veh which imply that the whole intersection is operating at LOS C. the 2 and 3-phase signalization were designed and the probable LOS similarly determined.Table 8 gives the summary of the signalization types according to their LOS for the Tanke roundabout without any geometric improvement and the design of a 4-phase traffic signal is used as a sample for the other signalization types (2-phase and 3-phase).
3.4. Design of Proposed Phase Plan for 2-phase Traffic signal with Geometry Modification
It is obvious from table 8 that the Tanke tipper garage rotary intersection, Ilorin is tolerable at 3 or 4 phases (LOS D & C) for an urban traffic. The volume-capacity ratio is less than 1 for each of the phase while the 2-phase experience level of service E. However using 2-phase signal scheme and increased capacity gives a LOS C, details shown in Table 9.Table 8. LOS for signalization phase types (Morning)
 |
| |
|
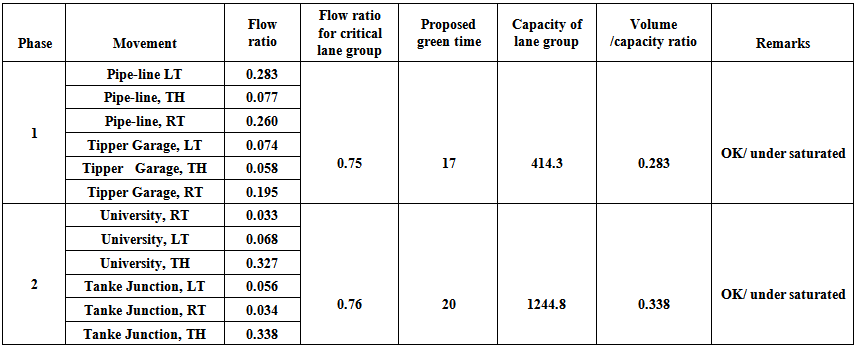 | Table 9. Signal phase, effective green time, capacity, lane group and their remarks |
The average control delay for the intersection, d is 7sec/veh which implies that the whole intersection is operating at LOS A for geometry modification to 2-lane with the 2-phase traffic signalisation.
3.5. Cost of Data Collection and Analysis
Another important factor in the decision making and/or effective data management is the cost element. Thus the amount of money spent on each of the two methods used for the determination of congestion at the rotary is estimated. The summary of the analysis is given in Table 11 and its unit costs are based on the prevailing economy in a typical Nigeria city in 2012.The data shows that the cost of operation of manual method of ₦11,400 is greater than that of the video-graphic method of ₦8,700, which means that the video time lapse is the cheaper method than the manual observatory counting method for the operational performance measurement of a roundabout.
4. Discussion of Results and Need for a Re-Design
4.1. An Evaluation of Effect of Proposed Geometric Elements on the Rotary Capacity
The New GRA and Pipe Line approaches have equal entry width of 5.93m, overall width of 21.0m and approach width of 5.4m while the Tanke Junction and University approaches have widths of 8.23m, but overall widths of 12.70m and 7.70m respectively. This geometric data gave the capacity of the roundabout to be 4224vph, and which linked up directly with the prevailing traffic to show that the intersection is under performing for V/C ≥ 1. The degree of saturation in terms of V/C ratios are greater than 1.0 on all the four legs. Besides the range of the width of the road carriageway in 3 of all the legs is less than the standard required for 2-lane carriageway width (2 x 3.6 = 7.2m) and allowance of 1.5-2.75 m for shoulders (7.2 + 2.7 ≈ 10 m),therefore the geometric element of the roundabout has to be increased for higher capacity. Hence a 1.5times more than that of the existing intersection geometry was proposed to ensure at least standard two traffic lanes plus 1.5m shoulder. Thus the New GRA and Pipe Line approaches will now have equal entry width of 8.9m, overall width of 31.5m and approach width of 8.1m while the Tanke Junction and University approaches have widths of 12.5m, but overall widths of 19.05m and 11.6m respectively. This geometric data resulted to standard 2-lane and new practical capacity for the Tanke roundabout of 6676vph. The corresponding v/c ratios for the manual and electronic morning period are 1.08 and 1.00 respectively, and at the afternoon period are 1.5 for both methods while the v/c ratio for the modified geometry are 0.68 and 0.47 (manual and electronic morning), 0.95 and 0.96 for the afternoon manual and electronic method respectively. When v/c ≥ 1, the operation of the roundabout will deteriorate rapidly, particularly over short periods of time and queues will form while delay begins to increase exponentially. Also when v/c ≤ 1, the operation of the rotary intersection is said to be satisfactory. Notwithstanding the 50% additional geometric modification, the four legged Tanke rotary intersection is still a small roundabout because of the existing central island diameter of 10m. The rotary is still a small rotary intersection because the proposed diameter is 15m which lies between 4 and 25m.
4.2. Traffic Operation at Tanke Tipper Rotary and Data Collection Method
Based on the data of Table 3 and 4, University and Tanke Junction approaches are corridors of heavily trafficked links since their entry flows (Itiola, 2012)each respectively exceeds 1000vph and also their circulating volumes exceed 1800vph for double lane roundabout. The outcome is incidentally the same pattern for both manual and video time lapse method of data collection as reflected in Table 11.The summary of the peak hour control delay for manual and video time lapse method for each of the approach of the Tanke Tipper Garage rotary intersection is displayed in Table 10 and 11 which showed that the lower the control delay, the lesser the delay and the queue length and vice-versa. Both methods can therefore be used to predict that the University, Tipper Garage, Tanke Junction and Pipe line should be addressed to have lower control delay respectively (7-8am and 4-5pm peak periods) in order to reduce the congestion at the intersection. The traffic performance evaluated for the two traffic peak hours showed that the evening rush hour is more critical for the analysis. The corresponding values of the parameters considered whether accessed with manual or electronic means gave higher magnitude during the evenings than the mornings. | Table 10. Level of service in terms of delay for proposed phase plan |
 | Table 11. Data Collection Cost Analysis |
 | Table 12. Summary of Manual and Electronic Method Peak Entry (Vi), Circulating (F) and Maximum (FMAX) Flows |
From table 12, it can be inferred that the rotary is more trafficked in the evening than in the mornings (514-2621 vehicles) as against (255-1844 vehicles) while the electronic method gave the same result as for manual method in a range (228-173 vehicles) and (458-2219 vehicles) respectively.
4.3. Comparison of LOS and Other Performance Parameter between the Methods
Since the values of the degree of saturation (v/c) for both method is greater than or equal to 1 and the control delay is also greater than 41sec/veh (Table 13), the Tanke roundabout is operating at LOS F. This implies that at the roundabout, forced flow takes place at this level of service (F), the speed would be low and volumes beyond the capacity of the roundabout. The results in Table 11 show that the values of the operating parameters of manual counting method values are greater than those for the time lapse video-graphic method, which may be due to some human errors earlier identified that might have occurred when carrying out the data collection with the manual method. Such errors that include the list below must be reasonably and likely addressed with the electronic approach adopted. The sources of the error are highly probably human driven which are:a) Improper 15-minutes timing by the person(s) counting the vehicle of each approach, andb) Counting of one vehicle twice and omission in the traffic stream.c) Drivers stopping unnecessarily at the yield point and within the circulating roadway.d) Vehicles passing on the wrong side of the central island.e) Queues from an external bottleneck backing up into the roundabout from an exit.f) Smaller vehicles encroaching on the truck apron.Table 13. The Summary of the outcome of manual and video-graphic method for other performance parameter
 |
| |
|
The time lapse video-graphic method takes care of these enumerated shortcomings of the miscounting with the play, pause, forward, rewind and stop features. These features eliminate improper 15-minutes timing and error due to human sense of sight, which might have led to counting of one vehicle twice in the traffic stream. Based on all the reasons adduced, the time lapse video-graphic method seems a better and more accurate method for the characterization of the operational performance of roundabouts. Undoubtedly both methods of analysis and data capture of traffic performance and operation are at same level of service.
4.4. Performance Improvement Strategy
It is obvious from the preceding sections that the Tanke tipper garage rotary intersection, is currently not operating efficiently. The volume-capacity ratio is greater than 1 for each of the approaches and with all the legs experiencing level of service F and the frustration being experienced by commuters at the junction seems justified. This observation warrants the need to improve the intersection. Three methods that may be feasible are the geometry, modification of the fixed facility rotary intersection, the introduction of traffic signalization or both the geometry plus the traffic signal at the intersection combined. Standard two traffic lanes for each leg were proposed which resulted in an increased capacity by percentage operation and from LOS F to LOS C-D with the introduction of a 1.5 factor to all the geometric dimensions of the junction. On the other hand, a 4-phase plan is proposed to replace the existing traffic rotary at the intersection, while a 2-phase along with the earlier geometry modification was considered. The LOS was much improved, LOS A-C on all legs (Table 10). Thus for the 3-option alternatives for the improvement strategic possibilities for the intersection, the geometry modification alone and the 2-phasetraffic signalization alone cannot appropriately address the under-performing rotary at the two peak periods for the fixed time traffic signalization scheme in the urban city.Table 14. The Summary of the outcome of operational parameters of modified geometry for the Tanke Rotary
 |
| |
|
5. Conclusions and Recommendations
Based on the results, the following conclusions and recommendation are drawn: i. The Tipper roundabout Ilorin, Nigeria is a small rotary, whose two out of the four legs are substandard two lane approaches. The other two legs are also marginally better thereby impacting under-performance of traffic at morning and afternoon peaks (LOS F).ii. Tanke tipper garage intersectiono perates at LOS F (according to TRRL, 1980) with degree of saturation (V/C ratio greater or equal to 1.0) and the average control delay of 66sec/veh. The volumes are beyond the capacity of the roundabout due to unsatisfactory geometric features causing forced flow, low speeds and traffic grid lock at the roundabout. iii. A proposed modification of the geometric element of the roundabout by 1.5-times permitted increased lane widths which gave higher capacity of 6676vph, lower V/C ratio and LOS D performance.iv. The circulating volume, entry flows, maximum flow and control delay on each approach determined by the video time lapse and manual method were approximately in the same neighbourhood. v. The video-graphic method of traffic operating data had a cost advantage of 30% over the manual which can therefore be considered to be more feasible in addition to other benefits for data collection and analysis for an urban rotary.vi. A 4-phase signalized traffic control scheme with an optimum cycle length of 60secs and average control delay of 26secs/veh would ensure an improved performance to LOS C from LOS F, andvii. Also, a 2-phase signalized traffic control plus the modified geometry of the roundabout (50%) gave an optimum cycle length of 45secs and average control delay of 7secs/veh implying improved performance of LOS C to LOS A.
References
| [1] | HCM (1994) Highway Capacity Manual. Special Report 209. National Academy of Science, Washington DC, USA. |
| [2] | Itiola I.O. (2012), Video Time-Lapse Data Capture and Computer Analysis of Traffic at Tanke Roundabout, Ilorin, Kwara state, Nigeria, B. Eng. Civil Project; pp. 1-62, Unpublished. Submitted to University of Ilorin, Ilorin. |
| [3] | Jimoh Y.A. and Adeleke, O.O. (2005): Potential Benefits of Intelligence Transportation System (ITS) in Nigeria, Journal of Research Information of Civil Engineering, 2(1): pp. 46-56. Dept. of Civil Eng., Univ. of Ilorin, Ilorin. |
| [4] | Jimoh Y.A., Adeleke O.O. and Afolabi A.A. (2012): An Evaluation ofthe Operation of a Fixed-Time Signalization Scheme for a FourLeg Intersection in Ilorin Metropolis, Nigeria. A Research Journal of Applied Sciences. Engineering and Technology 4(17): 2839-2845, ISBN: 2040-7467, Maxwell Scientific Organization, 2012. |
| [5] | Kadiyali, L.R. andLal, N.B. (2005): Principles and Practices of Highway Engineering: (Including Expressways and Airport Engineering), 4th Edition. Khana Publishers, Delhi,pp. 835. |
| [6] | Kimber, R.M. (1980): The Traffic Capacity of Roundabouts. TRRL Laboratory Report LR 942, Crowthorne, England. |
| [7] | MUTCD, (2003): National Manual on Uniform Traffic Control Devices for Street and Highway, Washington, D.C., USA. |
| [8] | National Research Council, 2006. Highway Capacity Manual, Washington D.C., pp. 27. |
| [9] | Onakomaiya, S.O and Ekanem, N.F. (1977): “Transportation in Nigeria National Development”. Proceedings of a conference held at the University of Ibadan, Ibadan, and July 4th-9th. |


 = Sum of basic road widths (not half widths) used by traffic in both directions to and from intersection, (m), A = Area of junction widening; i.e., the area within intersection outline which lies outside the area of the basic cross roads (m2), and K is efficiency coefficient which depends on site conditions, taken as 70 for the four legged intersection. Also with the modification of the present one-lane geometry of all the legs of the rotary intersection to 2-traffic lanes in the ratio of 1:1.5, the existing and new proposed capacity of the Tanke roundabout were Q = 4969Vph, and
  = 4224vph and 6676vph respectively.


 Critical v/c Ratio(XC) and the signalized control delay were determined with equations 9-17. The optimum cycle length (Co) was expressed using Eq. 10 (Kadiyali, 2005), and the prevailing LOS established according to the computed delay based on the provisions of HCM (2006). The intersection was determined using equation 15, 16 and 17 (HCM, 1994) and as adopted for similar analysis of an urban intersection in Ilorin city, Nigeria (Jimoh et al, 2012).


 Abstract
 Reference
 Full-Text PDF
 Full-text HTML


