Saravanan Gurupackiam1, Tahmina Khan2, Michael Anderson2, Steven Jones3
1Department of Civil Engineering, Penn State University, Harrisburg, PA 17057, USA
2Department of Civil and Environmental Engineering, University of Alabama in Huntsville, Huntsville, AL 35899, USA
3Department of Civil Engineering, University of Alabama, Tuscaloosa, AL 35487, USA
Correspondence to: Michael Anderson, Department of Civil and Environmental Engineering, University of Alabama in Huntsville, Huntsville, AL 35899, USA.
| Email: |  |
Copyright © 2014 Scientific & Academic Publishing. All Rights Reserved.
Abstract
Non-recurrent congestion (NRC) associated with special/unusual events in a community has the potential to cause greater levels of congestion than the typical morning and evening rush hour periods due to the unexpected nature of the congestion and uncertainty of the traffic volumes. Most of the previous research on recurrent and non-recurrent has focused on freeway conditions. This paper presents a brief examination of the impact of non-recurrent congestion along an arterial corridor as it related to data collected during an event. Lane-specific travel time and speed data were collected along a study corridor using probe cars with Global Positioning System receivers. General, route-level observation was not sufficient to identify the effect of non-recurrent congestion on any specific lane. Therefore, Detailed time of day data supported more detailed statistical analyses that showed differences in lane-specific travel times and speeds between the two congestion regimes. It is recommended that future research be conducted to validate the impact of the left turn lane storage length and left turn signal phasing during non-recurrent congestion events. Use of microscopic traffic simulation can be used to perform sensitivity analyses on a range left-turn scenarios (volumes, timing splits, lane lengths, etc.). The results support the need for detailed analyses of probable NRC traffic operations to ensure the most efficient outcomes possible for both RC and NRC in a given corridor.
Keywords:
Non-recurrent congestion, Corridor analysis, GPS
Cite this paper: Saravanan Gurupackiam, Tahmina Khan, Michael Anderson, Steven Jones, A Snapshot of Lane-specific Traffic Operations under Recurrent and Non-recurrent Congestion, International Journal of Traffic and Transportation Engineering, Vol. 3 No. 4, 2014, pp. 199-205. doi: 10.5923/j.ijtte.20140304.04.
1. Introduction
Congestion is a major source of discontent and frustration for urban and suburban dwellers. It leads to increased fuel consumption and vehicular emissions. Excessive delays in moving goods and people affect the local economy. The Urban Mobility Report 2010 by the Texas Transportation Institute indicates that about 439 urban areas in America are experiencing problems due to congestion and it is getting worse in regions of all sizes (Schrank and Lomax, 2009) [1]. The report states that as per 2007 data, congestion caused urban Americans to travel 4.2 billion hours more and to purchase an extra 2.8 billion gallons of fuel for a congestion cost of $87 billion per year (Schrank and Lomax, 2009) [1]. The notion of non-recurring congestion, or congestion that is derived from specific events not everyday peak period travel (i.e., rush hour), is not often considered in traffic modeling and engineering as these event happen infrequently. Nonetheless, non-recurring congestion can be a considerable burden on local infrastructure in areas where it occurs with some frequency. As such, non-recurring congestion can lead to strains on local transportation facilities and organizations (e.g., emergency and incident respondents, traffic management personnel). This paper presents a detailed examination of the impacts non-recurring congestion has on traffic speeds along a congested suburban arterial.The study corridor, McFarland Boulevard, is located in Tuscaloosa, Alabama. Tuscaloosa has some 93,000 inhabitants representing roughly half of the population (194,000) of the surrounding county. It is the home to the University of Alabama, Stillman College, Shelton State Community College, and several large hospitals. The community experiences significant non-recurring congestion due to seasonal fluctuations in the local student population and major university-related events (sporting, graduation, etc.). The roadway infrastructure is designed to account for typical directional design hourly volumes associated with recurrent congestion. The current study compared traffic operations during events of non-recurring congestion to those observed during episodes of recurrent congestion to identify potential underlying differences that might affect system performance. Specifically, an understanding of lane specific differences in traffic operations under different congestion regimes may shed light on the delays due to spillback from left/right turn bays. This is turn can help the transportation engineers to arrive at solutions to better manage traffic e.g., signal timing) for both recurrent and non-recurrent congested conditions.
2. Literature Review
Congestion can be broadly divided into recurrent and non-recurrent based on its source. Recurrent congestion (RC) refers to congestion caused by routine traffic volumes on a normal day. In a normal day recurrent congestion occurs during peak hours of commuting in the morning, evening, and sometimes even in the mid day. This type of congestion recurs every day and hence the name. Non-recurrent congestion (NRC) can be defined as unexpected or unusual congestion caused by an event that was unexpected and transient relative to other similar days. Non-recurrent congestion is caused by factors that change the normal traffic operations. Incidents, special events, roadwork construction/maintenance, bad weather etc., are the main factors that cause non-recurrent congestion. Federal Highway Administration states that non-recurrent congestion constitutes more than 50% of the congestion throughout the nation (FHWA, 2009) [2]. Liu et al. (2013) [3] reported that NRC comprised some 60% of total freeway congestion in the U.S. While earlier studies have focused on the changes in traffic operations and driver behavior due to congestion in general, they did not distinguish congestion as recurrent or non-recurrent type. According to a research study conducted by Hallenbeck et al, (2003) [4], RC is caused by routine traffic volumes operating in a typical environment. In essence, this definition was grounded in the concept of “expected congestion” if no “unusual circumstances” occurred. Routine operating conditions was defined as the median operating condition for that time and location on the road network. They were obtained from percentage of lane occupancy, vehicle volume, and speed. A 5% change in the routine operating conditions of that part of the day under consideration was classified as non-recurring congestion. Bremmer et al. (2004) [5] defined RC as relatively predictable congestion caused by routine traffic volumes operating in a typical environment and NRC as unexpected or unusual congestion caused by unpredictable or transient events such as accidents, inclement weather, or construction. Finally, Dowling et al. (2004) [6] describe NRC as that amount of delay to the traveling public that is caused by: incidents (including collisions, breakdowns, and debris), work zones, special events, and/or inclement weather and recurrent congestion is any observed delay that was not caused by the above factors. Recurrent congestion was estimated using Highway Capacity Manual speed-flow curves and data on facility demands, free-flow speeds, and capacities. Non-recurrent congestion was estimated based on frequency of occurrence and estimates of capacity reductions during periods of bad weather and work zone activity. There are numerous examples in the literature of research aimed at specific congestion types (e.g., Srinivasan et al., 2000 [7]; Bremmer et al., 2004 [5]; Dowling et. al., 2004 [6]; Guner et al., 2012 [8]; Jin et al., 2012 [9]; Ossenbruggen at al., 2012 [10]; Li and Chen, 2013 [11]; Liu et a. (2013) [3]). Others have attempted to characterize RC and NRC using field observations such as application of travel time prediction, dynamic routing, etc. (e.g., Loustau et al., 2010 [12]; Chung and Recker, 2013 [13]). Most of the previous research on RC and NRC characterization, however, has focused on freeway conditions. Important exceptions include the work of Sheu et al. (2004) [14] and Sheu (2013) [15] that proposed lane-specific models for predicting traffic operations associated with lane-blocking incidents. Lu and Chang (2012) [16] proposed a stochastic model for estimating arterial travel times during RC and NRC and validated the model using field observation data.The current paper reports on a very specific aspect (i.e., lane-specific travel times) of RC versus NRC operations. It is a snapshot of data taken from a single study corridor. As such, it intended to add to the limited amount of congestion characterization research focused exclusively on non-freeway operations.
3. Data Collection
Travel time runs, speed, volume counts, and driveway counts during different periods as given in Table 1 were recorded in such a way to define the type of congestion for the following study area or the selected roadways (shown in Figures 1 and 6). The August 2010 data represent a three days (3 – 5 August) of recurrent congestion. This data was collected when there were no special events and prior to the local university student population returning for the new school year. The November data are pm peak runs for normal recurrent congestion (16 – 17 November) and NRC associated with a Thursday night (18 November) football game. The 18 November data were particularly interesting as it reflects the NRC traffic associated with a special event superimposed on the RC attributable to the normal PM peak period for the local area. Finally, the August 2011 data are for NRC just before the school reopening when dormitories at the University of Alabama were opening and students were returning to school or being dropped off at school for the first time. | Table 1. Collected Data Description |
| | Date | Time Period | Type of Data | Congestion Type | | 3 – 5 August 2010 | 3:00 to 6:00 PM | Travel Time, Speed | RC | | 17 – 18 November 2010 | 3:00 to 6:00 PM | Volume, Travel Time, Speed | RC and NRC | | 20 August 2011 | 2:00 to 5:00 PM | Volume, Driveway count, Travel Time, Speed | NRC |
|
|
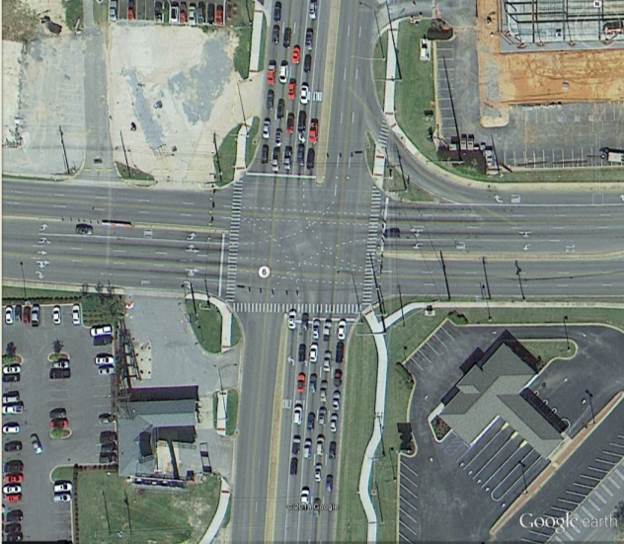
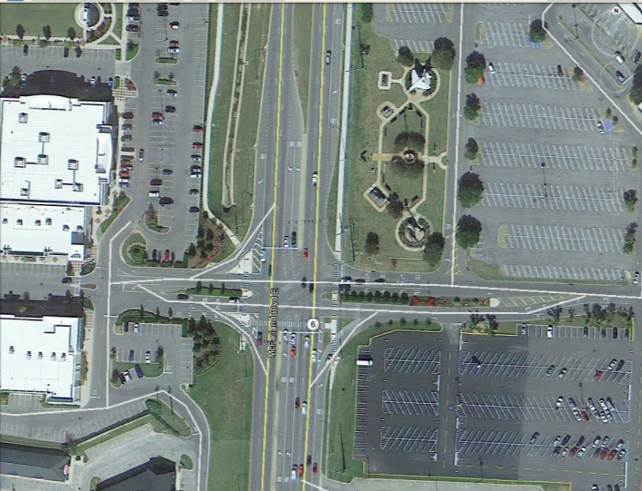
The data that were collected were the travel times along the southbound direction of McFarland Boulevard, see Figure 1. The data were collected using mini Global Positioning (GPS) trackers in vehicles driven along the route between the hours of 3:00 pm and 6:00 pm. Data were collected for the whole route that covers the Southbound and Northbound of McFarland Boulevard in between intersections Skyland Boulevard and University Boulevard. A total of nine cars were used during the data collection. Since the study road was a three-lane road, each lane was covered by one of the three cars. The runs were arranged in such a way that all the cars had some offset distance between them when the travel time study started. The number of test runs changed depending on the type of congestion. For recurrent congestion, it was typically 8 runs and for NRC it was 6 or less number of runs. Point data were recorded automatically in a very frequent way within the hours of 3:00 pm and 6:00 pm, for example 18 November point data includes about 12,000 data points for each lane separately. Figures 2a through 2e show a set of snapshots illustrating the main intersection layouts and cross sectional views. The different study segments exhibited different physical and operational parameters. Table 2 summarizes some of the key parameters affecting traffic operations for each of the three study segments and Figures 3 through 5 are aerial views of the segments provided for further context. | Table 2. Key Physical and Operational Parameters of the Study Segments |
| | Segment | 1 | 2 | 3 | | Description | 15th St. to Hargrove Rd. | Hargrove Rd. to 31st St. | 31st St. to 37th St. | | No. of Driveways South Bound | 11 | 3 | 15 | | No. of Driveways North Bound | 4 | 10 | 12 | | Segment Length | 1,007m | 680m | 606m | | No. of Signalized Intersections | 3 | 2 | 2 | | Length of shortest left-turn lane | 87m (2 lanes) | 72m (1 lane) | 107m (1 lane) |
|
|
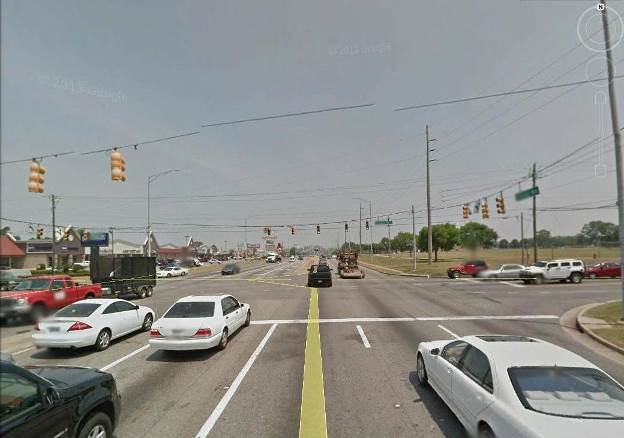 | Figure 2a. Typical intersection cross-section along study corridor |
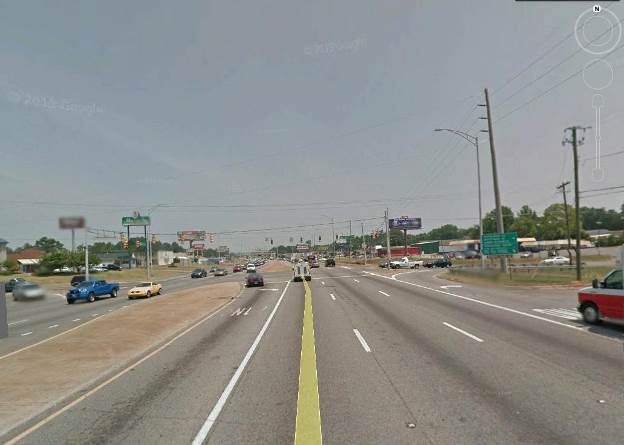 | Figure 2b. Typical midblock cross-section along study corridor |
 | Figure 2c. Sample intersection configuration along study corridor |
 | Figure 2d. Sample intersection configuration along study corridor |
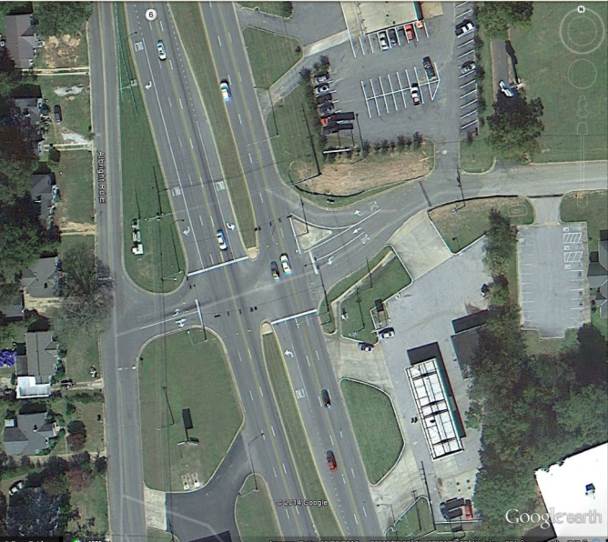 | Figure 2e. Sample intersection configuration along study corridor |
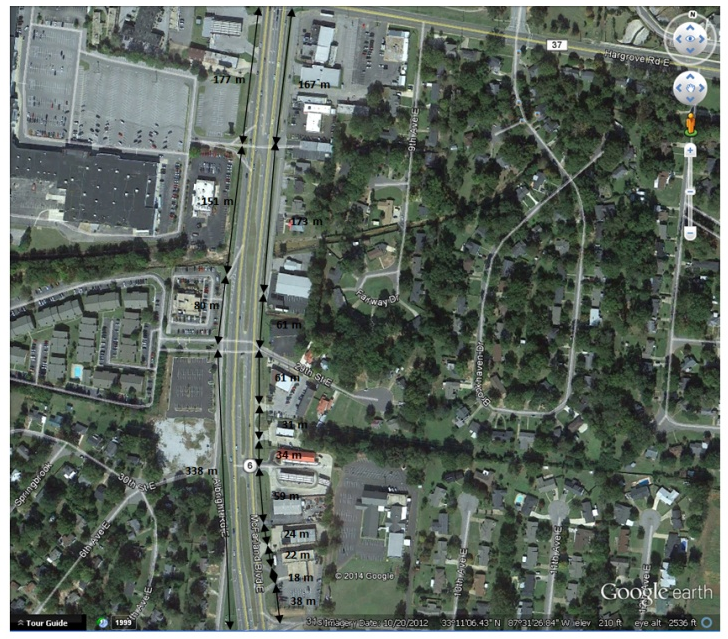
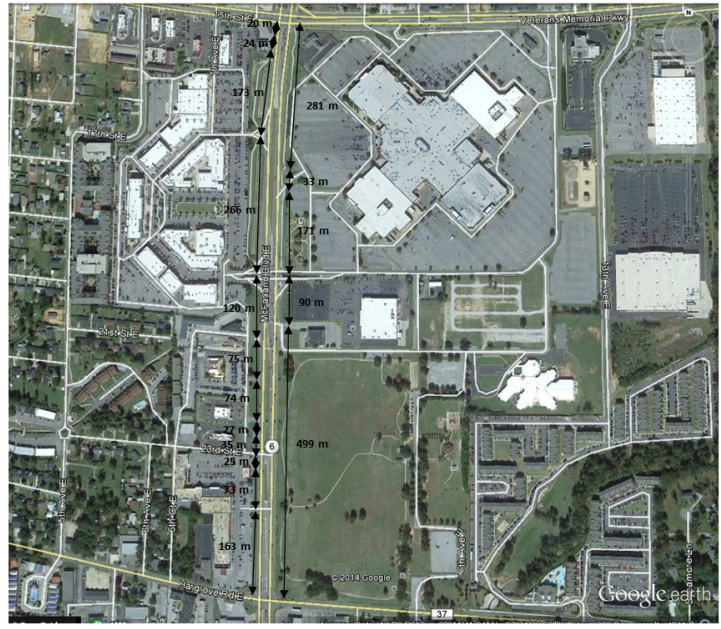 | Figure 3. Aerial view of Segment 1 – Hargrove Road and 15th street |
 | Figure 4. Aerial view of Segment 2 – 31st and Hargrove Road |
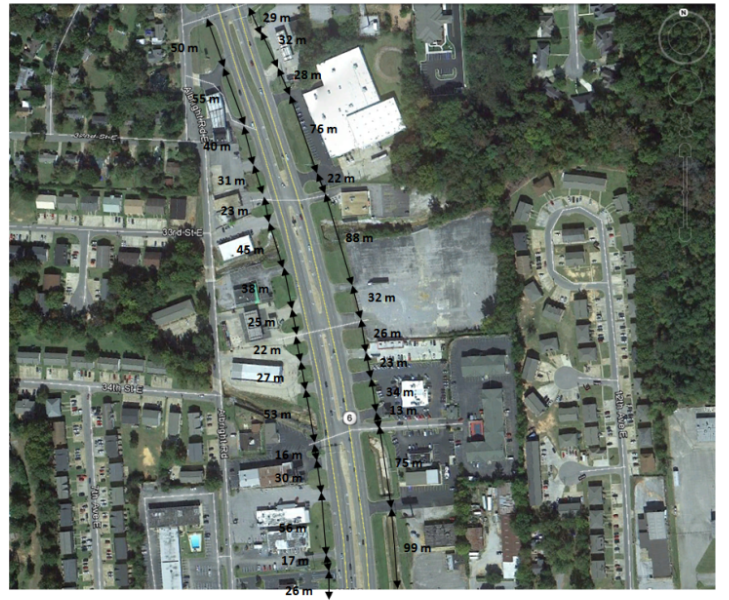 | Figure 5. Aerial view of Segment 3 – 37th and 31st street |
Data collected included the travel speed, in kilometers/hour, for the vehicles. The drivers of the vehicles were assigned to different lanes of traffic to determine the impact traveling in different lanes had on travel speed during the RC and NRC. The data were analyzed in a Geographic Information Systems (GIS) and the coordinates and travel speed for all drivers were plotted for visualization and the GIS was used for aggregation.
4. Data Analysis
Initially point data collected along the route from 3.00 pm to 6.00 pm were summarized by lane and by date. Average travel time, average speed and average congested length were determined to identify potential differences between RC ands NRC conditions. Initial analyses were performed on data collected over the entire study. These route-level analyses yielded average speeds for selected segments (37th to 31st, 31st to Hargrove, and Hargrove to 15th). Finally, a detailed analysis of three segments was performed on the 20 August data. The analysis comprised summaries of GPS point data (2.00pm to 5.00pm) into15-minute interval speed data for southbound direction of selected segments (37th to 31st, 31st to Hargrove and Hargrove to 15th) by lane. For the 3-5 August and 16-18 November data, southbound lane-specific average speeds of selected segments were computed. Thus, the lane types most impacted during NRC or RC condition were identified. In addition, driveway traffic counts and locations were gathered to assess if those factors have any impact on the speed of adjacent lane.
5. Results
The general route-level analyses did not indicate significant differentiation among the above parameters by date of RC situation and by lane. The summary data from the RC and NRC congestion situations presents some interesting discussion. First, when examining the RC (3-5 & 16 August) in the study area, it can be seen that the lane of travel does not influence the travel speed in the blocks, see Figure 6.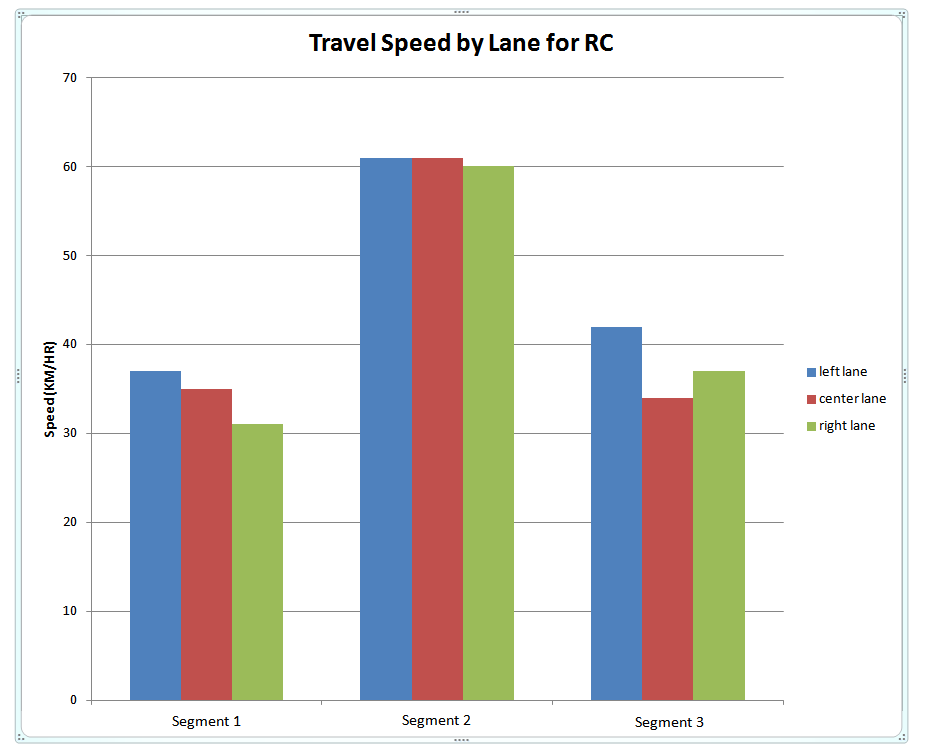 | Figure 6. Travel speed by lane during RC |
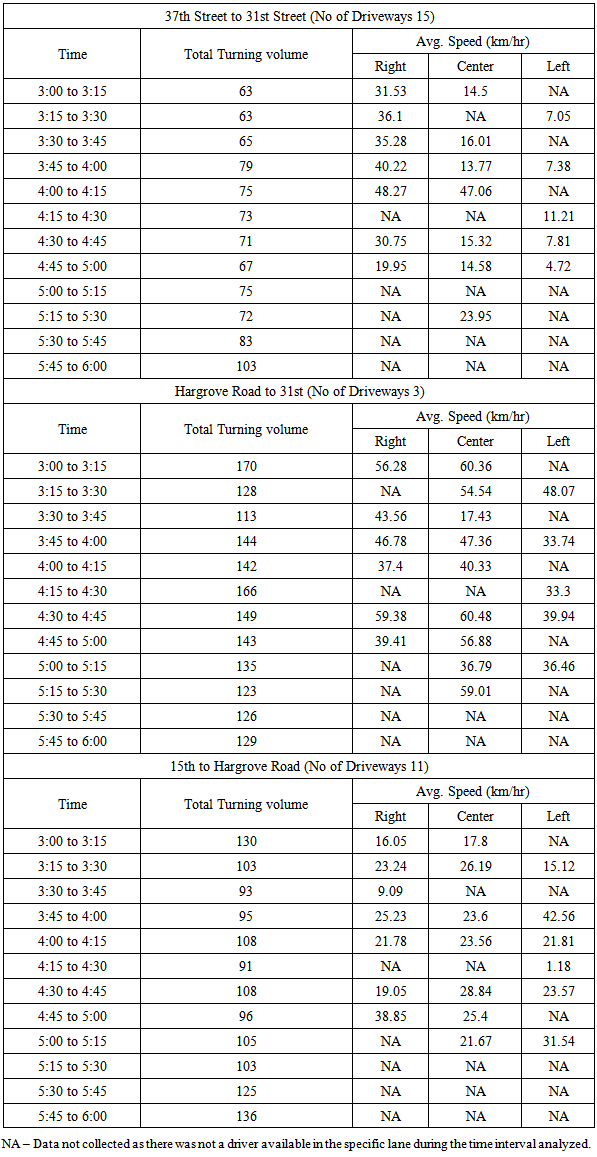
On the other hand, the detailed analyses performed for the 20 August NRC conditions of southbound traffic revealed very prominent differences in travel speed as shown in Table 3.Table 3. Average Speed Measured for the Three Study Segments
 |
| |
|
Table 3 shows that left lane speed values are close to zero or under 12 km/hr in several instances while the center lane speed gets lower because of the congestion of left lane. Figure 7 shows the average values of speed for selected segments prevailed on August 20. 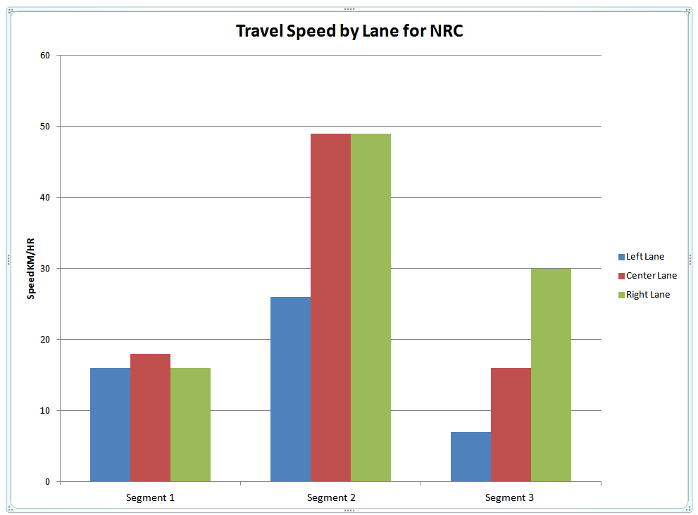 | Figure 7. Travel speed by lane during NRC |
During the NRC event, the travel speeds were slower in the left lane for two locations and in the center lane for the last locations, see Figure 7. This was observed even though the right lane is usually thought of as slower as there are a number of driveway access locations along the right-hand side of the roadway. In discussions with drivers of the data collection vehicles, the biggest impact the NRC had on the travel was the delays and back-up associated with the left-turn storage bays. In many instances during the NRC event, the left-turning traffic was forced into the left lane of the roadway, and in the location between 31st Street and 37th Street, the spill-over impacted the center lane as well. It is quite possible, that with a little extra length given to the left-turn storage bays, beyond what is necessary for the RC situation, the traffic along the roadway might have flowed at increased speeds.
6. Statistical Analysis
An Analysis of Variance (ANOVA) and Tukey’s test was performed for the 15-minute mean speed data. The analyses revealed that the mean values of speed were indeed statistically different between the lanes for NRC, specifically between 37th Street and 31st Street. All other mean values of speed between lanes for other segments were not observed to be statistically different for NRC condition. Similarly, for RC condition the mean values of speed were not found to be statistically different between lanes for any of the segments. The 17-18 November NRC data indicated the same except for one segment (31st to Hargrove) where ANOVA and Tukey’s tests showed right lane mean speeds statistically different from the speeds in the other lanes. The complete statistical analysis results are provided in Appendix.
7. Conclusions
This paper presents a brief examination of the impact of non-recurring congestion along a specific corridor as it related to data collected during an event. General, route-level observation was not sufficient to identify the effect of NRC on any specific lane. Therefore, data collected on the particular time of day supported more detailed statistical analyses. As can be seen from the data, the choice of lane during a NRC event can significantly influence travel. It is theorized by the authors that the lack of left-turn storage (combined with limited left-turn signal splits) during the NRC produced the impact on the flow of travel.It is recommended that future research be conducted to validate the impact of the left turn lane storage length and left turn signal phasing during NRC events. Such additional research could verify the impact of the left turning traffic as an impediment to traffic flow in the left lane of the facility. Use of microscopic traffic simulation can be used to perform sensitivity analyses on a range left-turn scenarios (volumes, timing splits, lane lengths, etc.). In conclusion, this research supports the need for detailed analyses of probable NRC traffic operations to ensure the most efficient outcomes possible for both RC and NRC in a given corridor.
ACKNOWLEDGEMENTS
The authors would like to thank the University Transportation Center for Alabama for its support for this work (Project No. 10104).
References
| [1] | Schrank, D., and Lomax, T., 2009. Urban Mobility Report. Texas Transportation Institute, College Station, TX, USA. p. 37. |
| [2] | Federal Highway Administration, 2009. Recurring Traffic Bottlenecks: A Primer, Report No. FHWA-HOP-09-037, U.S. Department of Transportation. |
| [3] | Liu, Y., Kim, W., Chang, G. Decision Model for Justifying the Benefits of Detour Operation under Non-Recurrent Congestion. ASCE Journal of Transportation Engineering, 139(1), pp. 40-49. |
| [4] | Hallenbeck, M.E., Ishimaru, J.M., and Nee, J., 2003. Measurement of Recurring versus Non-Recurring Congestion: Technical Report. Research Report for Washington State Department of Transportation, WA-RD 568.1, Seattle. |
| [5] | Bremmer, D., Cotton, K. C., Cotey, D., Prestrud, C. E. and Westby, G., 2004. Measuring Congestion - Learning from operational data. Transportation Research Record 1895, pp. 188-196. |
| [6] | Dowling, R., Skabardonis, A., Carroll, M., and Wang, Z., 2004. Methodology for Measuring Recurrent and Nonrecurrent Traffic Congestion. Transportation Research Record, 1867, pp. 60–68. |
| [7] | Srinivasan, D., Cheu, R., Poh, Y., Ng, A. 2000. Development of an intelligent technique for traffic network incident detection. Engineering Applications Of Artificial Intelligence, 13(3), pp. 311-322. |
| [8] | Li, C., and Chen, M. 2013. Identifying important variables for predicting travel time of freeway with non-recurrent congestion with neural networks. Neural Computing & Applications, 23(6), pp. 1611-1629. |
| [9] | Jin, P., Parker, S., Fang, J., Ran, B., Walton, C. 2012. Freeway Recurrent Bottleneck Identification Algorithms Considering Detector Data Quality Issues. ASCE Journal of Transportation Engineering, 138(10), pp. 1205-1214. |
| [10] | Ossenbruggen, P., Laflamme, E., Linder, E. 2012. Congestion Probability and Traffic Volatility. Transportation Research Record, 2315, pp. 54-65. |
| [11] | Guner, A., Murat, A., Chinman, R. 2012. Dynamic routing under recurrent and non-recurrent congestion using real-time ITS information. Computers & Operations Research, 39(2), pp. 358-373. |
| [12] | Loustau, P., Morency, C., Trepanier, M., Gouvrvil, L. 2010. Travel time reliability on a highway network: estimations using floating car data. Transportation Letters-The International Journal of Transportation Research, 2(1), pp. 27-37. |
| [13] | Chung, Y. Recker, W. 2013. Spatiotemporal Analysis of Traffic Congestion Caused by Rubbernecking at Freeway Accidents. IEEE Transactions on Intelligent Transportation Systems, 14(3), pp. 1416-1422. |
| [14] | Sheu, J. Chou, Y., Chen, A. 2004. Stochastic modeling and real-time prediction of incident effects on surface street traffic congestion. Applied Mathematical Modelling, 28(5), pp. 445-468. |
| [15] | Sheu, J. 2013. Microscopic traffic behaviour modelling and simulation for lane-blocking arterial incidents. Transportmetrica A – Transport Science, 9(4), pp. 335-357. |
| [16] | Lu, Y., Chang, G. 2012. Stochastic Model for Estimation of Time-Varying Arterial Travel Time and Its Variability with Only Link Detector Data. Transportation Research Record 2283, pp. 44-56. |
 Abstract
 Reference
 Full-Text PDF
 Full-text HTML