-
Paper Information
- Next Paper
- Previous Paper
- Paper Submission
-
Journal Information
- About This Journal
- Editorial Board
- Current Issue
- Archive
- Author Guidelines
- Contact Us
International Journal of Traffic and Transportation Engineering
p-ISSN: 2325-0062 e-ISSN: 2325-0070
2014; 3(4): 189-198
doi:10.5923/j.ijtte.20140304.03
Analysis and Assessment of Accident Characteristics: Case Study of Dhofar Governorate, Sultanate of Oman
 Abstract
 Reference
 Full-Text PDF
 Full-text HTML
Siham Gaber Farag1, Ibrahim H. Hashim2, Saad A. El-Hamrawy2
1Department of Civil Engineering, Middle East College, Knowledge Oasis Muscat, Sultanate of Oman
2Department of Civil Engineering, Faculty of Engineering, Menoufia University, Shebin El-Kom, Egypt
Correspondence to: Siham Gaber Farag, Department of Civil Engineering, Middle East College, Knowledge Oasis Muscat, Sultanate of Oman.
| Email: |  |
Copyright © 2014 Scientific & Academic Publishing. All Rights Reserved.
Traffic accidents have serious public health and economic concern all over the world especially in developing countries. Oman had registered as the highest road accident death rate in the GCC and third highest in the Eastern Mediterranean region. The analysis of accident characteristics is one of the most significant aspects that engineers rely on during the design of road networks and/or the safety performance evaluation of roadway systems. The main objective of this paper is to perform several statistical analyses for traffic accidents characteristic at the road network in Dhofar, Sultanate of Oman. Such analyses will help to explore the scale and main characteristics of traffic accidents for specific network system or location as well as identifying the hazardous locations and the most important variables that may be considered in building Accident Prediction Models (APMs). In this study a new methodology for recording and analyzing accidents data was established. Different types of accident and accidents’ causes were defined and analyzed in this study. Total of 5825 accidents was collected from Royal Oman Police (ROP) during 2007 to 2010. Statistical analysis was carried out using accident frequencies and accident rates. The results showed that “Collision between vehicles” has the highest ratio among the accident with 58% followed by “crashing with stationary” with 21%. Approximately 47% of total accidents occur at intersections, 90% of them occurred at un-signalized intersections (roundabout and T-intersections). About 68% of fatal accidents occur at road links. The sideswipe accidents have the highest ratio among accident types. The accident rates for roundabouts (0.61 accidents per million entering vehicles) are higher than the T-intersection rates (0.48 accidents per million entering vehicles). It seems that traffic volume and drivers’ characteristics, road network types, weather and time were the major factors affecting the number of accidents. The results of the study may have significant consideration for transportation and road safety planning in Sultanate of Oman and other countries in the Middle East area, especially Gulf countries with similar conditions.
Keywords: Accident analysis, Fatalities, Injuries, Accidents frequencies, Accident rates, Intersections
Cite this paper: Siham Gaber Farag, Ibrahim H. Hashim, Saad A. El-Hamrawy, Analysis and Assessment of Accident Characteristics: Case Study of Dhofar Governorate, Sultanate of Oman, International Journal of Traffic and Transportation Engineering, Vol. 3 No. 4, 2014, pp. 189-198. doi: 10.5923/j.ijtte.20140304.03.
Article Outline
1. Introduction
- Traffic accidents represent a worldwide major problem. Over 1.2 million people die each year on the world’s roads, and between 20 and 50 million suffer non-fatal injuries [1]. Over 90% of the world’s fatalities on the roads occur in low-income and middle-income countries. The global losses due to road traffic injuries are estimated to be US$ 518 billion and cost governments between 1% and 3% of their gross national product [1]. Oman has seen a remarkable development during the past four decades through the rapid economic growth, modernization, and the infrastructure development. This has reflected on the increase of automobile usage and the car ownership. The total number of licensed vehicles in 2013 was about 10690 with an increase of 5.4% in compared to the year 2012 [2]. However, this development is accompanied by several problems such as traffic accidents. According to the Global Road Safety Report 2013, Oman had registered 30.4 deaths per 100,000 people in 2010 [3].Oman registered as the highest death rate from road accidents in the GCC and third highest in the Eastern Mediterranean region [3]. In 2012 there are about 8209 accidents and about 888 deaths with increasing 0f 6% & 9% respectively comparing to 2011 [4]. The total value of the write-off cars due to accidents in 2012 costs the nation about 9.14 million R.O. [4]. About 64% people died in Oman aged between 20 and29 years due to road accidents [5]. Therefore, the problem constitutes a significant burden to Oman’s health care resources and a major concern for the national economic.Accidents are very complex events as these are combination of many factors such as highway geometry, driver behavior and human factors, speed limits, vehicle functions, and environmental conditions [6]. Targeting these factors and analysing them may provide better understanding for developing measures to improve their safety performance. Many countries have taken positive steps toward improving the institutional program to support road safety problem and have national road safety strategy authorized by the government [7, 8, 9, 10, 11].Oman is one of the innovative courtiers in adopting the good practices to improve the burden of traffic accidents on the local and international levels. “Traffic Safety Institute” is one of the examples of increasing the public awareness of traffic safety problem and cooperation for the social and health benefit of the Nation [12]. One of the most important steps in road safety strategy initiated by the government is the Scientific Research Council that encourages researches for all areas of road safety studies in the country [13].The analysis of accident characteristics is one of the most significant aspects that engineers rely on during the design of road networks and/or the safety performance evaluation of roadway systems. Accidents causality analysis builds upon statistical methods and artificial neural network. The previous approach relates the accidents and the causalities either by vehicles per population or traffic volume and time [14].The accident patterns at 25 intersections of an urban arterial road in Mirpur, Bangladesh for ten years was analysed by Anowar et al. [15]. They examined the characteristics of accidents by categorizing the arterial intersections into two major groups (i.e. urban intersections and suburban intersections). The rear-end accidents were the most frequent occurring accident types at urban intersections [15]. Several appropriate counter-measures were suggested to reduce fatal and injurious accidents [15].The comprehensive researches for trends and analysis of road traffic accident and its causality in Oman consider very limited and isolated attempt by individuals due to the lack of appropriate data. However, recently researches and accident statistics start to increase due to governmental and community awareness about that problem. A comparative analysis and evaluation for traffic accident characteristics and road safety in industrial, developing, and rich-developing countries was implemented by Galal. [14]. The analysis compared between the accident causes including driver behavior, road characteristics, vehicle condition, and level of enforcement, and fatality rates for 5 countries [14]. He found that fatality rates are higher in developing countries than industrial countries, while they are improved in rich-developing countries [14].MazharulIslam and Hadhrami [16] studied the relationship between the increased motorization and road traffic accidents in Oman. The growth of automobile is faster than the growth of the Omani population during the 10 year of study period [16]. The main results showed that about 50% of the total road traffic accidents in Oman are due to speeding followed by negligence or careless driving 29% [16]. Al-Maniri et al [17] analysed road traffic fatalities in Oman between1995 to 2009. The data was extracted on the distribution of deaths by age, gender, nationality, mode of travel (driver, passenger, pedestrians), and type of vehicle (four- vs. two-wheelers). The study used Chi-squared test and linear regression in the analysis. 48.5% were aged 26-50 years, 82.4% were males, 75.0% of deaths were Omanis, and 23.8% were pedestrians. Overall, mortality increased by around 50%. There was a significant increase in the proportion of deaths and death rates among individuals aged 26-50 years, males, Omani nationals, and drivers.The main objective of this paper is to perform several statistical analyses for traffic accidents characteristic at the road network in Dhofar, Sultanate of Oman. Such analyses will help to explore the scale and main characteristics of traffic accidents for specific network system or location. As well as identify the hazardous locations. The findings of this study may demonstration the necessity to change or improve the design of some locations; and identify the most important variables that may be considered in building Accident Prediction Models (APMs).To achieve these objectives a total of 5825 accidents were collected from Royal Oman Police (ROP) for four cities in Dhofar, Sultanate of Oman during the period of 2007 to2010. The accidents data were organized to characterize the accident patterns, such as accident characteristics (time and collision type), accidents severity (fatal and injuries), demographic feature of the accidents (gender and age), and accident location.
2. Data Collection
2.1. Study Area
- The Sultanate of Oman is a gulf country which lies on the southeast corner of the Arabian Peninsula with a total area of (309,500) squared km and total population of 2,340,815.The country is considered as a middle income country with per capita income $13,343 [18].Oman is divided administratively into four Governorates and five Regions. Dhofar is the fifth Governorate in population where the total population is 214,331, which represents 9.2% of the country total population. Dhofar has one of the most famous tourism seasons in Gulf area. In this season the traffic intensity increases by 15 to 17 percentages of normal year [19]. The transport system is mainly based on private cars as they constitute about 61% of traffic composition and there is no public transport system [19].
2.2. Accident Data
- The accident data were collected from Royal Oman Police (ROP) station citations and records during 2007 to 2010 for four cities in Dhofar Governorate.In Oman, ROP is the core organization for road accident data collection and storage. Under the current operating framework, police conducts investigation and are responsible for reporting of accidents. They use an investigation form called Accident Report Form (ARF).The recording system is based on manual documentation for accidents.The ARF contain date, time, main cause, number of vehicles involved, gender of drivers, age of the drivers, fatalities age, fatalities gender, injuries age, injuries gender, size of injuries, type of cars, size of damage, and accidents description, beside sometimes a diagram for the accident and some captured photos.Although the quality of data provided by ROP was good for accident statistics, many difficulties have emerged during the data collection process include:• No computerized data as records and citations were hand written.• No centralisation for accidents data.• Accidents location was not accuracy specified. • The type of collision was not explicitly mentioned. It can only be deduced from the accident description and diagrams. Many countries are using software such as Micro Computer Accident Analysis Package (MAAP). This is specifically developed by Transport Research Laboratory (TRL) of the United Kingdom specifically for storage and analysis of road accident data particularly for developing countries.Due to the existing recording system, a database has been designed to manage the data collection process and to facilitate the retrieval of the required records. The main effort in this study is to establish a methodology for collecting, recording and analysing the accident data. Therefore, this database could be a milestone to platform more safety analyses and researches. Figure 1 shows the designed database for collecting accident data. The database consists of six main groups including accident data, vehicles data, driver’s data, fatalities data, injury data, and attachment contains the related photos and diagrams.
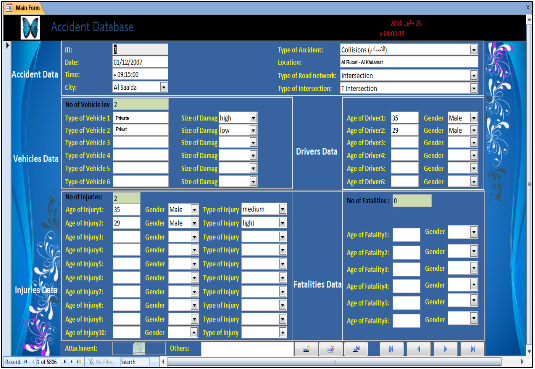 | Figure 1. The database used during the data collection process |
2.3. Geometric Data
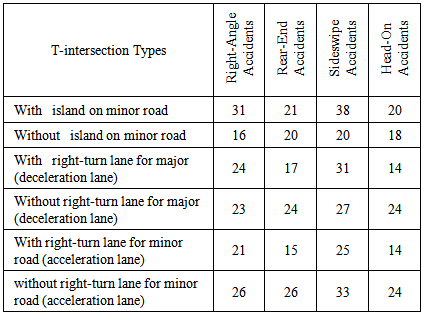
- The road geometric data were obtained from as built drawings obtained from Dhofar Municipality. Some geometric data were obtained from digital maps.A sample of 46 un-signalized intersections including 31 T-intersections and 15 roundabouts was chosen in this study. The selection for the sample was based on:• The availability of accidents and traffic volume data.• Most of these intersections record the highest accident frequencies. The selected T-intersections are classified to six types according to presence and absence of; channelization on minor road, right-turn lane for traffic coming from minor road (acceleration lane on major road), and right-turn lane for major roads for traffic coming from major road (deceleration lane on major road). All roundabouts have four arms. They are classified according to the number of lanes per approach (one or two lanes), the type of splitter island (>30m or >30m) presence and absence of right-turn bypass lane.
2.4. Traffic Data
- Traffic data Traffic volumes and speed data were obtained from Salalah Road Network Traffic Movement Study [18]. The traffic volumes in this study were converted to Annual Average Daily Traffic (AADT) using proper growth factors which of among 0.33% and 6.11%. [18]. The total traffic flows for the selected intersections ranged from 2000 to 45000 vehicles per day (vpd) for both T-intersections and roundabouts.
3. Data Analysis and Results
- The statistical analysis in this study was performed in two stages; the first was analysis of overall accidents trend, followed by a more detailed analysis of the scale, nature, and contributing circumstances of accidents. From this stage we able to identify the hazardous location on the network that lead to the next stage. The second stage was the analysis of accident characteristics for the specific intersections (T and Roundabouts) that recorded the highest number of accidents.
3.1. Accident Analysis of Overall Accidents
3.1.1. Accident Numbers and Severity
- There is a noticeable decrease in the total number of accidents with time. Figure 2 shows the accidents numbers and severity trend. There is a gradual decrease in the number of accidents between 2008 and 2009, and a large decrease between 2007 and 2008 as.
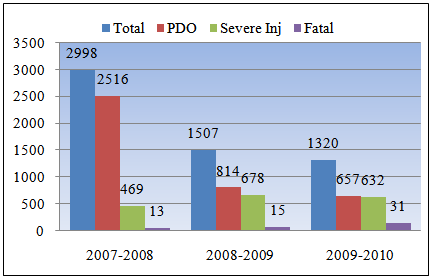 | Figure 2. Accident numbers and severity trends |
3.1.2. Variation of Accidents by Region
- The accidents distribution by the region is represented in table 1. Salalah has about of 56.8% of all accidents. It is the capital of Dhofar. It covers less than 1% of Dhofar area but has more than 70 % of the region population. It is the main transport node in the region and has most of ministries, governmental offices, and the airport [18].
| |||||||||||||||||||||||||||||||||||||
3.1.3. Variation of Accident’s Type by Region
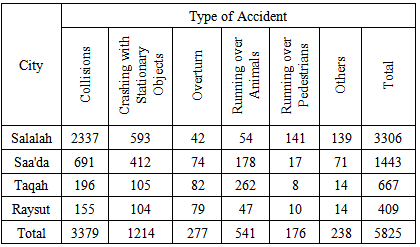
- Table 2 shows the accident’s type distribution by the region. The accidents are classified according to ROP reports to five types that are Collisions, Crashing with Stationary Objects, Overturn, Running over Animals, Running over Pedestrians. ‘Others’ is assigned to any combination between more than types.
|
3.1.4. Variation of Accidents by Site
- The “site” in this study is defined according to the location of accident and the topography of Salalah in terms of streets, intersections, akaba2, parking area, petrol stations, inside Salalah port and others (inside farms, companies, …etc.). Table 3 presents the accident distributions by the location.
3.1.5. Variation of Accidents by Severity
- Collisions between vehicles constitute about 58% of all accidents. Accidents involving vehicles represent 83.1% of fatal accidents, and 90.8% of injury accidents.This indicates that the drivers are the biggest road victims. Next comes “running over pedestrian” with less than 17% of fatalities and less than 10% of injuries. Table 4 shows the accident distribution by the severity.
| |||||||||||||||||||||||||||||||||||||||||||||||||||||||||||||
3.1.6. Variation of Accidents by Month
- In Dhofar there are three main seasons: the normal working days, the end of schools season, and Khareef (autumn) touristic season. Khareef Salalah is the second biggest festival in Oman. The traffic flow increases by 15% to 17% [18]. Figure 3 shows the distribution of accident severity by months of the year. The lowest number of accidents is in June, which coincides with the end of schools and departure of most non-Omani people and non-Dhofari students.
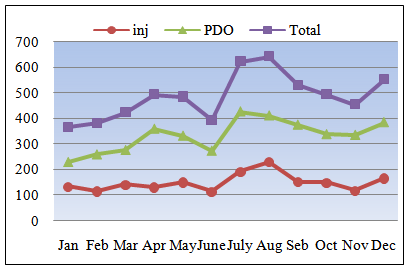 | Figure 3. Severity of accidents distributed through the year |
3.1.7. Variation of Accidents by Time of the Day
- The peak hours in Dhofar in the morning are between 7:00 AM and 8:00 AM and in afternoon between 2:00PM to 3:00 PM, while the evening peak hours start after 4:00 PM and continue until 9:00 PM [18]. During the Khareef season, the morning peak hours shifts to 11:00 AM to 12:00 AM [18]. Figure 4 shows the distribution of accidents types through the day’s hours.
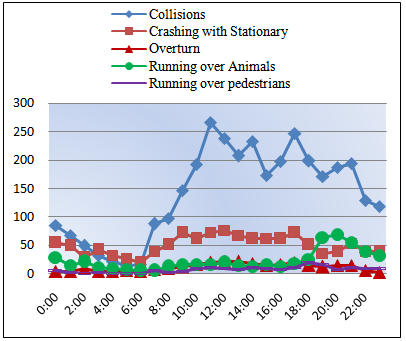 | Figure 4. Accident types distributed through the daytime |
3.1.8. Variation of Accidents by Vehicle Type
- Dhofar transport system is exclusively based on private vehicles. Private vehicles represent 60.7% of the total vehicles in Dhofar followed by commercial vehicles with 28.6% [18]. There is no intra-city public transport available and the motorcycle vehicles do not exceed 1 % of the total number of vehicles [18]. Figure 5 shows the distribution of total accidents according to type of vehicle.
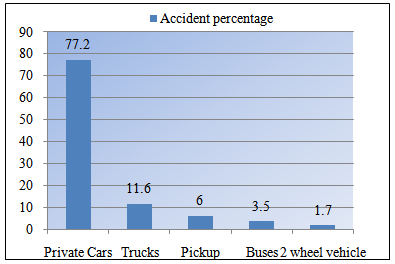 | Figure 5. Accidents variation by the type of vehicle |
3.1.9. Variation of Accidents by Causality
- About 42% of accidents causalities are between 20 and 30 years and more than 25% between 30 and 40 years. Figure 6 shows the distribution of total accidents according to causality age.
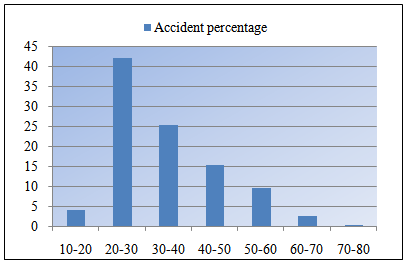 | Figure 6. Distribution of accidents according to the causality age |
3.2. Accident Analysis for Selected Intersections
- Previous Statistics show that 47.8% of total accidents occur at intersections. More details about the distribution of accidents per type of intersection will be presented in the next subsections.
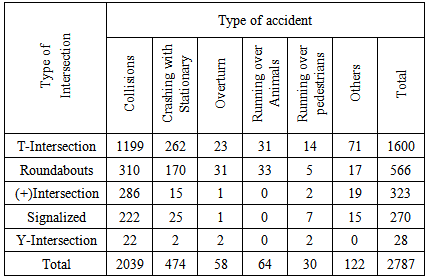
3.2.1. Variation of Accidents by Type of Intersections
- According to the road network system of Dhofar, it can distinguish between different types of intersections, namely, T-intersections, the roundabouts, + intersections, Y intersections, which are very rare and signalized intersections. Table 5 shows the distribution of accidents according to the type of intersections.
| |||||||||||||||||||||||||||||||||||||||||||||||||||||||||||||||||||
3.2.2. Variation of Intersection Accidents by Type
- The T-intersections are the most common of road network in Dhofar. They connect the major roads with the local streets. Table 6 shows the intersection accidents distributed by the type accidents.
|
3.2.3. Accident Analysis for Selected Intersections
- A total of 682 accidents were collected for the 46 un-signalized intersections distributed as 223 accidents for 31 T-Intersections and 459 accidents for 15 roundabouts. With respect of that the T-intersections types has the highest proportion of accidents at intersections by 57.4% and roundabouts have 20.3% of the total accidents at intersections. However, the number of T-intersections in the road network is too high comparing to number of roundabouts, which make the accidents per each type for roundabout is higher.
3.2.4. Distribution of Accidents According to the Type for T - intersection
- The 31 selected T-intersections are distributed according to the existence of channelization at minor road, right-turn lane for the major road, and right-turn lane for the minor road to six types. First, distribute the T-intersection sample according to the main type of accidents which are PDO, injury accident, and single accident as is shown in table 7.
|
|
3.2.5. Accident Rates at T-Intersections
- Accident rate (usually quoted as the number of accidents per million entering vehicles) reflects the exposure of site, which is considered the main factor affecting of accidents [22]. The accident rate per each type of T-intersections was calculated using equation 1.
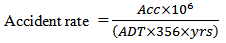 | (1) |
3.2.6. Accident Analysis for Selected Roundabouts
- A total of 459 accidents were collected for the 15 roundabouts. The accidents at the selected roundabouts were divided according to Roundabout Information Guide. Figure 7 shows the distribution of accident type at selected roundabouts.
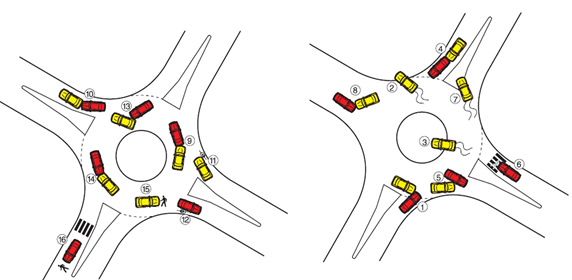 | Figure 7. Types of accident at roundabout [23] |
| |||||||||||||||||||||||||||||||||||||||||||||||||||||||||||||||||||||||||||||||||||||||||||||||||||||||||||
3.2.7. Accident Rates at Roundabouts
- The frequency method always ranks high volume locations as high accident locations. However, this may not reflect the real accidents rate. Figure 8 shows the distribution of accidents rate per roundabouts.
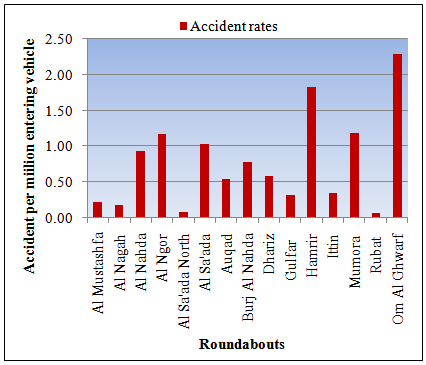 | Figure 8. Distribution of roundabouts by accident rates |
4. Conclusions and Recommendations
4.1. Summary and Conclusions
- The main conclusions based on this research are summarized as follows.A total of 5825 accidents were obtained for four cities in Dhofar causing 1779 injury accidents and 59 fatal accidents during the period from 2007 to 2010.Because of the manual recording system of accidents data, a database program was designed to manage the data collection process and to facilitate the retrieval of the required records.From the developed database it was possible to link the accidents with their locations' characteristics which were very difficult with the manual method in accident recording.For the selected intersections, the primary collision types were rear-ends, sideswipe, head-on, and right angle for T-intersections. According to the types of collisions in Roundabout design guide are failure to yield at entry, Rear-end, etc.Collision accidents has the highest ratio between the accidents with 58% followed by “crashing with stationary” with 20.8%. “Running over pedestrian” has a ratio of about 3% while “running over animal” has about 9%. 47.4% of the total accidents in Dhofar occur at intersections causing 52.2% of injury cases and 25.4% of fatal cases, where the highest proportion of fatal occurs at road links with almost 67.7%. More than 90% of total accidents occurred at intersections is for un-signalized intersections. T-intersections and roundabouts are responsible for 77.7% of accidents distributed as 57.4% for T-intersection and 20.3% for roundabouts. The accidents causality in Dhofar is about 67.3% for people aged between 20-40 years. 98.4% of accident causalities are males. Most accidents occur during June and July, which coincides with the tourist season in Dhofar and where the traffic volume increases and most of drivers are not familiar with the roads network are more frequent. About 77.2% of vehicles involved in accidents are private cars as the traffic system in Dhofar depends on this type with 60.7% of the traffic composition. Trucks come next with 11.6% followed by pickups with 6% and buses with 3.5%.682 accidents are used in this study for 46 un-signalized intersections distributed as 223 accidents for 31 T-intersections 459 accidents for 15 roundabouts. The 223 accidents of the 31 T-intersections include 84 injury accidents and 139 property damage only accidents (PDO). Existence of right turn lanes for both major and minor roads reduces the rear-end accidents by about 50% and side swipe accidents by 24.4%.The 459 accidents at 15 roundabouts include 99 injury accidents and 360 PDO accidents. Collision types were subdivided as the roundabout information guide 2000 in addition to other types especially for this case study. Using the accident rates in safety comparison changed the order of some intersections in accident distributions. The accident rates for roundabouts (0.61 accident/million entering vehicles) are higher than the T-intersection rates (0.48 accident/ million entering vehicles).
4.2. Recommendations
- However, Oman is one of the innovative courtiers to adopt the best practices to improve the burden of traffic accidents on the local and international levels, more effort still need to improve from the government, private sector, and individuals.It is highly recommended to evaluate and moderate the ROP data collection system. It is suggested to use software such as Micro Computer Accident Analysis Package (MAAP). This is specifically developed by Transport Research Laboratory (TRL) of the United Kingdom specifically for storage and analysis of road accident data particularly for developing countries.It is strongly recommended an education program and campaign to emphasize the accident risks for all age group of drivers as well as more guided campaign to the tourists during the Khareef Season.It must be strict driving license policy especially in the age 20-30 years.More than 9% of accidents are running over animals it is also recommended to use barriers where there is a passage of animals and warning signs may also be installed.Future studies to predict the number of accidents and relate accidents to geometric features, traffic characteristics, user’s behaviour and environmental factors.The current research is an approach to participate with national efforts in road safety engineering assessment and accident analysis. Finally, it hoped that the results of the study may have significant consideration for transport and road safety planning in Sultanate of Oman and other countries in the Middle East area, especially Gulf countries with similar conditions.
ACKNOWLEDGEMENTS
- The authors would like to acknowledge the support and assistance of the Royal Oman Police and the Directorate General of Traffic in Dhofar Governorate for their supply of the accidents data for this project. We would like also to acknowledge the assistance of Dhofar Municipality for the supply of the digital maps and traffic flow data needed in this study. This work would not have possible without help of them.
Notes
- 1. Simple accident, the parties of accidents are in agreement and the damages are limited on vehicles without any injuries, fatalities, or any public and private damage (ARF).2. The downslope of the mountains
References
| [1] | Peden, M., Toryan, T., Harvey, A., Bartolomeos, Ki., Laych, K., et al. (2009). "Global Status Report on Road Safety, Time For Action". World Health Organization. Geneva. |
| [2] | Ministry of National Economy (MoNE), 2014. Monthly Statistical Bulletin December 2014, Issue 25, Number 2. Muscat, (Oman):http://www.ncsi.gov.om/NCSI_website/publications.aspx?view=35. Retrieved on 06/03/2014. |
| [3] | Margaret Chan. (2013). "Global Status Report on Road Safety, Time For Action". World Health Organization. Geneva. |
| [4] | ROP (Royal Oman Police), (2013). "Facts and Figures." Directorate General of Traffic AGCC, Traffic week 2013. |
| [5] | MoH, "Ministry of Health Sultanate of Oman". (2009). "Health Information."[Online].www.moh.gov.om/stat/moh_fact_sheet.pdf, Retrieved on 25/6/2009. |
| [6] | Hashim, I.H. (2006). "Safety and the Consistency of Geometric and Speed on Rural Single Carriageways". PhD Thesis, University of Newcastle upon Tyne, United Kingdom. |
| [7] | Harwood, D.W., Council, F.M,. Hauer, E., Hughes, W.E., and Vogt, A. (2000). "Prediction of the Expected Safety Performance of Rural-Lane Highways." Office of Safety Research and Development, Federal Highway Administration. Technical Report, Report No.4584-09. |
| [8] | Zegeer, C. (1990). “Engineering and Physical Measures to Improve Pedestrian Safety.” in Effective Highway Accident Countermeasures, U.S. Department of Transportation, Washington, D.C. |
| [9] | Persaud, B. N., Retting, R. A., Garder, P. E., and Lord, D. (2001). "Safety Effect of Roundabout Conversions in the United States: Empirical Bayes Observational Before-After Study" Transportation Research Record, Transportation Research Board, National Research Council, Washington, D.C., 1751,1-8. |
| [10] | Elvik, R. (2003). "Effects on Road Safety of Converting Intersections to Roundabouts: Review of evidence from non-US studies." Transportation Research Record, Transportation Research Board, National Research Council, Washington, D.C., 1874, 1-10. |
| [11] | Ariniello, A.J. (2005). "Are Roundabouts Good For Business?" Proceedings of TRB National Roundabout Conference, Vail, Colorado. |
| [12] | Al-Qareeni, H.H. (2009). “Traffic Safety Institute Systematic Knowledge to Enhance Road Safety". Directorate of Public Relations, Royal Oman Police, Sultanate of Oman, [Online]. www.rop.gov.om/news/articles, Retrieved on 25/6/2009. |
| [13] | Oman News Agency (ONM). (2010). "Road Safety in the Sultanate / Workshop." [Online]. www.omannews.gov.om, Retrieved 29/12/2009. |
| [14] | Galal.A Ali, (2010).” Traffic Accidents and Road Safety Management: A Comparative Analysis And Evaluation in Industrial, Developing, And Rich- Developing Countries”. 29thSouthafrican Transport Conference (SATC2010) ISBN: 978-1-920017-47-7, Pretoria, South Africa. |
| [15] | Anowar. Sabreena, Didarul Alam. Md., and Asif Raihan Md., “Analysis of Accident Patterns at Selected Intersections of an Urban Arterial. ICTCT workshop Melbourne. |
| [16] | M. Mazharul Islam and Ahmed Y. S. Al Hadhrami, (2012).” Increased Motorization and Road Traffic Accidents in Oman”. Emerging Trends in Economics and Management Sciences (JETEMS) 3(6): 907-914.Scholarlink Research Institute Journals, 2012 (ISSN: 2141-7024. |
| [17] | Abdullah Ali Nasser Al-Maniri, Hamed Al-Reesi, Ibrahim Al-Zakwani, and Muazzam Nasrullah, (2013) “Road Traffic Fatalities in Oman from 1995 to 2009: Evidence from Police Reports”. International Journal of Preventive Medicine, 2013 June; 4(6), ISBN: 656–663. |
| [18] | Ministry of National Economy (MoNE), 2010. Statistical Year Book 2010, Issue 38, Number 2010.Muscat (Oman): MoNE. www.mone.gov.om. |
| [19] | Dhofar Municipality. (2006). "Salalah Road Network Traffic Movement Study."Office of the Minister of State and Governor of Dhofar. |
| [20] | Todd, L. and Steven, F. (2011). "Safe Travels: Evaluating Mobility Management Traffic Safety Impacts." Victoria Transport Policy Institute. (Another version of this paper was presented at the 85th Transportation Research Board Annual Meeting, January 2006). |
| [21] | ETSC. European Transport Safety Council (2007). "Social and Economic Consequences of Road Traffic Injury in Europe". Brussels. |
| [22] | A.S. Hakkert & dr. L. Braimaister, (2002) “The uses of exposure and risk in road safety studies”. Road users: the relation between behaviour, surroundings and accidents. SWOV, Leidschendam, 37.230. |
| [23] | Robinson, B.W., Rodegerdts, Scarborough, Lee. Wade., Kittelson, Wayne., Troutbeck, Rod., Brilon, Werner., Jacquemart, Georges., (2000). "Roundabouts: An Informational Guide." Federal Highway Administration (FHWA), Virginia, Informational Guide Book, Project 2425. |