-
Paper Information
- Next Paper
- Paper Submission
-
Journal Information
- About This Journal
- Editorial Board
- Current Issue
- Archive
- Author Guidelines
- Contact Us
International Journal of Traffic and Transportation Engineering
p-ISSN: 2325-0062 e-ISSN: 2325-0070
2014; 3(3): 141-148
doi:10.5923/j.ijtte.20140303.01
Driving Behaviour while Driving through Two Types of Road Works
 Abstract
 Reference
 Full-Text PDF
 Full-text HTML
Jos H. Vrieling 1, 2, Dick de Waard 2, Karel A. Brookhuis 2
1Royal HaskoningDHV, Urban Mobility North East, Postbus 8064, 9702 KB Groningen, The Netherlands
2Traffic and Environmental Psychology Group, Neuropsychology, University of Groningen, Grote Kruisstraat, 9712 TS Groningen, The Netherlands
Correspondence to: Dick de Waard , Traffic and Environmental Psychology Group, Neuropsychology, University of Groningen, Grote Kruisstraat, 9712 TS Groningen, The Netherlands.
| Email: |  |
Copyright © 2014 Scientific & Academic Publishing. All Rights Reserved.
Twenty-five drivers completed a ride in their own car over a standard motorway and through two types of road works, the standard Dutch road works design and an adapted format. The latter type included wider lanes, a higher posted speed limit and white instead of yellow delineation. During the rides video images of the road and the driver were made and stored together with GPS information. From these sources speed, lateral position, and number of hands on the steering wheel were scored. In addition, after passing each of the two road works and the control motorway section, the participants parked their car off the motorway and completed a questionnaire with questions about invested mental effort while driving over the section, and how they had experienced driving over that specific section. Results show that drivers more often considered the speed limit of the new road works to be appropriate than the speed limit of the current road works, and that the new type was more appreciated, and that compliance to the speed limit was better. Mental effort invested while driving through the road works was higher than while driving over the control road, but was similar while driving through the two types of road works, even if actual driving speed at the new road works was higher.
Keywords: Road works, Work zones, Lane width, Lateral position, Mental effort
Cite this paper: Jos H. Vrieling , Dick de Waard , Karel A. Brookhuis , Driving Behaviour while Driving through Two Types of Road Works, International Journal of Traffic and Transportation Engineering, Vol. 3 No. 3, 2014, pp. 141-148. doi: 10.5923/j.ijtte.20140303.01.
Article Outline
1. Introduction
- Although according to Paolo & Sar [1] accidents at road work account for less than 2% of accidents recorded over the whole road network, however the percentage accidents at road works on motorways is about double, 3 to 5%. Due to high speed, safety at road works on motorways is very relevant, on the one hand for the vulnerable group of road workers, on the other hand for the drivers of vehicles that drive through these road works. For the latter group road works are a disruption from normal driving [2, 3] and require behavioural adaptation. The most common required adaptation is a reduction in driving speed, and many studies have focused on how to take care that more drivers reduce their speed (e.g. [4]). Speed is a problem at many sites, and has been linked to accidents (e.g., [5]). It is remarkable that although drivers claim they understand the necessity to reduce speed and are aware of the lowered speed limit, not all slow down accordingly. Benekohal et al. [6] found that while 90% of the interviewed drivers noted the speed limit for the work zone and 78.5% considered the limit appropriate, whereas only 59% kept to the limit.Apart from safety, traffic flow is important at road works as well. Studies show a decrease in road capacity varying from 8% [7] to 17% [3], up to 24% [8]. Both authorities and road users prefer to avoid congestion. Factors that affect road capacity and influence flow at road works include [3]: • proportion Heavy Goods Vehicles (HVG), • road configuration, inclement weather, • work activity on site, the posted speed limit, and • lane width. Free flow speed may be reduced as a result of a reduced lane width. In a simulator study, speed on narrowed roads has been found to be reduced and experienced risk increased [9], even if these changes in road width were not consciously observed. The effect of lane width on speed reduction was also found with video camera observations at road works in practice [10]. Bakaba et al. [11] found a reduction of severe accidents as a result of a narrowed lane and a lowered speed limit at road works, showing that a reduction in lane width is not necessarily unsafe. Reduced lane width at road works is common practice, in the Netherlands at motorways the right hand lane width is normally (almost) preserved at 3.35 metres (normal width 3.5 m) to allow HGV to stay within that lane, while other lanes are reduced from 3.5 to 3.0 metres. This is accomplished by adding yellow instead of white road markings to reflect the temporary nature. To increase safety of road workers nowadays road barriers are also added at road works. Van der Horst & de Ridder [12] showed that when approaching a safety barrier drivers slow down slightly and position themselves laterally further away from the barrier, but these effects faded once drivers got used to the infrastructure. The authors found no guidance effect of a guard rail, however, they found an effect of presence of an emergency lane; if absent drivers drive further away from edge. In sum, effects of barriers and guard rails are found to be quite limited, in particular if an emergency lane (i.e. space) is available.Road delineation affects position in a driving lane and lane keeping. McKnight et al. [13] found reduced lane keeping performance in conditions of low-contrast delineation. De Waard et al. [14] found a clear shift in lateral position towards the right hand side after adding a centre line to a non-delineated road on lateral position. Adding an edge line lead to a position in the lane further away from the edge; more centrally. In sum, markings, as long as these have sufficient contrast, affect position on the road. Ter Kuile [7] studied driving behaviour at narrowed roads at road works on two-lane motorways. He found that traffic in the left hand lane chose a lateral position more towards the left hand side of the lane, and had a lower variation in positioning. In particular if there are Heavy goods Vehicles (HGVs) in the right hand lane this effect on position becomes clear [15]. Ter Kuile [7] also found that drivers tend to postpone overtaking actions and stay behind slower traffic in the right hand lane, in particular in the case of wide HGVs. Prior to the road works, however, after a road works ahead warning a relatively high number of drivers overtake slower vehicles.How drivers experience road works may be important for their driving behaviour, road works being a disruption from normal driving. Whether drivers adapt their behaviour and have understanding for the changes applied at road works, the changed environment, and lowered speed limit, was mainly studied by means of questionnaire studies (e.g., [6]). Road works may lead to annoyance; according to Glas et al. [16] factors responsible for this include no visible construction activities at road work sites, a confusing road layout, and delays. It may be argued that a lower speed at road works is preferable, both because the situation is different from normal and a lower speed allows for more time to process this information, and because in case of incidents the consequences of high speed in general are worse. However, if care is taken that safety margins and road worker safety is not reduced by means of an alternative road works infrastructure, a higher speed would allow for less disruption in flow, and potentially be more favourably evaluated by drivers as the situation is less distinctive and disruptive from a normal road.
1.1. Road Works and This Research
- Road works on motorways in the Netherlands usually are executed according to guideline 96a of C.R.O.W. (a technology platform for transport, infrastructure, and public space [17]). These guidelines emphasise safety of both road users and road workers. In general the speed limit is decreased with at least 30 km/h (typically to 80 or 90 km/h), the colour of the markings is changed from white to yellow, and lanes are narrowed. Furthermore, before road users enter the zone with road works, they are informed by signs on the speed limit and road works ahead. To reduce disruption, congestion, and potential annoyance [18, 19], a new type of road works infrastructure was introduced in 2010, with a higher posted speed limit, wider lanes compared to the usual road works, and white delineation instead of yellow. The new layout is expected to lead to less congestion, and to be less disruptive to drivers. Road works at the new location were estimated to take three and a half years but eventually took only 18 months. A condition for the new road works approach is that there needs to be more space for work activities available around the motorway than with the standard road works.In the present research the focus is on driver behaviour and evaluation of the road environment of two types of road works; standard and new as briefly described above, as compared with driving behaviour on and evaluation of normal motorways. The hypothesis is that drivers will appreciate the new type of road works more than the standard road works, and will keep better to posted speed limits. Evaluation of effects on overall traffic flow is not part of this study.
2. Method
2.1. Participants
- Twenty-five licenced drivers were recruited via social networks to serve as participants in the present study. Seven women and eighteen men participated, their mean age was 41 years (SD = 13 years) and they had held a full driver’s licence between 3 and 45 years (mean = 20 years, SD = 12 years). Their mean annual mileage was 24500 km (SD = 12550 km). An informed consent was signed by all participants and they were paid € 50,- for petrol costs and participating in the experiment.
2.2. Design
- The participants drove through the at present common type of road works (“guideline CROW 96A”) on the A28 motorway from Utrecht to Amersfoort. They also drove over a motorway without road works, serving as control road (A30 from Barneveld to Veenendaal) and through a new type of road works (motorway A12 from Veenendaal to Utrecht). All motorways were dual carriageways with two lanes per direction and an emergency lane, in Table 1 the characteristics of the three motorways are summarised.
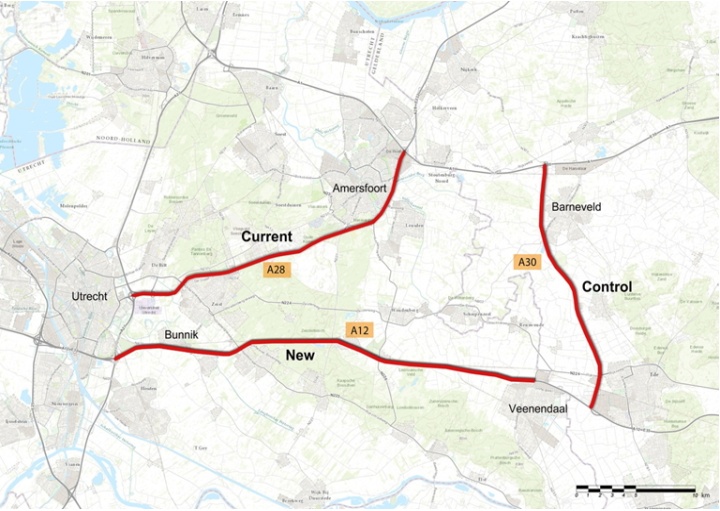 | Figure 1. Control road (A30), new road works (A12), and current road works (A28). Map source: Kadaster the Netherlands, 2011. The route was always driven clockwise, but participants started at three different locations: Barneveld, Veenendaal, and Bunnik |
2.3. Questionnaires
- The participants were asked after each of the three motorway segments to stop at a previously indicated location to complete a questionnaire with questions on road appreciation, signage, lane width, markings, and speed limit. The participants also were asked to mark the Rating Scale Mental Effort, RSME [20]; this scale runs from 0 to 150 (0 = no effort, 112= extreme effort) to rate subjective mental effort they had to invest while driving over the segment. At the end they completed a questionnaire with regard to demographic information.
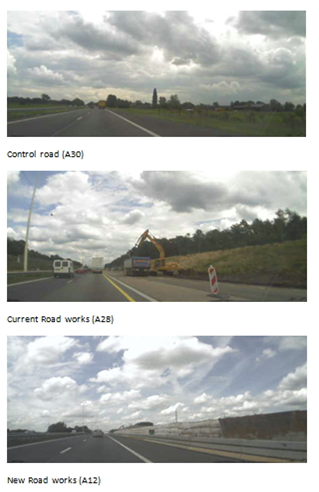 | Figure 2. Photographs of the three locations: the control motorway, the current and new road works layout |
2.4. Vehicle Parameters and Driver Behaviour Observation
- A Roadhawk RH2 was used to record footage of both the driver, driving behaviour (speed, lateral position) and the road environment, as shown in Figure 3. The device is equipped with a GPS-system allowing for speed and location measurement, updated every 1.5 seconds. It was attached to the windscreen below the mirror, not obstructing the driver’s view. Prior to the experiment participants positioned their vehicle with the wheels on the right hand of the road alongside a line. In this way the lateral position on the video of each participant was calibrated. The lateral position with respect to the line on the right hand side of the motorway was measured from video screen, calculating lateral position with a digital transparent ruler (JRulerPro version 3).
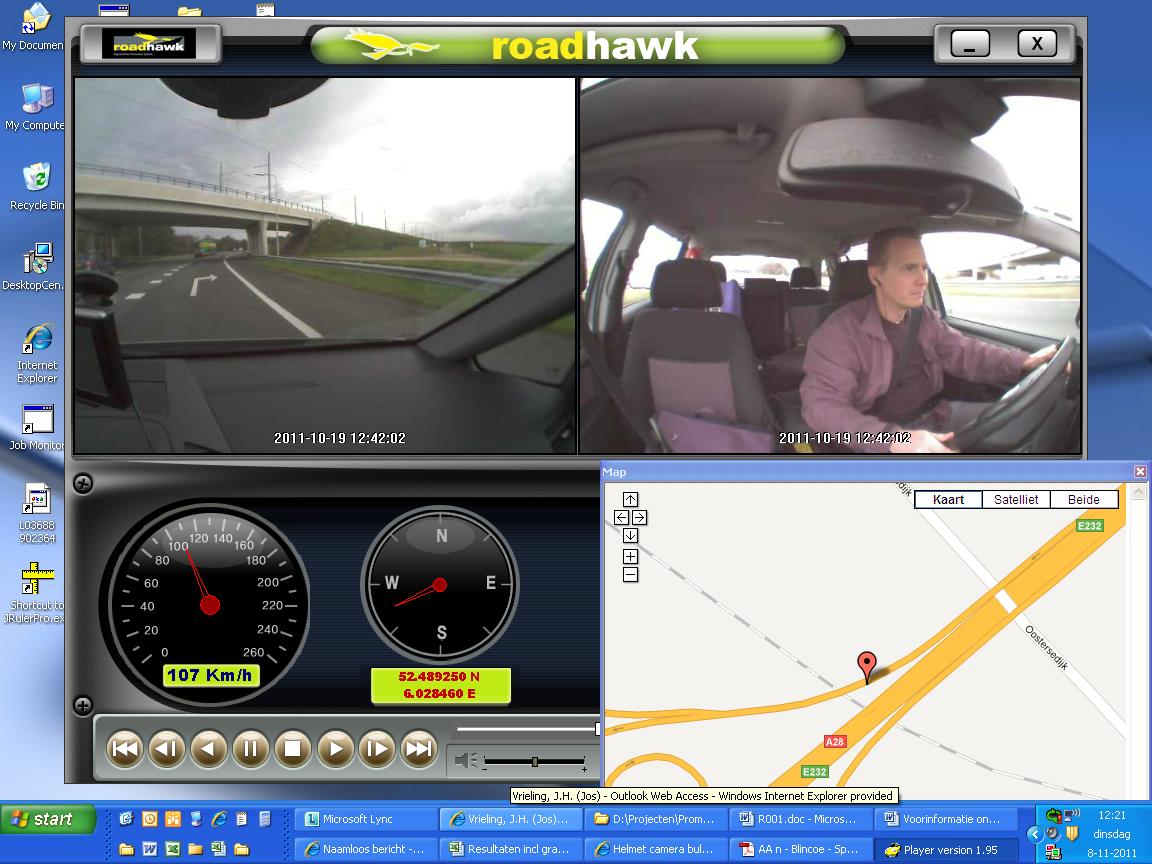 | Figure 3. Screenshot of recording with Roadhawk RH2, upper left: a view of the road environment, upper right: a view of the driver, lower left: virtual dashboard with speed and heading, lower right: location on basis of GPS coordinates (Google Maps) |
3. Results
3.1. Speed
- On the control road with a posted speed limit of 120 km/h the mean speed was 115 km/h (Figure 4). The mean speed at the new type of road works was 100 km/h, which corresponds to the posted speed limit, while at the road with the current common way of road works participants drove with mean speed of 94 km/h. The posted speed limit at the standard type of road works is 90 km/h. As speed limits differ, differences between the recorded speed and speed limits are shown in Figure 5.
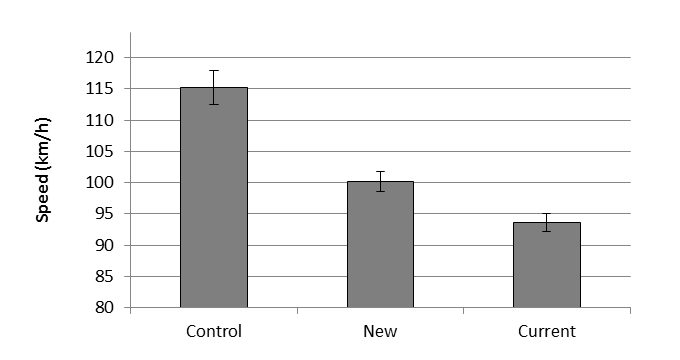 | Figure 4. Mean speed (km/h) in the right hand lane of the three segments, Control = a control motorway segment, New= the adapted road works, broader lanes, increased speed limit, current=the common way of road works at present. Error bars reflect Standard Error |
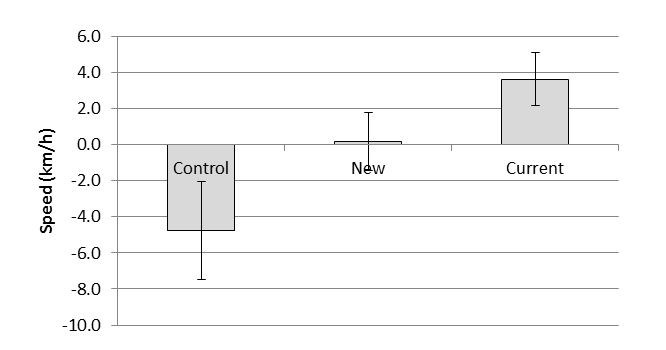 | Figure 5. Mean speed differences (km/h) compared to the speed limits at the right hand lane of the three segments. Error bars reflect Standard Error |
3.2. Lateral Position
- As lane width differed between conditions, the distance from the edge of the car to the centre of the 0.1 m wide edge line was used for analyses. The lateral positions at the three segments differed significantly (Figure 6, F(2,46) = 17.37, p < .001). At the control road participants drove closer to the centre line (left hand side of the right hand lane, 0.60 m) compared to both types of road works (0.84 m), as can be seen in Figure 5. The distance between the vehicle and the right hand edge line on the new type of road works was 0.89 m; this differed significantly from the current type of road works where the average was 0.74 m (p = .002). The distance between the vehicle and the right hand edge line on the control road was 1.13 m; this was also significantly different from the current type of road works (p < .001), but does not differ with the control road. Participants mainly drove in the right hand lane, just over thirty percent of the participants drove (a while) in the left hand lane at the three segments (F(2,48) = 0.167; NS). At the locations where samples were taken (see figure 1) for the control, current and new road works respectively 4, 4, and 8 % drove in the left hand lane. These drivers were excluded from the data.
 | Figure 6. Lateral position (m) at the three segments |
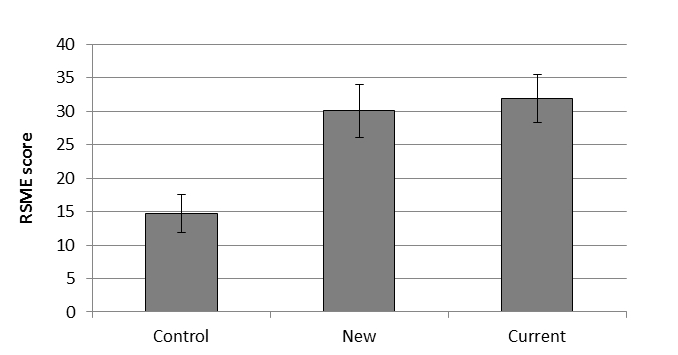 | Figure 7. Mean RSME (Rating Scale Mental Effort)-score for the three road segments. Error bars reflect Standard Error |
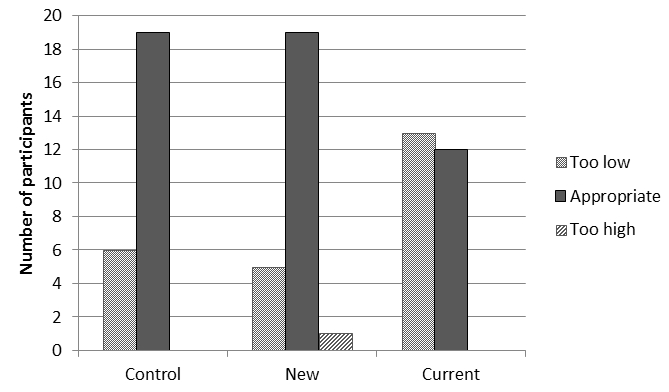 | Figure 8. Opinion about the posted speed limit., Control = a control motorway segment, New= the adapted road works, broader lanes, increased speed limit, Current=the common way of road works at present |
3.3. Position of the Hands on the Steering Wheel
- No differences in hand positions of the participants were found over segments (Friedman test, χ2(2) = 1.11; NS). Five (21%) held the steering wheel in high control positions, eight (33%) in median, and eleven (46%) in low control position.
3.4. Self-reported Mental Effort
- Figure 7 shows that reported mental effort (RSME [20]) at the new type of road works was similar to mental workload while driving past the current type of road works. Self-rated mental effort at the control road is significantly lower than at both types of road works (F(2,48) = 23.59; p < .001), but does not differ between the two road works segments (LSD difference, NS).
3.5. Opinion about Speed Limit and Lane Width, and Road Works
- At the current type of road works the participants were of the opinion that the posted speed limit was too low (Figure 8). The differences in opinion about the speed limits at the three segments are significant (χ2(2) = 8.38; p = .015, Wilcoxon Signed-Rank with LSD correction). Opinion about the speed limit did not differ between the new type of road works and the control road (Z = -0.71; NS) but did between the control road and the current type of road works (Z = -2.11; p = .035), and new and current type of road works (Z = -2.50; p = .013). One of the 25 participants considered the posted speed limit at the new type of road works too high.No significant differences were found when participants were asked about their opinion about the lane width at both types of road works, the majority (67%) considered the width “normal” on a five point Likert scale, 29% considered both the current and new road works lanes (very) narrow, (Friedman test, χ2(1) = 0.29; NS).In the survey, participants were also asked to describe the road works with three keywords. Most frequently mentioned were that the new type of road works were comparable to an ordinary road, but concrete blocks (for safety separation of the road workers) were frequently noted and mentioned. At the current type of road works participants mentioned ‘crowded’ as keyword most often. Whether this refers to the road environment or to a high vehicle intensity is not clear.
3.6. Intensity
- A potentially confounding factor in the study may be traffic intensity. On the basis of information collected by the Dutch Road Authority (Rijkswaterstaat) during the hours and days of testing it was found that 1220 vehicles passed per hour on the control road, 1720 on the new road works, and 1910 vehicles/h on the current road works (F(1, 22)=78.0, p<.001). Post hoc comparisons show that only differences with the control motorway were significant (p<.001), but not between the current and new type of road works. Other confounding factors may be the presence of HGVs, 6% more HGVs were present on the current road works location compared with the new road works (16 vs 21% respectively), and the behaviour of surrounding traffic. Data were not corrected or controlled for surrounding traffic as over conditions and over participants this influence is assumed to balance out.
4. Discussion
- Driving behaviour and subjective evaluation while driving through a new layout of road works that is characterised by a higher maximum speed limit, normal lane width, and white delineation, was compared with the current standard way of road works on motorways in the Netherlands with narrow lanes, a lower speed limit, and yellow delineation. Drivers completed a ride on the three road sections in their own vehicle that was equipped with GPS and cameras, and completed questionnaires after each section. The results demonstrated that the new layout was more appreciated than the standard layout, and that drivers did not exceed the speed limit while they did exceed the limit at the current road works. Mental effort as assessed with subjective scales and hand position on the steering wheel, and results did not show any differences between the two types of road works. However, self-reported mental effort was higher while driving through road works as opposed to driving over a control road, even though absolute differences were not large. In advance it was expected that mental effort ratings while driving through the new road works would be similar to the control motorway, but levels were found to be higher on all roads with works roads. Compared with the current road works, speed while driving through the new road works is close to the posted maximum limit, while at the current road works the speed limit is exceeded. Moreover, drivers consider this speed limit at the new road works to be more appropriate. Also, at both types of road works drivers drive closer to the edge line than on a control section of motorway. It is not clear why this is the case on the new road works, as lane width is identical to the control motorway. Perhaps mental effort plays a role here, since self-reported mental effort is higher while driving through both types road works compared to the normal motorway. It could be that increased mental load has affected position in the lane, and that road works are experienced as more demanding and a position more towards the right hand side increases margins to overtaking traffic. Alternatively, there could have been an effect of traffic intensity, as these differed between the three roads that were evaluated; intensity at the two road works was higher than at the control motorway. Unfortunately there was no similar intensity control road available that could easily be included in the track. It is important to stress that the intensities on the two road works roads did not differ significantly. Moreover, results from the questionnaire show that the posted speed limit is considered too low at the current road works, and drivers on average drove almost 4 km/h above the speed limit. It is remarkable that on the control road the average speed was 4.7 km/h below the limit, in particular as intensities were lower on this motorway. Opinion about lane width was expected to be more positive for the new road works, but this was not found, even if lane width was actually broader. Distance drivers kept to the centre line was similar at both types of road works. It should be kept in mind that differences between the two types of road works, though limited, in principle may be caused by any of the changed factors. Thus a raised posted speed limit, lane width and colour of the delineation may be responsible for the higher speed, and evaluation of appropriateness of the speed limit. In this study the effects of the whole set of measures on appreciation and behaviour was assessed. The finding that road users appreciated the new road works with higher speed limit means that effects on traffic flow are likely to be positive. However, it is also important that also the road worker’s perspective is taken: higher speed potentially means higher risk for them [5]. Strawderman and colleagues [5] found that nearly half of the fatal occupational injuries were workers being struck by moving vehicles. Although there are no indications yet that more accidents have happened at the new road works, future studies should shed light on the road worker’s perspective, in particular also on feelings of (un)safety, while working on the new road works.
5. Conclusions
- Drivers drove through a new road work approach with lanes of normal width, white delineation, and a higher speed limit and considered this limit more appropriate than the limit applied to the current road works. Their behaviour is in accord with this, they drive faster, however, they also keep better to the speed limit. At the current road works most participants drove about 10 km/h above the posted limit. In terms of mental effort invested, drivers rated both types of road works equally demanding. In sum, although restricted, the new road works allow for higher speed and thus potentially less delay in journey time. However, effects of higher speed on road workers were not assessed, and future studies should focus on this.
References
| [1] | Paolo, P., & Sar, D. (2012). Driving speed behaviour approaching road work zones on two-lane rural roads. Procedia - Social and Behavioral Sciences, 53, 673-682. doi:10.1016/j.sbspro.2012.09.917 |
| [2] | Godthelp, J., & Riemersma, J. (1982). Vehicle guidance in road-work zones. Ergonomics, 25, 909-916. |
| [3] | Al-Kaisy, A., & Hall, F. (2003). Guidelines for estimating capacity at freeway reconstruction zones. Journal of Transportation Engineering, 129, 572-577. doi:10.1061/(ASCE)0733-947X(2003)129:5(572) |
| [4] | Allpress, J. A., & Leland Jr, L. S. (2010). Reducing traffic speed within roadwork sites using obtrusive perceptual countermeasures. Accident Analysis & Prevention, 42, 377-383. doi:10.1016/j.aap.2009.08.014 |
| [5] | Strawderman, L., Huang, Y., & Garrison, T. (2013). The effect of design and placement of work-zone warning signs on driver speed compliance: a simulator-based study. IEE Transactions on Occupational Ergonomics and Human Factors, 1, 66-75. DOI: 10.1080/21577323.2012.714839 |
| [6] | Benekohal, R. F., Orloski, R., & Hashmi, A. M. (1993). Drivers' opinions on work zone traffic control. Transportation Quarterly, 47, 19-38. |
| [7] | Ter Kuile, R. J. (2006). Rijgedrag en verkeersafwikkeling bij werk in uitvoering met versmalde rijstroken. (Unpublished thesis). TU Delft, Delft. |
| [8] | Chandra, S., & Kumar, U. (2003). Effect of lane width on capacity under mixed traffic conditions in india. Journal of Transportation Engineering, 129, 155-160. |
| [9] | Lewis-Evans, B., & Charlton, S. G. (2006). Explicit and implicit processes in behavioural adaptation to road width. Accident Analysis & Prevention, 38, 610-617. doi:10.1016/j.aap.2005.12.005 |
| [10] | Chitturi, M. V., & Benekohal, R. F. (2005). Effect of lane width on speeds of cars and heavy vehicles in work zones. Transportation Research Record, 1920, 41-48. doi:10.3141/1920-05 |
| [11] | Bakaba, J. E., Enke, M., Heine, A., Lippold, C., Maier, R., & Ortlepp, J. (2012). Untersuchung der verkehrssicherheit im bereich von baustellen auf bundesautobahnen (Study on traffic safety near road works on German motorways). Berlin: Gesamtverband der Deutschen Versicherungswirtschaft e. V. |
| [12] | Van der Horst, R. & de Ridder, S. (2007). Transportation Research Record: Journal of the Transportation Research Board, No. 2018, Transportation Research Board of the National Academies, Washington, D.C., 2007, pp. 36–44. DOI: 10.3141/2018-06 |
| [13] | McKnight, A.S., McKnight, A.J., & Tippetts, A.S. (1998). The effect of lane line width and contrast upon lanekeeping. Accident Analysis and Prevention, 30, 617–624. |
| [14] | De Waard, D., Steyvers, F.J.J.M., & Brookhuis, K.A. (2004). How much visual road information is needed to drive safely and comfortably? Safety Science, 42, 639-655 |
| [15] | Bosch, J. (2000). Het rij- en inhaalgedrag op versmalde rijstroken. (driving and overtaking behaviour on narrowed lanes). Rotterdam: Ministry of transport |
| [16] | Glas, G., Brave, B., & Both, J.M.G.M. (2010). Minder hinder gezien vanuit de weggebruiker: Wegwerkzaamheden vanuit een gebruikersperspectief. Delft, The Netherlands: Ministry of Transport. |
| [17] | CROW. (2011). Afstemmen en hinderanalyse bij werk in uitvoering. Ede: CROW. |
| [18] | Huisman, G. C. A. (2008). Gun op minder hinder! - hinder als gunningscriterium bij de aanbesteding van grootschalige wegwerkzaamheden. (Unpublished Master). CTW: Engineering Technology, University of Twente, Enschede. |
| [19] | Koffrie, J., Hoernig, P., & Van der Veen, P. (2011). Werkwijzer MinderHinder. deel B, de uitwerking. (No. 2.0). Utrecht: Rijkswaterstaat. |
| [20] | Zijlstra, F.R.H. (1993). Efficiency in work behavior. A design approach for modern tools. PhD thesis, Delft University of Technology. Delft, The Netherlands: Delft University Press. |
| [21] | De Waard, D. Van den Bold, T.G.M.P.R., & Lewis-Evans, B. (2010). Driver hand positions on the steering wheel while merging into motorway traffic. Transportation Research Part F, 13, 129-140. |